


Daifuku H1 FY2026 Earnings Analysis: Record-High Performance Driven by Semiconductor Investment Expansion, Full-Year Guidance Upwardly Revised with Dividend Increase

StockClub
Published: Aug 06, 2026, 10:51 AM
Sentiment Analysis
Daifuku H1 FY2026 Earnings Analysis: Record-High Performance Driven by Semiconductor Investment Expansion, Full-Year Guidance Upwardly Revised with Dividend Increase
Daifuku Co., Ltd. , the global leader in material handling systems, released its financial results for the first half (H1) of the fiscal year ending December 31, 2026, on August 6, 2026.
Fueled by robust demand for advanced semiconductor investments driven by the proliferation of generative AI, the company achieved record-high H1 results across key metrics, including orders received, net sales, and operating profit. Consequently, the company announced an upward revision to its full-year consolidated earnings forecast and an increase in its annual dividend.
This report extracts 10 key topics from the released financial materials, systematically explaining the background of the H1 performance, segment and regional trends, full-year outlook, and shareholder return policies.
1. Overall Financial Results: All Key H1 Metrics Reach Record Highs
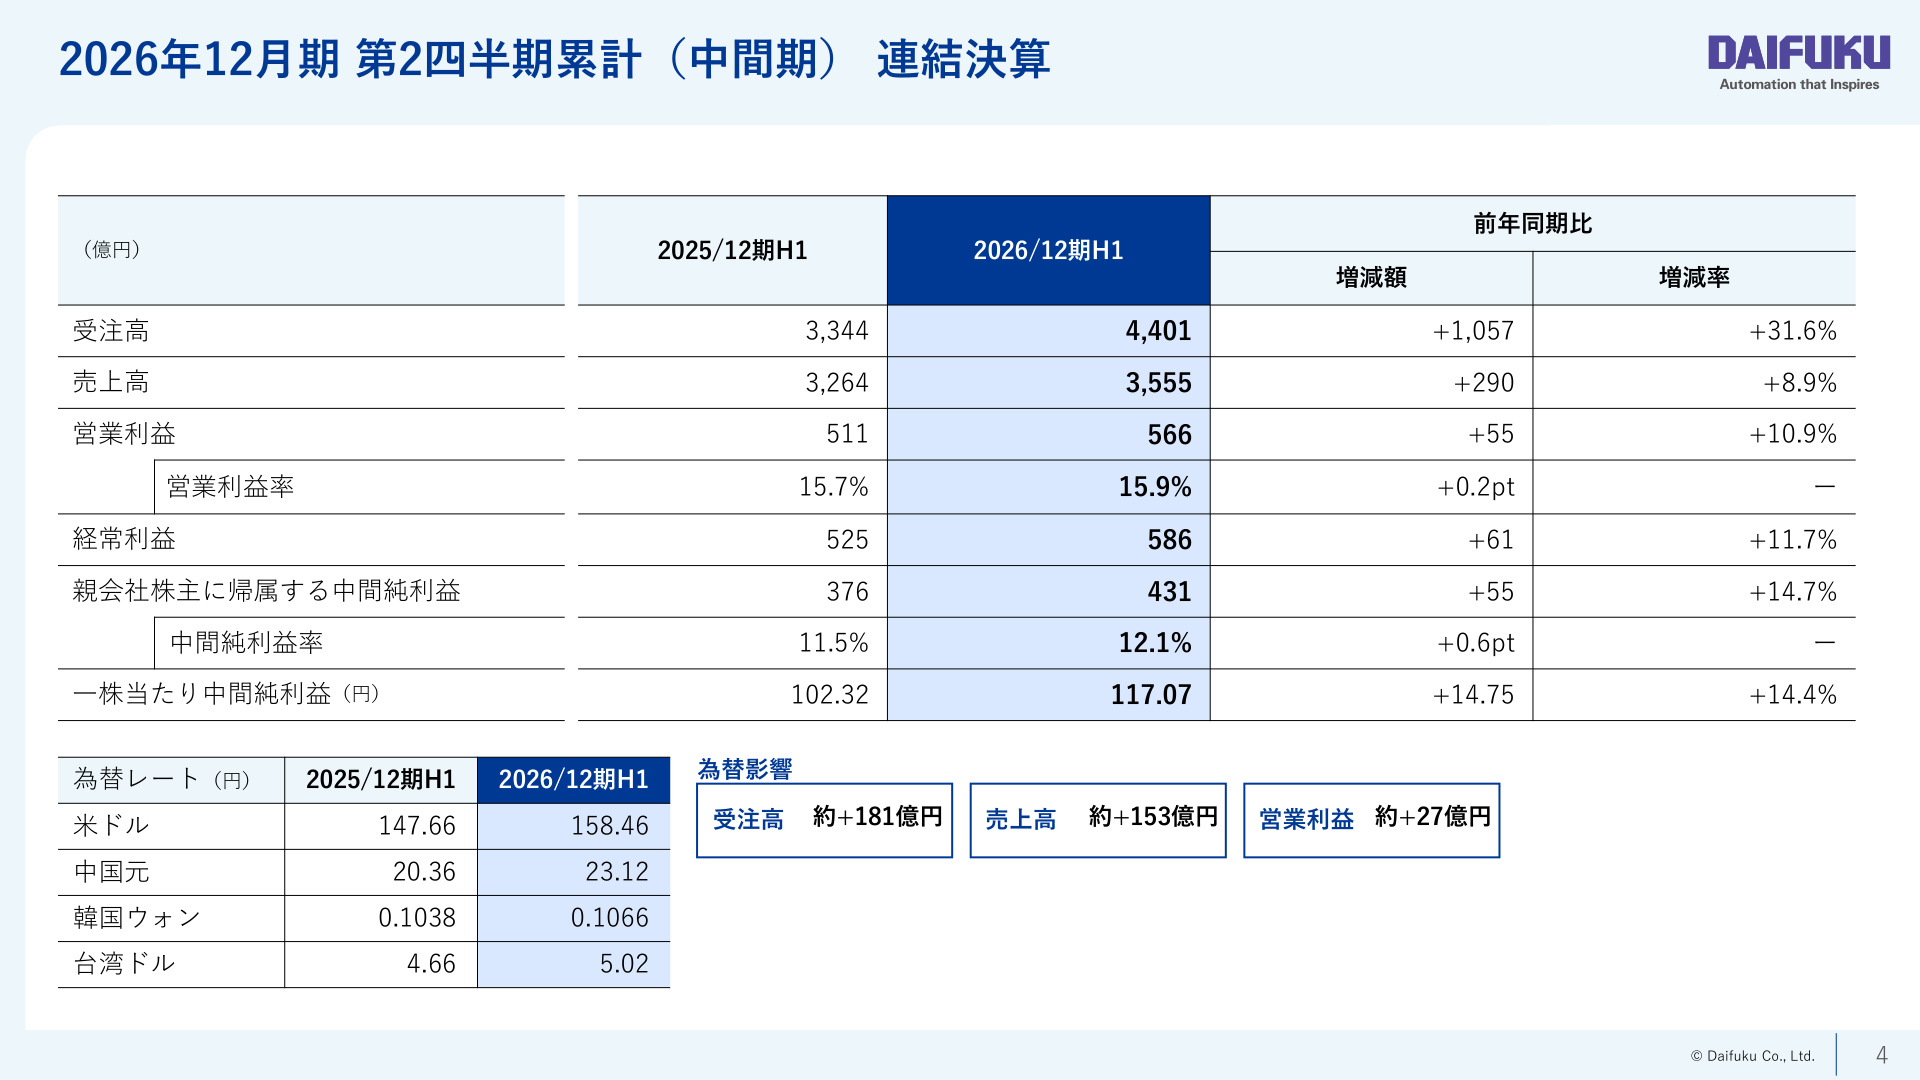
In the first half of the fiscal year ending December 31, 2026 (January 1, 2026 – June 30, 2026), Daifuku achieved significant year-on-year growth in both revenue and profit.
- Orders Received : 440.1 billion yen (+31.6% YoY / +105.7 billion yen)
- Net Sales : 355.5 billion yen (+8.9% YoY / +29.0 billion yen)
- Operating Profit : 56.6 billion yen (+10.9% YoY / +5.5 billion yen)
- Operating Profit Margin : 15.9% (+0.2pt YoY)
- Ordinary Profit : 58.6 billion yen (+11.7% YoY / +6.1 billion yen)
- Net Income (H1) : 43.1 billion yen (+14.7% YoY / +5.5 billion yen)
Performance was driven by steady project execution and revenue recognition backed by a substantial order backlog from the previous fiscal year, alongside strong demand for systems tailored for semiconductor production lines.
[Image Commentary: Key Points of H1 Consolidated Results]
The slide above (Slide 5) provides a basic summary of the H1 results, showing year-on-year comparisons and the impact of foreign exchange rates.
The significance of this slide lies in the fact that it demonstrates "strong underlying profit growth even excluding the tailwind from currency fluctuations." The depreciation of the yen (with the USD moving from 147.66 yen to 158.46 yen, and the Chinese Yuan from 20.36 yen to 23.12 yen compared to the same period last year) had a positive impact of approximately +18.1 billion yen on orders, +15.3 billion yen on sales, and +2.7 billion yen on operating profit. While about half of the 5.5 billion yen increase in operating profit is attributed to FX effects, the remaining half is supported by improved project management and higher gross margins through production efficiency , indicating a steady strengthening of the company's core profitability.
2. Factors Behind Operating Profit Change: Higher Costs Absorbed by Margin Improvements and Revenue Growth
Operating profit for the first half increased by 5.54 billion yen to 56.6 billion yen , up from 51.1 billion yen in the same period last year. The detailed breakdown is as follows:
- Gross Margin Fluctuation (+5.54 billion yen) : Profit margins improved due to rigorous project management, on-site construction efficiency, and cost reduction initiatives.
- Net Sales Fluctuation (+3.35 billion yen) : Increase in marginal profit due to higher sales.
- Foreign Exchange Fluctuation (+2.68 billion yen) : Positive contribution from the yen's depreciation against major currencies.
- SG&A Expenses Fluctuation (-6.01 billion yen) : Expenses increased due to investments in human capital (higher personnel costs) and proactive R&D spending for future growth.
This demonstrates a sound profit growth structure where the increase in future-oriented personnel and R&D expenses (-6.01 billion yen) is fully covered by the company's own profit improvement efforts (+5.54 billion yen in gross margin) and sales growth.
3. Order Backlog Expands to a Record 741.1 Billion Yen
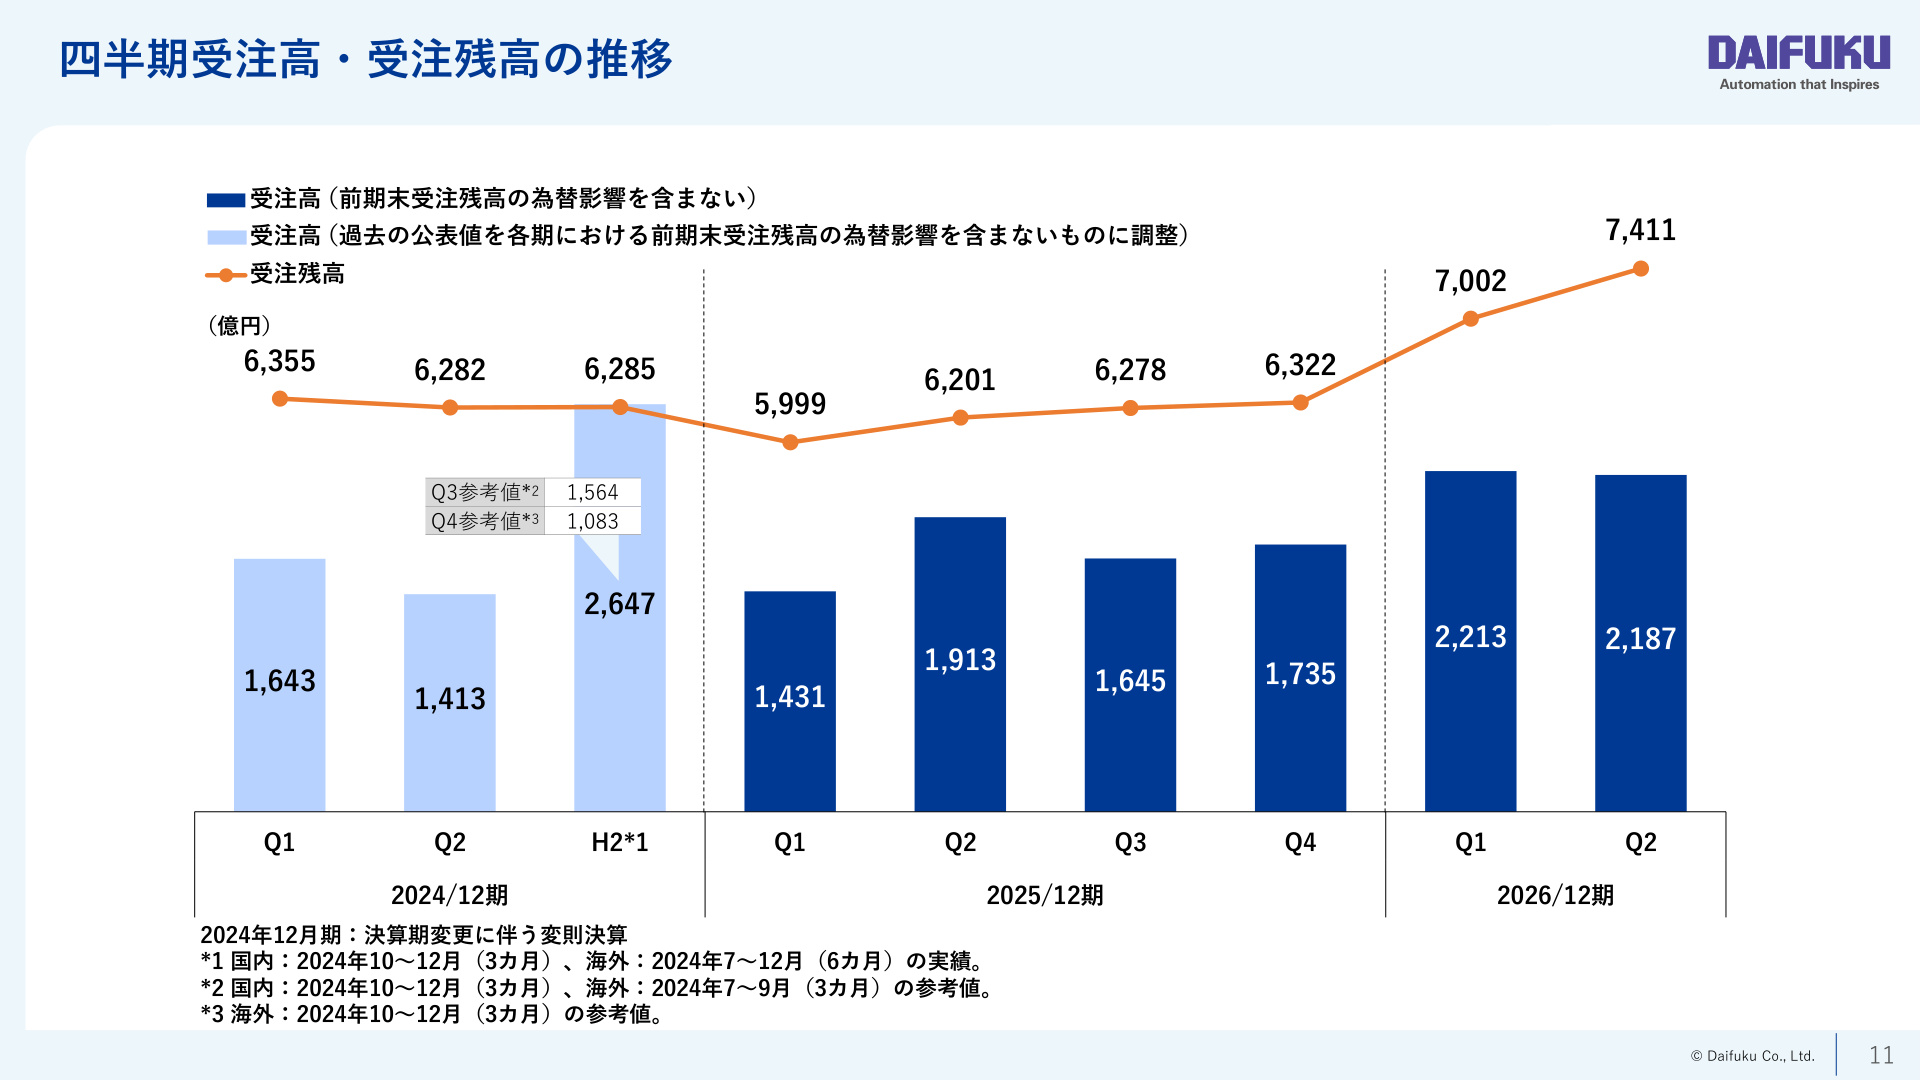
In Daifuku's business model, the order backlog—a leading indicator of future sales—is showing an extremely favorable trend. Quarterly orders remained high at 221.3 billion yen in Q1 and 218.7 billion yen in Q2, bringing the order backlog to 741.1 billion yen as of the end of Q2 (June 30, 2026).
[Image Commentary: Trends in Quarterly Orders and Backlog]
The slide above (Slide 12) shows the quarterly trends in orders received and the order backlog. The primary takeaway from this data is that "a wealth of construction projects (the source of future sales and profit) for the next 1–2 years has been fully secured." The order backlog has been on an upward trend since bottoming out at 599.9 billion yen at the end of Q1 FY2025, finally surpassing the 740 billion yen mark. This symbolizes the full-scale recovery of global advanced semiconductor investments , particularly for generative AI, and the overwhelming demand for the company's cleanroom transport systems.
4. Segment Trends: Clean Factomation (Cleanroom Systems) Shows Significant Growth
Performance trends across reporting segments clearly highlight the company's strengths in specific fields:
- Daifuku (Parent Company/Domestic Business) : Orders 141.5 billion yen (+45.5 billion yen YoY), Sales 112.6 billion yen (-21.6 billion yen YoY), Segment Profit 37.1 billion yen (+3.1 billion yen YoY). Orders for general manufacturing, distribution, and semiconductors grew significantly.
- Clean Factomation (Cleanroom Transport Systems) : Orders 64.0 billion yen (+28.5 billion yen YoY), Sales 40.0 billion yen (+21.2 billion yen YoY), Segment Profit 7.3 billion yen (+5.8 billion yen YoY). Riding the wave of advanced semiconductor investment for generative AI, the segment recorded explosive growth in orders, sales, and profit.
- Daifuku North America : Orders 113.5 billion yen (flat YoY), Sales 90.7 billion yen (+9.8 billion yen YoY), Segment Profit 7.1 billion yen (-1.0 billion yen YoY). Orders remained at a high level, and sales progressed steadily.
- Others (China, Korea, Taiwan, etc.) : Orders 82.3 billion yen (+15.8 billion yen YoY), Sales 79.3 billion yen (+17.2 billion yen YoY), Segment Profit 10.6 billion yen (+4.7 billion yen YoY). Performance was excellent, particularly for semiconductor and LCD manufacturing hubs in Asia.
5. Regional and Industry Trends: Asia and Electronics Drive Overall Growth
Looking at the composition by destination and industry, the current demand structure becomes even clearer.
By Destination (Region)
The overseas sales ratio has reached 77.0% . In particular, orders in the Asia region (China, Korea, Taiwan, etc.) surged to 206.3 billion yen (+75.8 billion yen YoY, accounting for 46.9% of the total). Taiwan (74.8 billion yen), Korea (65.1 billion yen), and China (55.7 billion yen) all significantly outperformed the same period last year.
By Industry
Electronics (Semiconductors, LCDs, etc.) is the dominant sector.
- Orders Received : 203.2 billion yen (46.2% of total / +86.5 billion yen YoY)
- Net Sales : 151.3 billion yen (42.6% of total / +25.1 billion yen YoY)
While commerce/retail (63.5 billion yen in orders), airports (62.9 billion yen), and automotive (43.3 billion yen) remain steady, the electronics sector is functioning as the primary engine for growth.
6. Stock-type Business: Steady Accumulation of Service Sales
The service business (stock-type business), which handles maintenance, repairs, and replacements after system installation, serves as a stable, high-profit foundation.
- H1 Service Sales : 48.0 billion yen in Q1 and 45.8 billion yen in Q2, totaling 93.8 billion yen .
- Ratio to Net Sales : Maintained at a high level of 25–28% .
- Full-Year Forecast : Expected to reach 200.3 billion yen (27% of net sales) for the full year.
As the company's system installation track record grows, service demand accumulates automatically, enhancing the business's resilience against economic fluctuations.
7. Upward Revision of Full-Year Forecast and Dividend Increase
Due to strong H1 performance and a favorable demand outlook for the second half, Daifuku has comprehensively revised its full-year consolidated earnings forecast for FY2026 upward . The assumed exchange rate has also been revised from 150 yen to 158 yen per USD.
[Image Commentary: Key Points of Full-Year Earnings Forecast Summary]
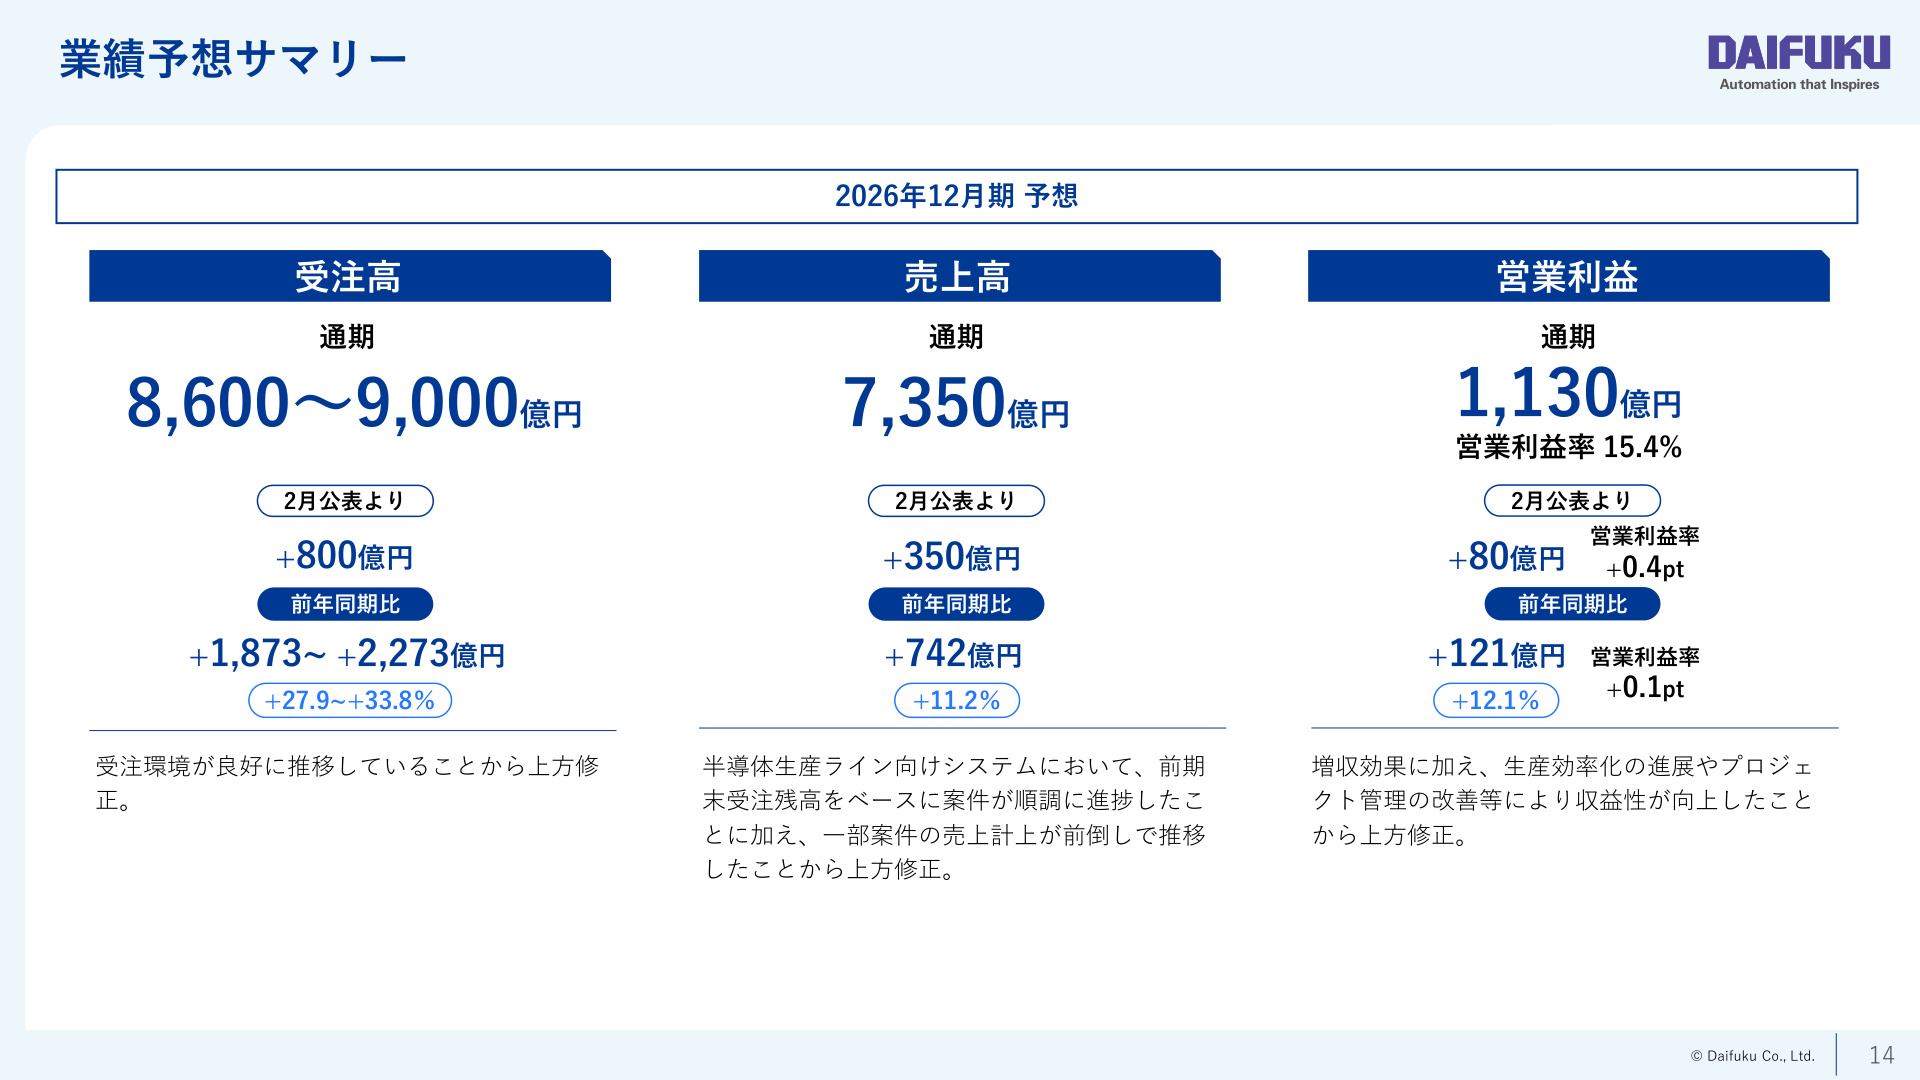
The slide above (Slide 15) shows the revision range for the full-year earnings forecast. The highlight of this slide is that "the company has significantly raised its initial full-year targets for orders, sales, and operating profit."
- Full-Year Orders Forecast : 860–900 billion yen (+80 billion yen upward revision / +27.9% to +33.8% YoY)
- Full-Year Sales Forecast : 735 billion yen (+35 billion yen upward revision / +11.2% YoY)
- Full-Year Operating Profit Forecast : 113 billion yen (+8 billion yen upward revision / +12.1% YoY)
- Full-Year Operating Profit Margin Forecast : 15.4% (+0.4pt from previous forecast)
- Net Income Attributable to Owners of Parent Forecast : 86.5 billion yen (+6.5 billion yen from previous forecast)
The upward revision is driven by the smooth progress of semiconductor production line projects and the accelerated recognition of sales for certain projects.
Expansion of Shareholder Returns (Dividend Increase)
Along with the upward revision of earnings, an increase in dividends was announced.
- Interim Dividend : 40 yen per share (an increase of 4 yen from the initial 36 yen)
- Year-End Dividend Forecast : 50 yen per share (an increase of 4 yen from the initial 46 yen)
- Annual Dividend Forecast : 90 yen per share (an increase of 12 yen from the previous year's 78 yen, and an increase of 8 yen from the initial forecast)
- Consolidated Payout Ratio : 38.5% (+1.8pt YoY)
This reflects both a high commitment to shareholder returns and confidence in long-term profit growth.
8. ESG and Business Development Topics for Mid-to-Long-Term Growth
Beyond financial performance, the company is taking proactive steps in ESG (Environmental, Social, and Governance) and the promotion of advanced technologies.
- Strengthening Sustainability Disclosure : In July 2026, the company published the integrated report "Daifuku Report 2026" and "Sustainability Report 2026," clarifying the value creation story toward the long-term vision "Driving Innovative Impact 2030."
- Maintaining External ESG Ratings : The company has earned high evaluations from global agencies, including an "AA" MSCI ESG rating, a "4.0" FTSE score, and the highest "A" rating in the CDP Climate Change assessment.
- Exhibition at Logis-Tech Tokyo 2026 : At the exhibition held in September 2026, under the theme "Robotics in Motion," the company plans to showcase live demonstrations of automation solutions for complete unmanned operations .
Summary
Daifuku's H1 FY2026 financial results were exceptionally strong, capturing robust demand in the generative AI and semiconductor sectors . The order backlog has reached a record-high of 741.1 billion yen , providing a powerful foundation for mid-to-long-term performance. Furthermore, through internal structural reforms such as improved gross margins and production efficiency, the company has successfully absorbed rising costs to maintain a high operating profit margin exceeding 15% . With the upward revision of the full-year forecast and the dividend increase to 90 yen per year , these results confirm that both the business environment and the management structure are performing at an extremely high level.
This content is not intended as investment advice or a recommendation. Any opinions expressed are solely the personal views of each article.