


Onamba Co., Ltd. FY2026 Q2 Earnings Deep Dive: Performance Dynamics Driven by Robust Industrial and Automotive Demand and Significant Dividend Hikes

StockClub
Published: Aug 06, 2026, 10:46 AM
Sentiment Analysis
Onamba Co., Ltd. FY2026 Q2 Earnings Deep Dive Report
This report provides an objective and comprehensive analysis of the performance highlights, segment trends, revenue drivers, financial structure, full-year forecasts, and growth strategies of Onamba Co., Ltd. (Securities Code: 5816) , based on the company's financial results briefing materials for the second quarter (interim period) of the fiscal year ending December 2026.
1. Executive Summary
Onamba’s consolidated performance for the interim period achieved double-digit year-on-year revenue growth , supported by robust demand for industrial equipment in Japan and Asia, growth in the automotive-related market in North America, the weak yen , and product price revisions .
Regarding profitability, while fluctuations in the Mexican peso, rising raw material costs, and shifts in product mix exerted pressure on margins, these were offset by global cost-reduction efforts and improvements in non-operating income/expenses. Consequently, both ordinary profit and net income attributable to owners of the parent recorded significant year-on-year growth .
Furthermore, the company is tracking well against its full-year forecasts. In terms of shareholder returns, the company plans an annual dividend of 70 yen (35 yen interim and 35 yen year-end), representing a substantial increase from the previous year's 41 yen, underscoring a strong commitment to capital efficiency and shareholder returns.
2. Earnings Highlights and Profit Structure
The overview of consolidated performance for the interim period and year-on-year changes are as follows:
[Slide Commentary: Consolidated Statement of Income (P2)]
This slide illustrates the consolidated P&L for the interim period compared to the initial forecasts.
- Net Sales : 24,103 million yen (+13.3% YoY, +2,821 million yen vs. forecast)
- Operating Profit : 1,102 million yen (-1.5% YoY, -16 million yen vs. forecast)
- Ordinary Profit : 1,104 million yen (+24.2% YoY, +215 million yen vs. forecast)
- Net Income Attributable to Owners of the Parent : 653 million yen (+9.9% YoY, +58 million yen vs. forecast)
Net sales significantly outperformed the initial forecast of 22,500 million yen. While operating profit remained largely flat due to the impact of the Mexican peso and rising raw material costs at the Mexican plant, improvements in non-operating income (recovering to 1 million yen from a 230 million yen loss in the same period last year) contributed to a 24.2% YoY surge in ordinary profit . Both ordinary profit and net income exceeded their initial forecasts of 900 million yen and 600 million yen, respectively, demonstrating that top-line expansion successfully bolstered overall profit levels.
3. Segment and Product Analysis
(1) Regional Segment Performance
Performance trends varied by region:
- Japan : Net Sales 12,799 million yen (+10.6% YoY), Segment Profit 750 million yen (+13.8% YoY). Demand for wire harnesses and electric wires for industrial equipment remained strong. Price revisions successfully absorbed raw material cost increases, leading to double-digit growth in operating profit.
- Americas/Europe : Net Sales 6,566 million yen (+11.8% YoY), Segment Loss 77 million yen (vs. 40 million yen profit in the same period last year). While automotive demand in North America was solid and the weak yen boosted sales, the appreciation of the Mexican peso , rising raw material costs, and increased local labor expenses pushed the segment into an operating loss.
- Asia : Net Sales 4,737 million yen (+23.6% YoY), Segment Profit 430 million yen (+1.0% YoY). Despite continued sluggish demand in China, sales grew significantly due to industrial equipment demand and the weak yen. However, intense price competition kept segment profit at the same level as the previous year.
(2) Department and Product Trends
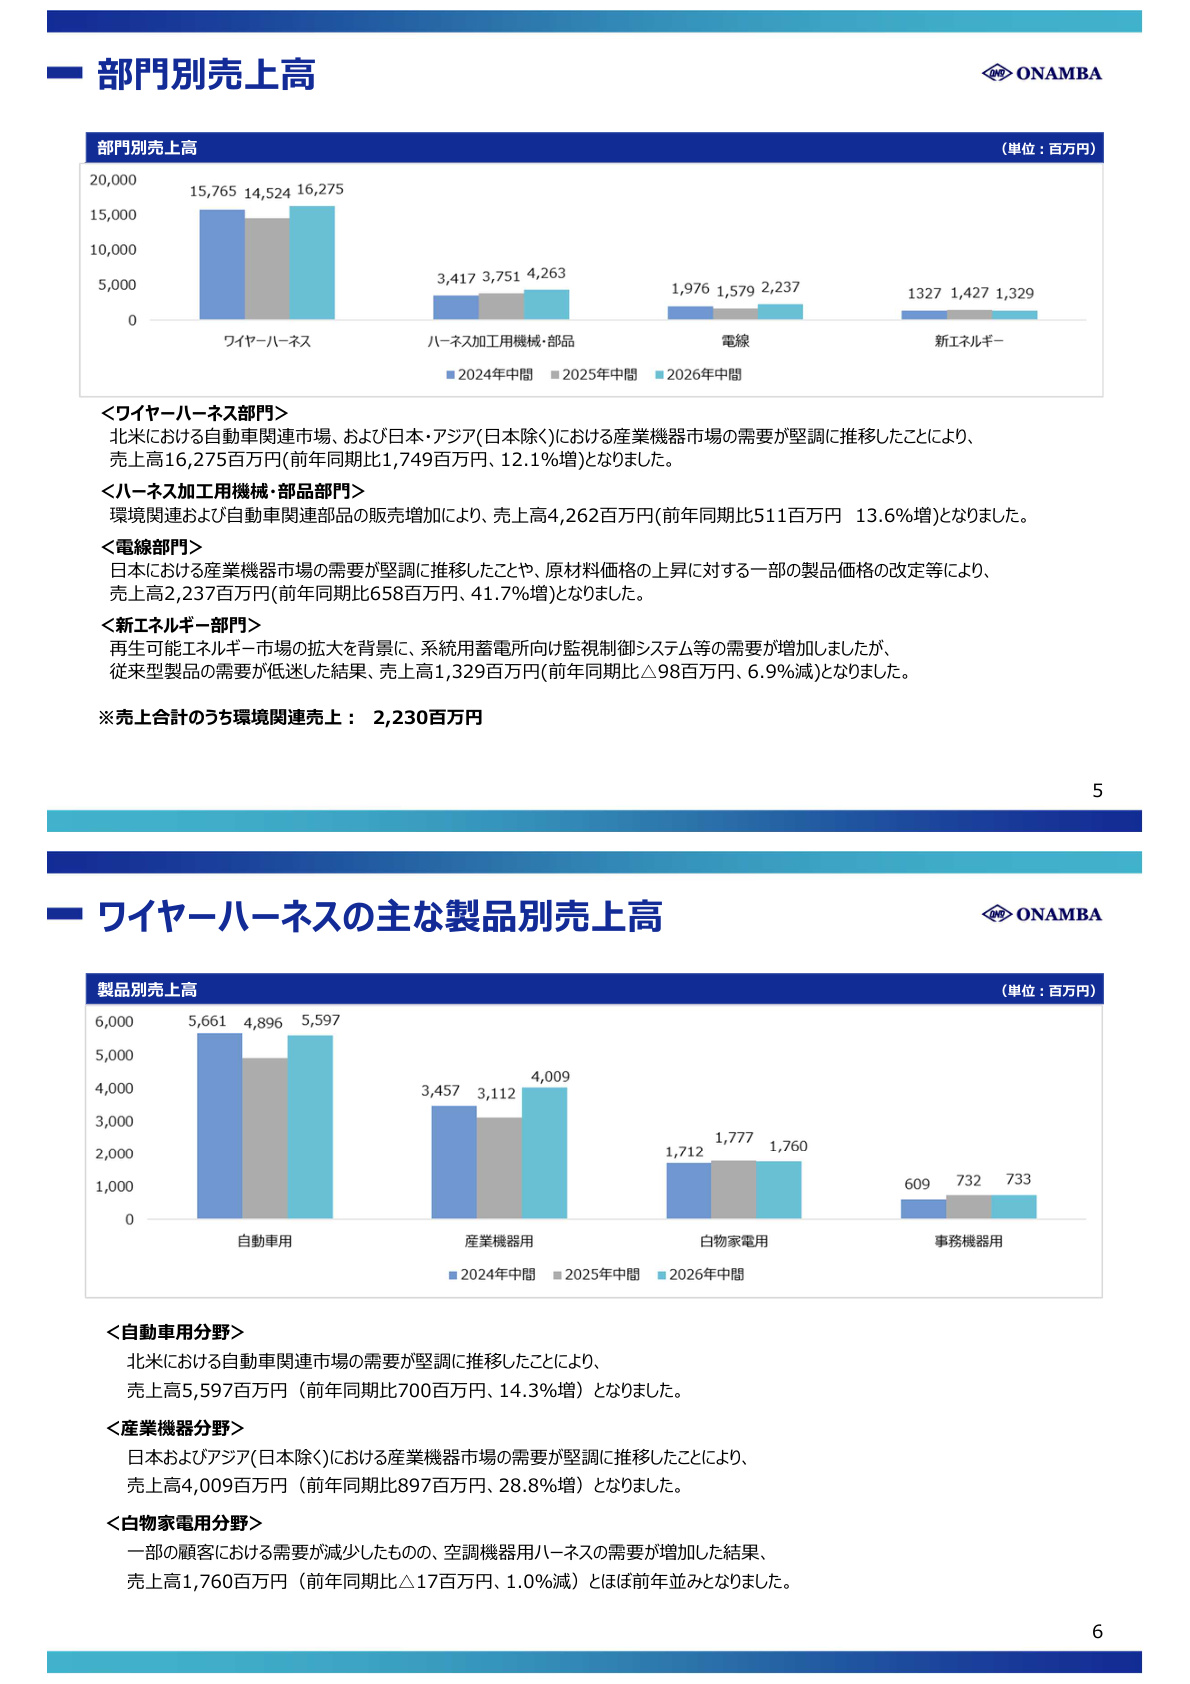
In terms of departmental sales, the Wire Harness Division remains the core driver at 16,275 million yen (+12.1% YoY), led by Industrial Equipment (4,009 million yen, +28.8% YoY) and Automotive (5,597 million yen, +14.3% YoY) . The Electric Wire Division also showed rapid growth at 2,237 million yen (+41.7% YoY). Conversely, the New Energy Division declined to 1,329 million yen (-6.9% YoY) due to the stagnation of conventional products, despite the expansion of renewable energy demand.
The waterfall chart below clearly illustrates the factors behind the revenue changes:
[Slide Commentary: Analysis of Revenue Changes (P6)]
This slide visualizes the key factors contributing to the change in net sales from the fiscal year ended June 2025 (21,282 million yen) to the fiscal year ending June 2026 (24,103 million yen).
- Key Positive Factors :
- Wire Harness (Industrial Equipment) : +897 million yen
- Wire Harness (Automotive) : +700 million yen
- Electric Wire Division : +658 million yen
- Harness Processing Machinery/Parts : +511 million yen
- Key Negative Factors :
- New Energy Division : -98 million yen
- Wire Harness (Home Appliances) : -17 million yen
This analysis shows that the company's growth engines are concentrated in the two major applications of "Industrial Equipment" and "Automotive," as well as the foundational "Electric Wire" sector. The company maintains a robust portfolio balance where the overwhelming growth of core businesses absorbs the slight declines in new energy and home appliances.
4. Financial Position and Cash Flow Structure
(1) Balance Sheet (B/S) Structure
- Total Assets : 45,256 million yen (+3,204 million yen from the end of the previous fiscal year). Cash and deposits increased significantly to 10,102 million yen (+2,874 million yen), dramatically enhancing liquidity.
- Equity : 29,672 million yen (+1,916 million yen).
- Equity Ratio : 65.6% (nearly flat from 66.0% at the end of the previous fiscal year). The company maintains high financial soundness, providing a strong foundation for future growth investments and shareholder returns.
(2) Cash Flow (C/F) Trends
- Operating Cash Flow : +3,625 million yen (vs. +296 million yen in the same period last year). Driven by the collection of trade receivables (+1,849 million yen) and an increase in trade payables, the company generated substantial cash inflow.
- Investing Cash Flow : -382 million yen (including 345 million yen for the acquisition of property, plant, and equipment).
- Financing Cash Flow : -673 million yen (including repayment of borrowings and 255 million yen in dividend payments).
With the significant expansion of operating cash flow, the company has established a self-sustaining cash-generation model that leaves ample liquidity even after funding capital expenditures (e.g., 83 million yen for domestic plants, 79 million yen for processing machinery) and debt repayments.
5. Future Growth Strategy and Mid-Term Topics
During the interim period, the company has steadily advanced the following key strategies:
- Concentrated Resource Allocation to Growth Areas :
- Expanding supply of wire harnesses and electric wires for industrial equipment to capture demand from AI expansion and semiconductor equipment .
- Continued delivery of monitoring and control systems for grid-scale energy storage (CN-Solution system) to meet renewable energy growth.
- Proactive proposals for data center products (expected to expand from the next fiscal year).
- Evolution of Production Systems and Sustainability :
- Strengthening domestic production bases and expanding the introduction of automated machinery and AI image recognition inspection equipment .
- Commencing the use of CO2-free electricity at the Mie Plant as part of GHG reduction initiatives.
- Reform of Management Foundation and Capital Cost :
- Promoting IT infrastructure development, business process re-engineering, and HR system reforms.
- Commencing discussions for the next mid-term management plan, "PROGRESS2030" (scheduled for announcement in February 2027).
6. Full-Year Forecasts and Shareholder Returns
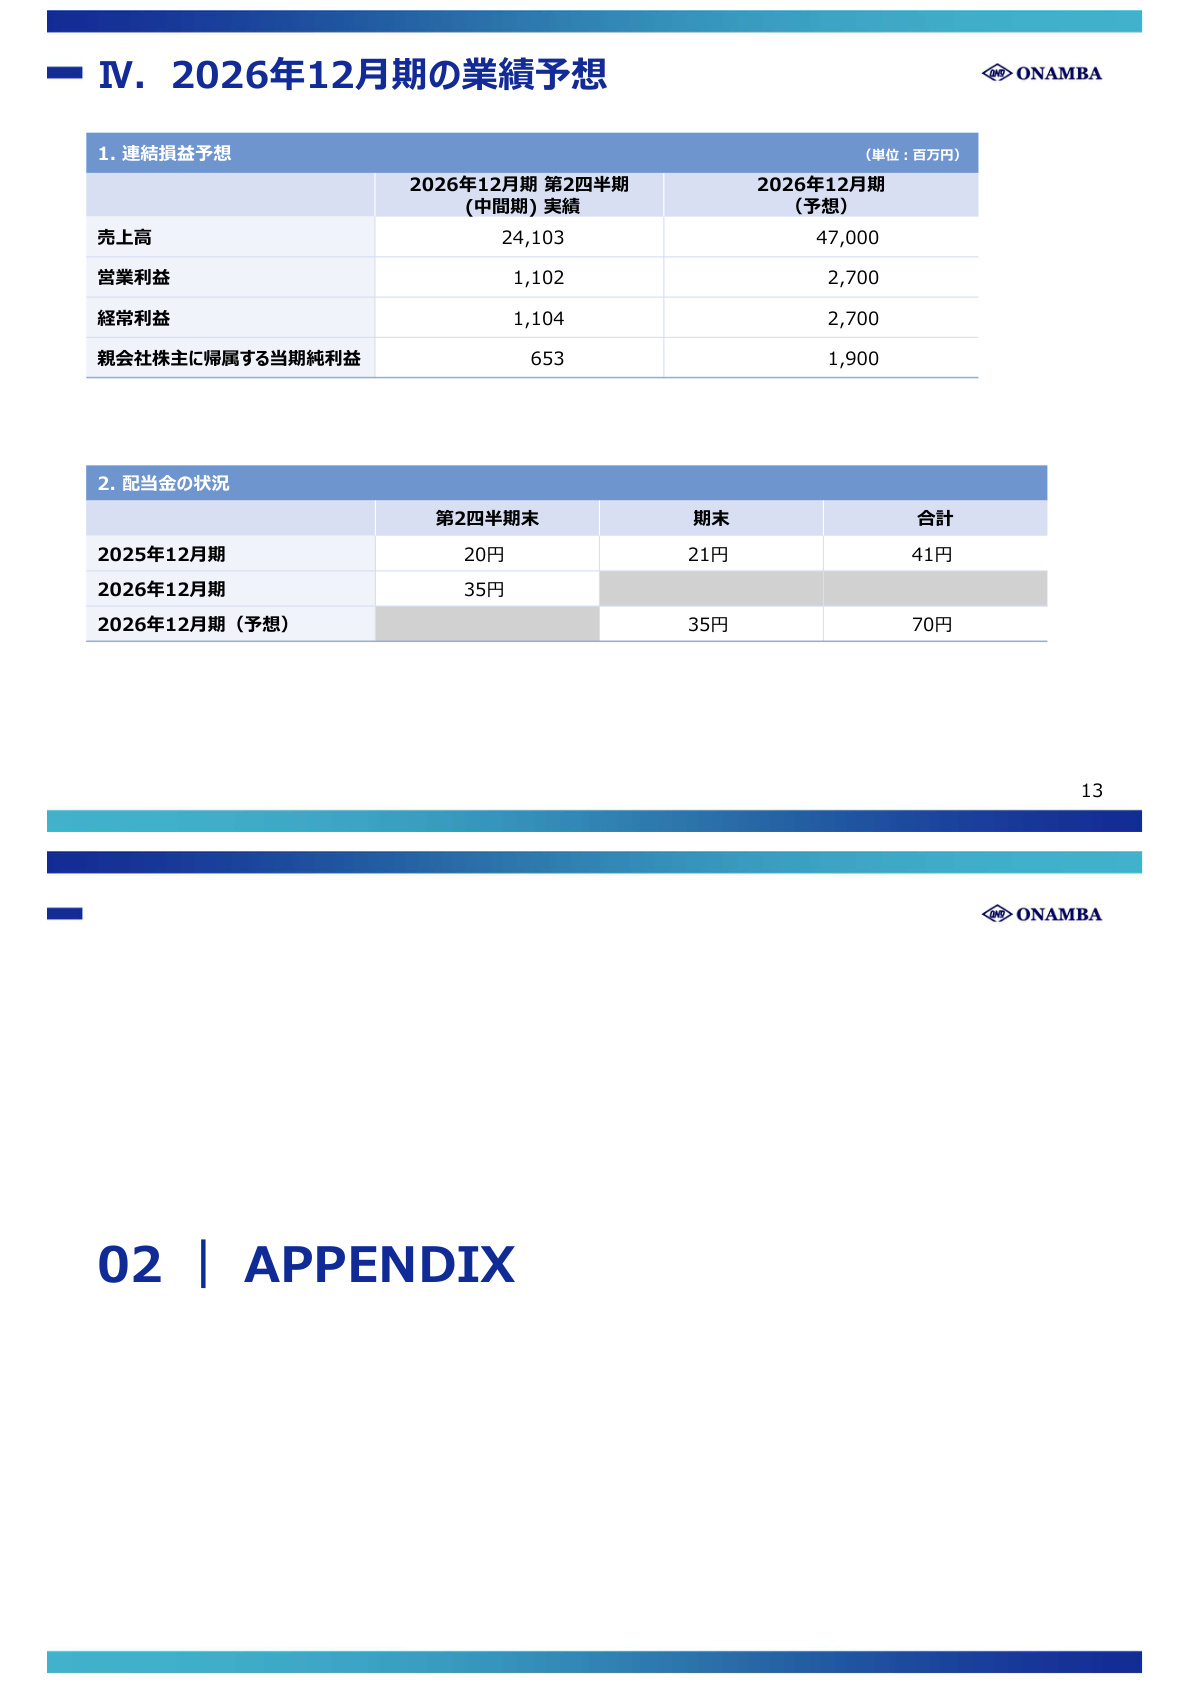
The full-year consolidated earnings forecast and dividend policy for the fiscal year ending December 2026 are as follows:
{{PAGE_12}}
[Slide Commentary: FY2026 Earnings Forecast and Dividends (P12)]
This slide presents critical data on the full-year outlook and dividend policy .
-
Full-Year Forecast (Consolidated) :
- Net Sales : 47,000 million yen (Interim progress: 51.3%)
- Operating Profit : 2,700 million yen (Interim progress: 40.8%)
- Ordinary Profit : 2,700 million yen (Interim progress: 40.9%)
- Net Income : 1,900 million yen (Interim progress: 34.4%)
-
Dividend Status :
- FY2025 Actual : 20 yen (interim) + 21 yen (year-end) = 41 yen annual
- FY2026 Forecast : 35 yen (interim) + 35 yen (year-end) = 70 yen annual ( +29 yen significant increase YoY )
Net sales are progressing well, exceeding 50% of the full-year plan. While profit progress reflects seasonality and anticipated cost burdens in the second half, the most notable point is the significant dividend hike to 70 yen annually , based on the basic policy of a payout ratio of 30% or higher . With the 35 yen interim dividend already decided, the company clearly demonstrates a strong commitment to shareholder returns and confidence in achieving its second-half targets.
7. Conclusion
Onamba’s Q2 FY2026 results show a solid increase in profit, achieved by capturing demand in industrial and automotive markets , strengthening domestic profitability , and improving non-operating income , despite cost pressures at certain overseas locations.
Leveraging its high financial stability (65.6% equity ratio) and strong operating cash flow (3.62 billion yen), the company is executing investments aligned with growth trends such as AI, semiconductors, and decarbonization. Including the substantial dividend increase, the company has presented a clear roadmap for balancing business growth with the enhancement of shareholder value .
This content is not intended as investment advice or a recommendation. Any opinions expressed are solely the personal views of each article.