


Towa Pharmaceutical (4553) Q1 FY2027 Earnings Report: A Growth Roadmap Driven by Restructured Supply Stability and Overseas Profitability

StockClub
Published: Aug 06, 2026, 10:32 AM
Sentiment Analysis

Executive Summary (Earnings Overview and Key Highlights)
Towa Pharmaceutical Co., Ltd. reported a strong start to the fiscal year ending March 31, 2027, with Q1 results showing year-on-year growth in both revenue and profit at all levels, tracking well against full-year projections. Performance was primarily driven by expanded generic drug supply capacity and improved sales mix in the domestic market, alongside robust growth in the overseas segment (Towa INT) in Europe.
This report provides a comprehensive analysis based on the disclosed earnings supplementary materials, covering performance highlights, factors behind operating profit fluctuations, segment analysis, structural reforms for production capacity expansion, and shareholder return policies.
1. Q1 FY2027 Consolidated Financial Overview
For the first quarter, consolidated net sales reached ¥71.38 billion (+9.6% YoY) , operating profit was ¥6.519 billion (+25.2% YoY) , ordinary profit stood at ¥7.941 billion (+100.9% YoY) , and net income attributable to owners of the parent was ¥5.531 billion (+120.1% YoY) .
The slide below summarizes the key performance indicators, showing Q1 results against the first-half plan.
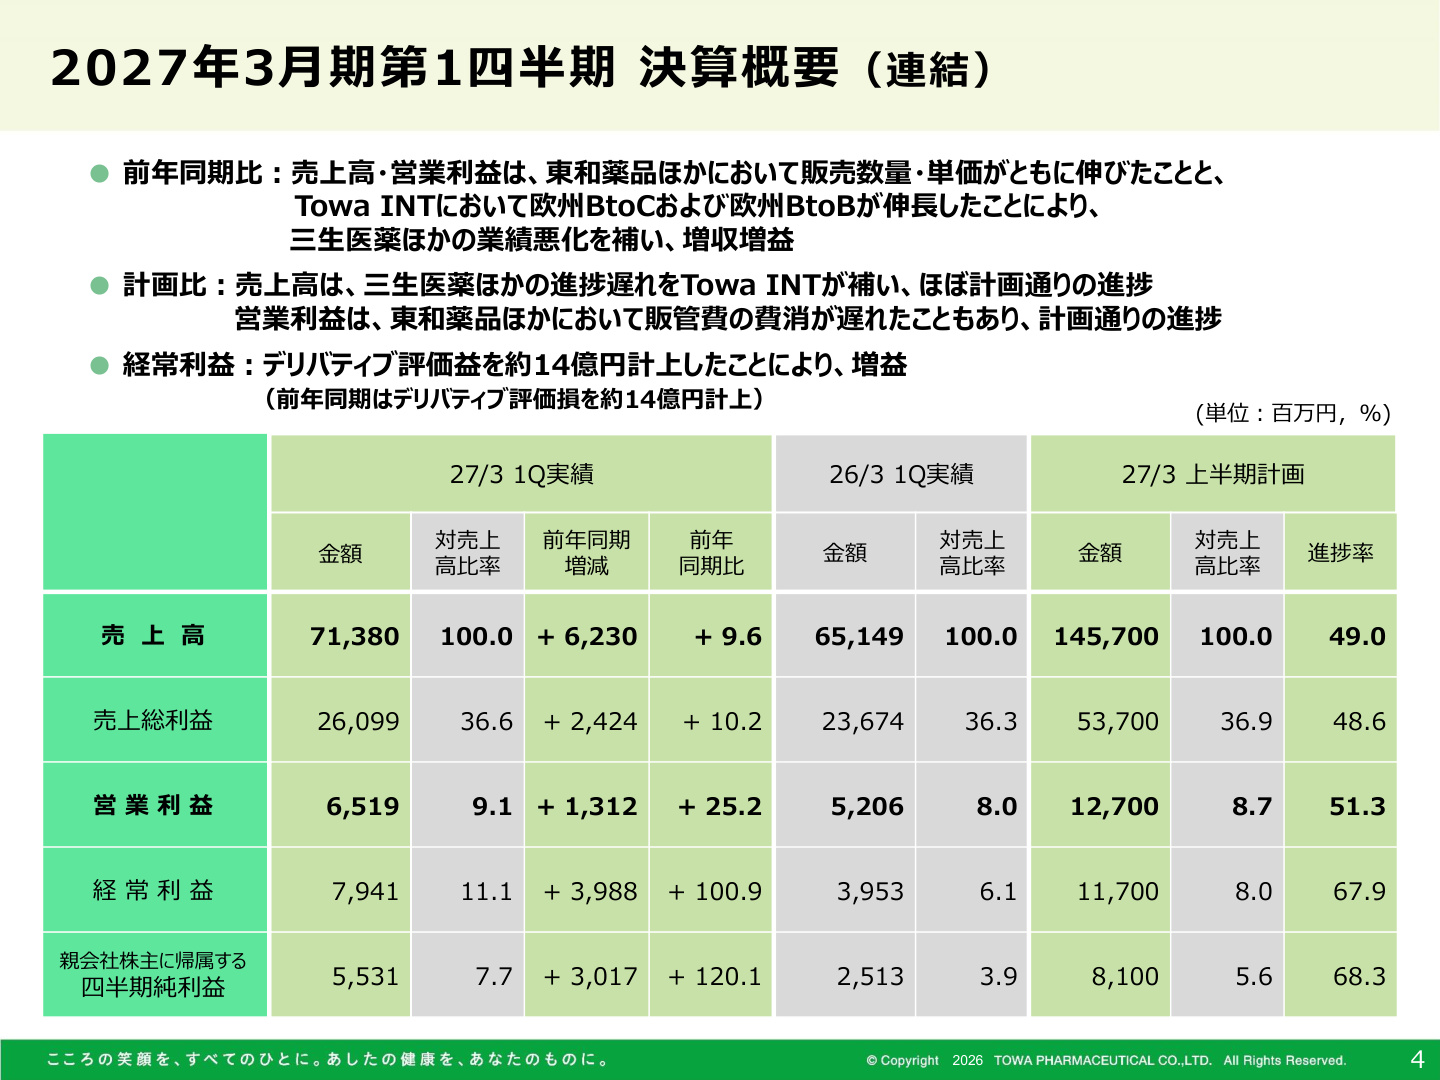
[Slide Commentary: Significance of Consolidated Earnings Summary]
The slide above (PAGE 4) provides essential data confirming the strong start to the fiscal year. The progress rate against the first-half revenue plan is 49.0% , while the operating profit progress rate has reached 51.3% , already exceeding half of the first-half target in the first quarter. Notably, the operating profit margin improved by 1.1 percentage points to 9.1% , up from 8.0% in the same period last year. Ordinary profit doubled, bolstered by a derivative valuation gain of approximately ¥1.4 billion (compared to a valuation loss of approximately ¥1.4 billion in the same period last year).
2. Analysis of Operating Profit Fluctuations
The ¥1.31 billion (+25.2%) increase in operating profit from the previous year's Q1 (¥5.20 billion) to the current Q1 (¥6.51 billion) was driven by several key factors:
- Growth in "Towa Pharmaceutical and others" (Domestic Core) (+¥0.68 billion) : Increased production volume and an improved sales mix contributed to a ¥1.52 billion increase in gross profit, which successfully absorbed higher R&D expenses (-¥0.29 billion) and other SG&A expenses (-¥0.54 billion).
- Profitability Improvement in "Towa INT" (Overseas) (+¥0.56 billion) : Despite ongoing restrictions in the U.S. due to nitrosamine issues, growth in core B2C products and increased B2B contract manufacturing in Europe lowered the cost-to-sales ratio, contributing to a return to profitability.
- Adjustments for Goodwill Amortization, etc. (+¥0.60 billion) : A reduction in goodwill amortization at Sansei Pharmaceutical ( +¥0.62 billion ) boosted profits.
- Profit Decline in "Sansei Pharmaceutical and others" (-¥0.54 billion) : Revenue declines due to delayed orders and reduced demand led to a segment loss.
3. In-depth Segment Analysis
① Domestic Segment: Towa Pharmaceutical and others (Generic Drug Business)
- Net Sales : ¥49.746 billion (+8.7% YoY)
- Segment Profit : ¥7.419 billion (+10.2% YoY)
- Production/Sales Volume : Sales volume of tablets and capsules for Towa Pharmaceutical standalone increased to 4.02 billion units (+4.4% YoY) , with production volume reaching 4.09 billion units (+6.2% YoY) .
- Status : Although the expansion of supplementary products was slightly slower than anticipated, improved supply capacity for existing products and an optimized product mix drove higher unit prices, resulting in increased revenue and profit. The deferral of R&D expenditures also contributed to the profit increase.
② Domestic Segment: Sansei Pharmaceutical and others (Healthcare/Contract Business)
- Net Sales : ¥6.234 billion (-11.3% YoY)
- Segment Loss : **-¥0.46 billion (compared to a profit of ¥0.139 billion in the same period last year)
- Status : Impacted by delayed orders in the new application business and lost opportunities due to decreased demand in the pharmaceutical business. While segment profit may fall short of the plan, the impact on consolidated performance is expected to be limited.
③ Overseas Segment: Towa INT (Europe/U.S. Business)
- Net Sales : ¥15.612 billion (+25.0% YoY)
- Segment Profit : **¥5 million (compared to a loss of -¥0.562 billion in the same period last year)
- Status : The European market grew significantly to ¥10.548 billion (+38.1% YoY) , driving the entire overseas segment to profitability . The U.S. market remained steady with sales of ¥5.063 billion (+4.3% YoY).
4. Supply Stabilization and Long-term Production Capacity Strategy
"Stable supply of pharmaceuticals" is the top priority for the Japanese pharmaceutical industry. Towa Pharmaceutical is aggressively pursuing the lifting of shipment restrictions and the strengthening of its long-term production system.
Trends in Limited Shipment Items
As a result of increasing the utilization rate of in-house factories to resolve domestic supply concerns, the number of items under limited shipment has decreased sharply.
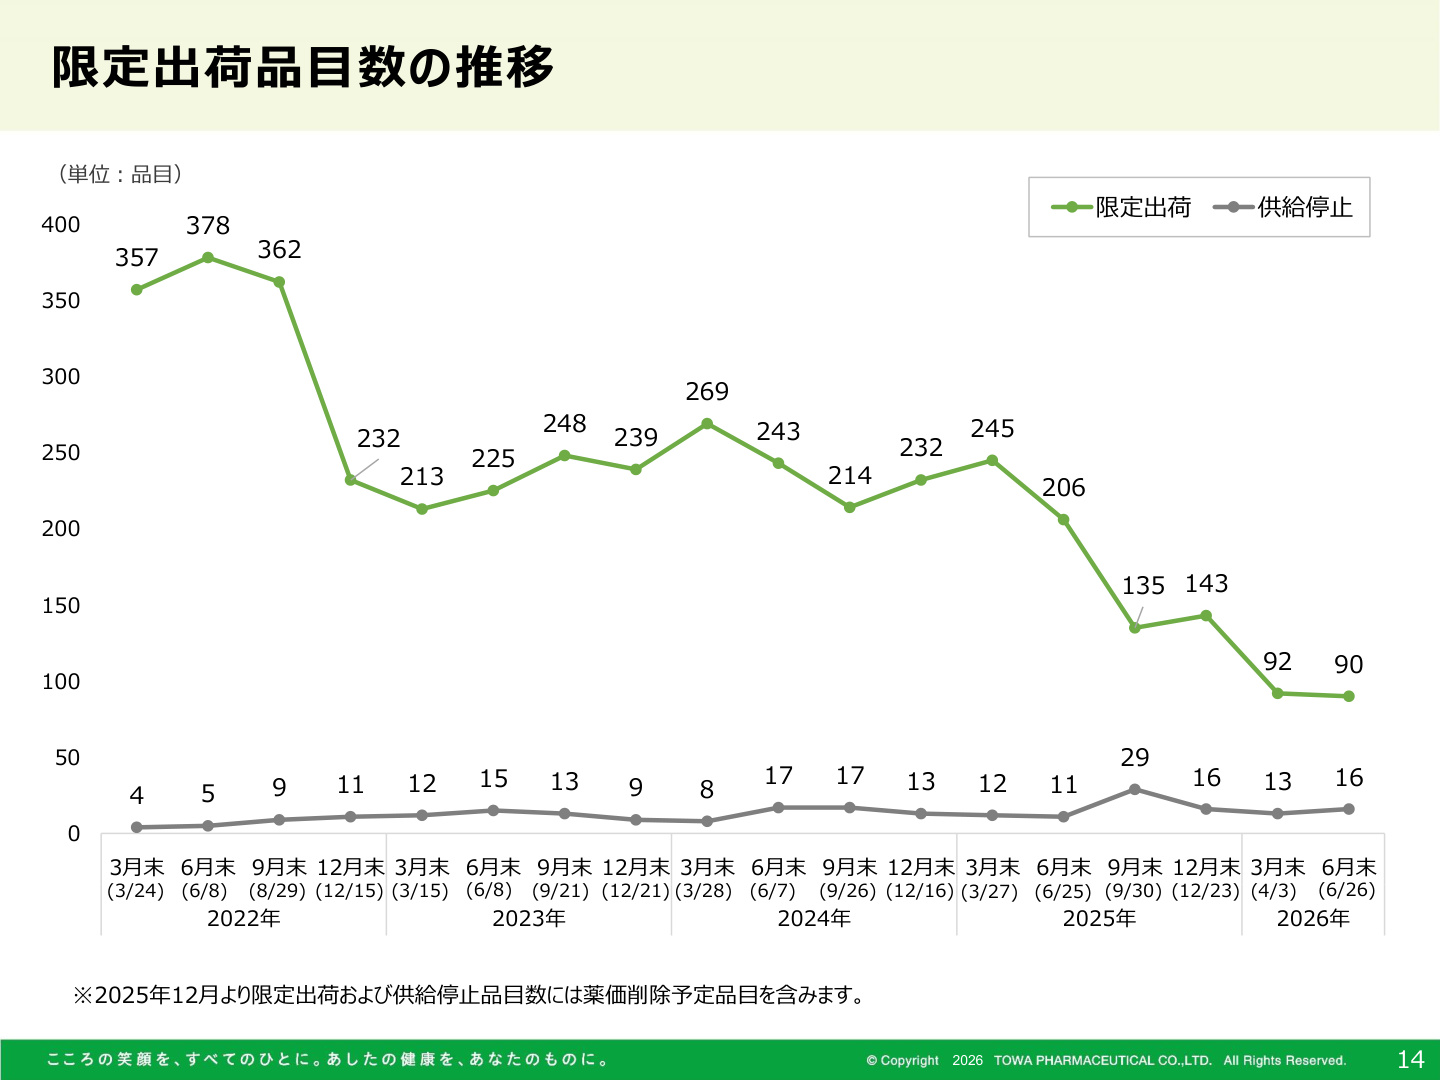
[Slide Commentary: The Significance of the Sharp Decline in Limited Shipment Items]
The slide above (PAGE 14) is critical data showing that the company's supply system is normalizing. The number of limited shipment items, which reached 378 at the end of June 2022, has been significantly reduced to 90 as of the end of June 2026 through production line efficiency and capacity expansion measures. Resolving shipment suspensions and restrictions directly builds trust with medical professionals and serves as a solid foundation for future market share expansion.
M&A and Long-term Production Capacity Targets (2030/2036 Roadmap)
The company has announced large-scale production capacity expansion measures to prepare for future demand growth.
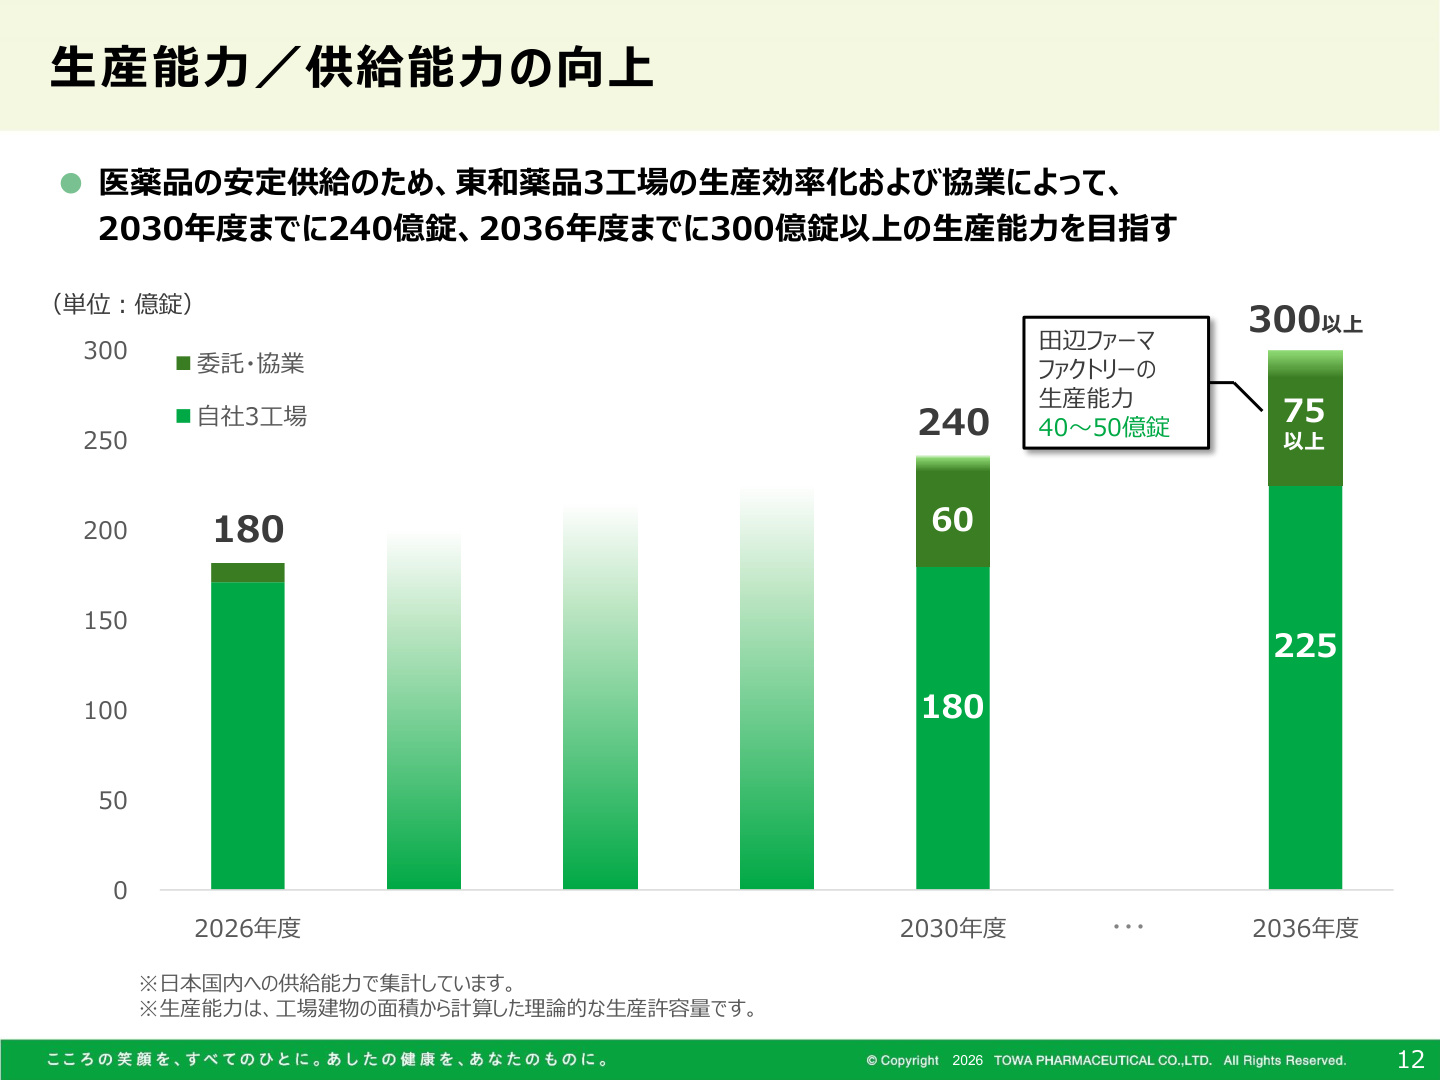
[Slide Commentary: Tanabe Pharma Factory Acquisition and Production Capacity Targets]
The slide above (PAGE 12) illustrates the core of the long-term growth story. Towa Pharmaceutical has agreed to acquire Tanabe Pharma Factory Co., Ltd. (inheriting manufacturing and marketing approvals for 17 ingredients and 35 items) , scheduled for late November 2026. By incorporating the Yoshitomi and Onoda plants (with an annual production track record of 1.56 billion units), the company aims for the following capacity improvements:
- FY2026 Actual : Approx. 18 billion units
- FY2030 Target : 24 billion units (including 4–5 billion units from Tanabe Pharma Factory)
- FY2036 Target : 30 billion units or more (22.5 billion units from in-house plants + 7.5 billion units or more from outsourcing/collaboration)
In addition to expanding in-house factories (such as the Yamagata and Okayama plants), the company plans to build an overwhelming, top-tier domestic supply system by leveraging strategic M&A.
5. Investment Plan, Financial Base, and Shareholder Returns
R&D and Capital Expenditure
- R&D Expenses : Invested ¥4.5 billion in Q1, with a full-year plan of ¥212 billion (7.0% of net sales) . The company continues to invest in supplementary product development and overseas R&D.
- CapEx and Depreciation : Q1 capital expenditure was ¥3.0 billion , and depreciation was ¥4.5 billion . The full-year CapEx plan is ¥25.5 billion , allocated to production capacity expansion, including automation and DX at the Yamagata and Okayama plants.
Financial Position and Cash Flow
- Assets/Liabilities : Total assets are ¥480.709 billion (+¥5.418 billion from the end of the previous fiscal year) . The equity ratio improved to 38.0% from 37.5% at the end of the previous fiscal year.
- Cash Flow : Operating CF was an inflow of ¥0.729 billion , while investing CF was an outflow of -¥3.302 billion due to the acquisition of tangible fixed assets. Cash and cash equivalents at the end of the quarter stood at ¥41.724 billion .
Shareholder Returns (Dividend Increase Plan)
The company maintains a policy of stable dividends while demonstrating an active stance on shareholder returns.
- FY2027 Annual Dividend Forecast : ¥85 per share ( ¥5 increase YoY)
- Interim: ¥40 / Year-end: ¥45
- Return Indicators : Forecasted dividend payout ratio of 19.5% , DOE (Dividend on Equity) of 2.2% .
Conclusion: Key Points to Watch
Towa Pharmaceutical's Q1 FY2027 results mark a strong start, driven by unit price improvements in the domestic generic market and the return to profitability of the overseas business.
Key monitoring points moving forward include: (1) The completion of the Tanabe Pharma Factory acquisition (scheduled for November 2026) and its subsequent impact on consolidated results , (2) the degree of completion of the stable supply system aimed at zero limited shipments , and (3) the stabilization of profitability in the overseas business (Towa INT), particularly in Europe and the U.S. The earnings report demonstrates that the strengthening of the stable supply system is steadily bearing fruit as a foundation for future growth.
This content is not intended as investment advice or a recommendation. Any opinions expressed are solely the personal views of each article.