

![[In-Depth Analysis] Uniform Next Q2 FY2026 Results: Accelerating Corporate Shift and Hybrid Sales Drive Significant Revenue and Profit Growth](https://news-images.stock-club.net/market_news/images/3566/140120260806511820/slide_eyecatch_en_3171e32d.webp)
[In-Depth Analysis] Uniform Next Q2 FY2026 Results: Accelerating Corporate Shift and Hybrid Sales Drive Significant Revenue and Profit Growth

StockClub
Published: Aug 06, 2026, 10:18 AM
Sentiment Analysis

Uniform Next Co., Ltd. delivered a robust performance for the first half of the fiscal year ending December 2026 , with both revenue and profit metrics significantly exceeding the same period last year. The company's solid operational foundation as an e-commerce retailer, combined with an aggressive strategy to capture corporate demand, has successfully maintained growth momentum while simultaneously improving profitability.
This report provides a detailed analysis based on the company's financial disclosures, covering performance highlights, profit structure, key KPIs regarding the customer base, and future growth strategies and full-year outlook.
1. Q2 FY2026 Financial Highlights and Segment Trends
For the first half (six months), consolidated results were as follows: Revenue of 5,894 million yen (up 25.9% YoY) , Operating Profit of 419 million yen (up 50.0% YoY) , Ordinary Profit of 424 million yen (up 50.2% YoY) , and Net Profit of 270 million yen (up 29.8% YoY) .
Both revenue and profit achieved significant growth of approximately 50% compared to the same period last year, indicating a very strong trajectory. Progress against the full-year targets (Revenue: 12,000 million yen, Operating Profit: 900 million yen) stands at 49.1% for revenue and 46.5% for operating profit . Given the company's seasonal business structure—where Q1 (January–March) is a low-demand period and revenue is concentrated in Q2 and Q3 as demand for heat-stroke prevention products begins—this pace is exceptionally strong.
Segment Revenue Breakdown and Topics
- Office Work Segment: Revenue of 3,357 million yen (up 35.0% YoY) The core workwear division drove significant revenue growth. Specifically, for spring/summer seasonal items such as fan-equipped workwear, the strategy of increasing inventory early in collaboration with manufacturers proved successful. By avoiding the industry-wide issue of "lost opportunities due to inventory shortages during early heat-stroke prevention demand," the company successfully captured latent corporate demand.
- Wholesale Segment: Revenue of 938 million yen (up 49.0% YoY) Following strengthened recruitment and training, the upward trend in revenue continues. The company is maturing a sales style that integrates the traffic-generating power of its e-commerce sites with the consultative capabilities of its online sales team.
- Service Segment: Revenue of 1,598 million yen (up 2.2% YoY) Uniform sales for restaurants and medical clinics remained steady, maintaining a solid demand base.
2. Operating Profit Analysis: Balancing Growth Investment and Profitability
The increase in operating profit (+140 million yen, +50.0% YoY) is driven by a structure where the marginal profit generated by revenue growth more than absorbs aggressive upfront investments.
The following slide illustrates the factors contributing to the change in operating profit from Q2 FY2025 to Q2 FY2026.
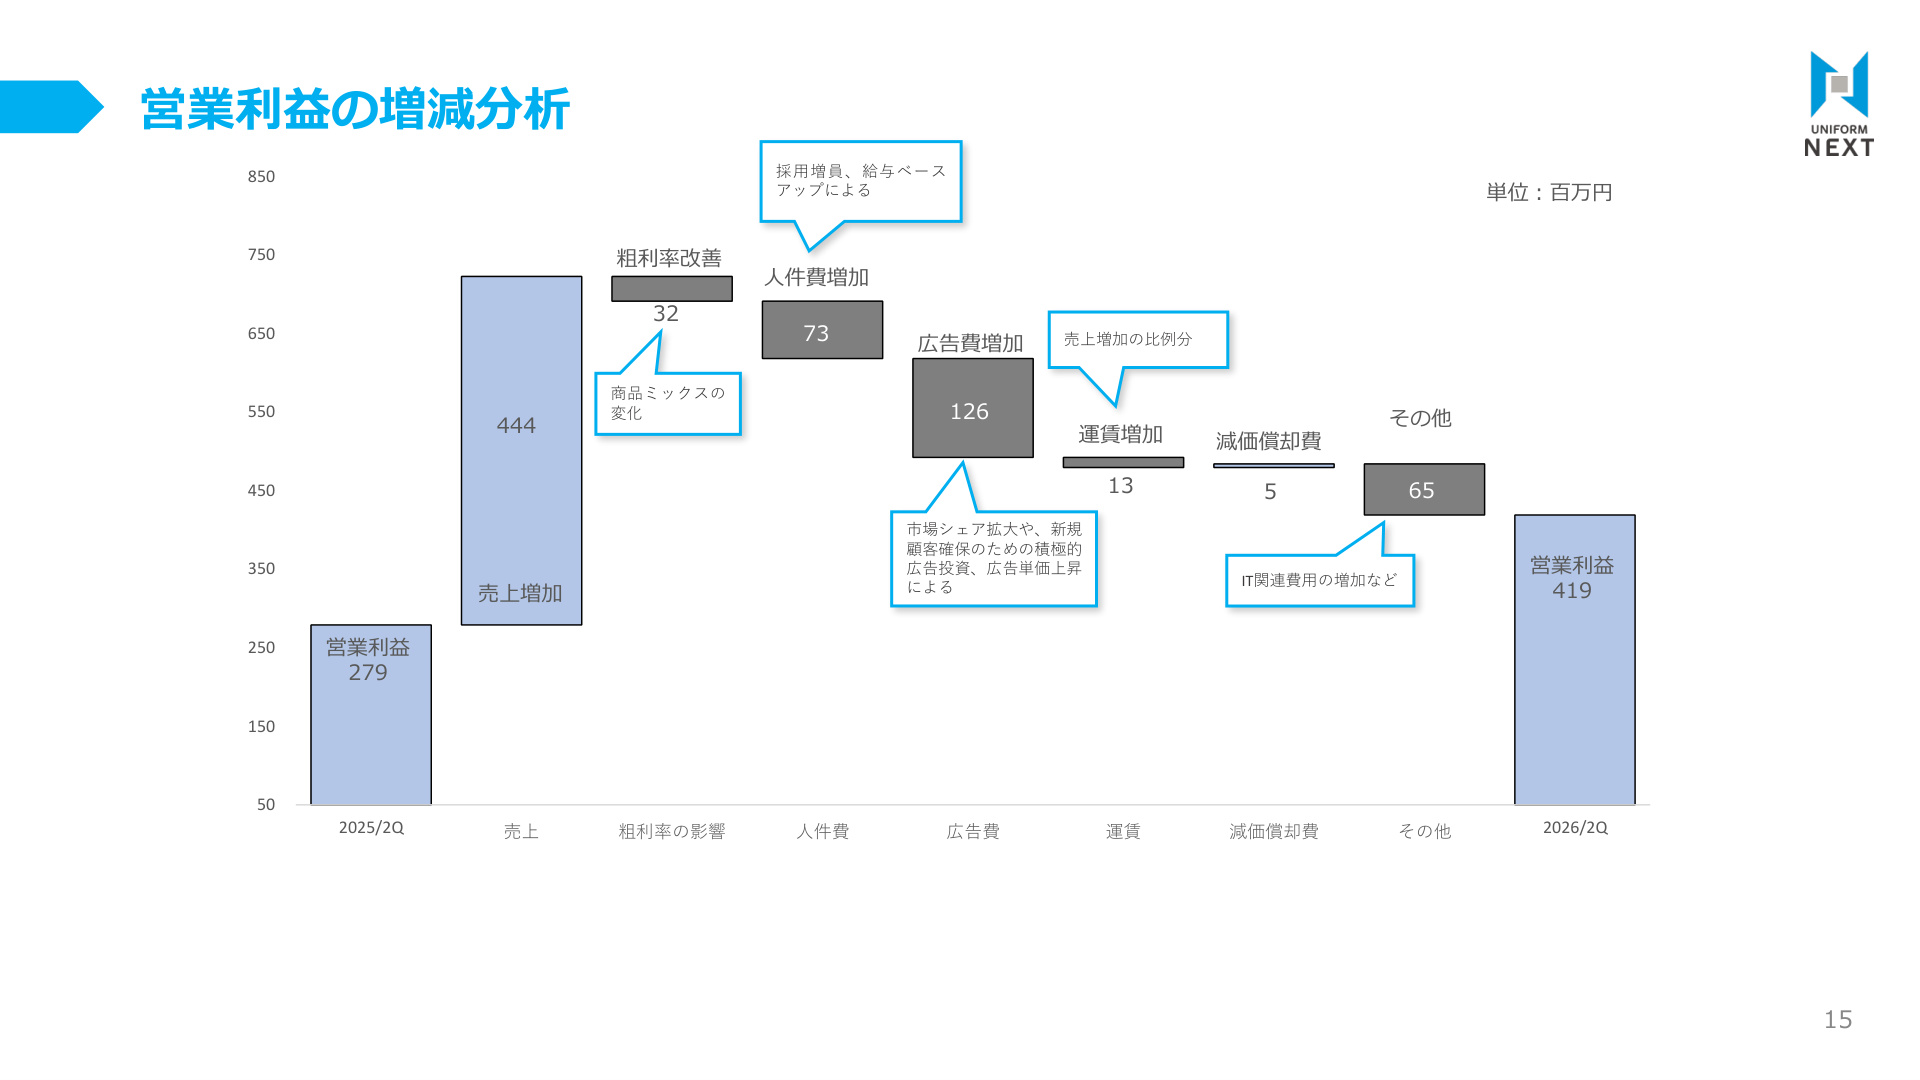
In-Depth Analysis of Profit Drivers
This slide is crucial for visually understanding how revenue growth is converted into profit and what types of investments are being made.
- Positive Factors (Profit Drivers):
- Contribution from Revenue Growth (+444 million yen): The 1,213 million yen increase in revenue led to a significant boost in profit.
- Gross Margin Improvement/Product Mix Changes (+32 million yen): An increased sales ratio of high-value-added products (in-house designs, processed items, etc.) contributed positively to gross margins.
- Negative Factors (Growth Investment/Increased Selling Expenses):
- Increased Advertising Expenses (-126 million yen): Aggressive investment in web advertising was implemented to expand market share and acquire new customers (particularly corporate clients).
- Increased Personnel Expenses (-73 million yen): Higher costs due to increased hiring and base salary raises associated with business expansion.
- Logistics and Other Expenses (-83 million yen): Includes increased shipping costs due to higher volume (-13 million yen), higher IT-related expenses (-65 million yen), and depreciation (-5 million yen).
Looking at the overall SG&A ratio , it decreased by 1.7 percentage points to 28.9% from 30.6% in the same period last year, suggesting that despite aggressive advertising, operational efficiency and economies of scale are taking effect.
3. KPIs Indicating Customer Base Expansion: Active Users (AU)
The source of the company's sustainable growth lies in the steady accumulation of a repeat-purchasing customer base (fan base). The company defines Active Users (AU) as customers who have placed at least one order in the last two years and manages this as one of its most critical KPIs.
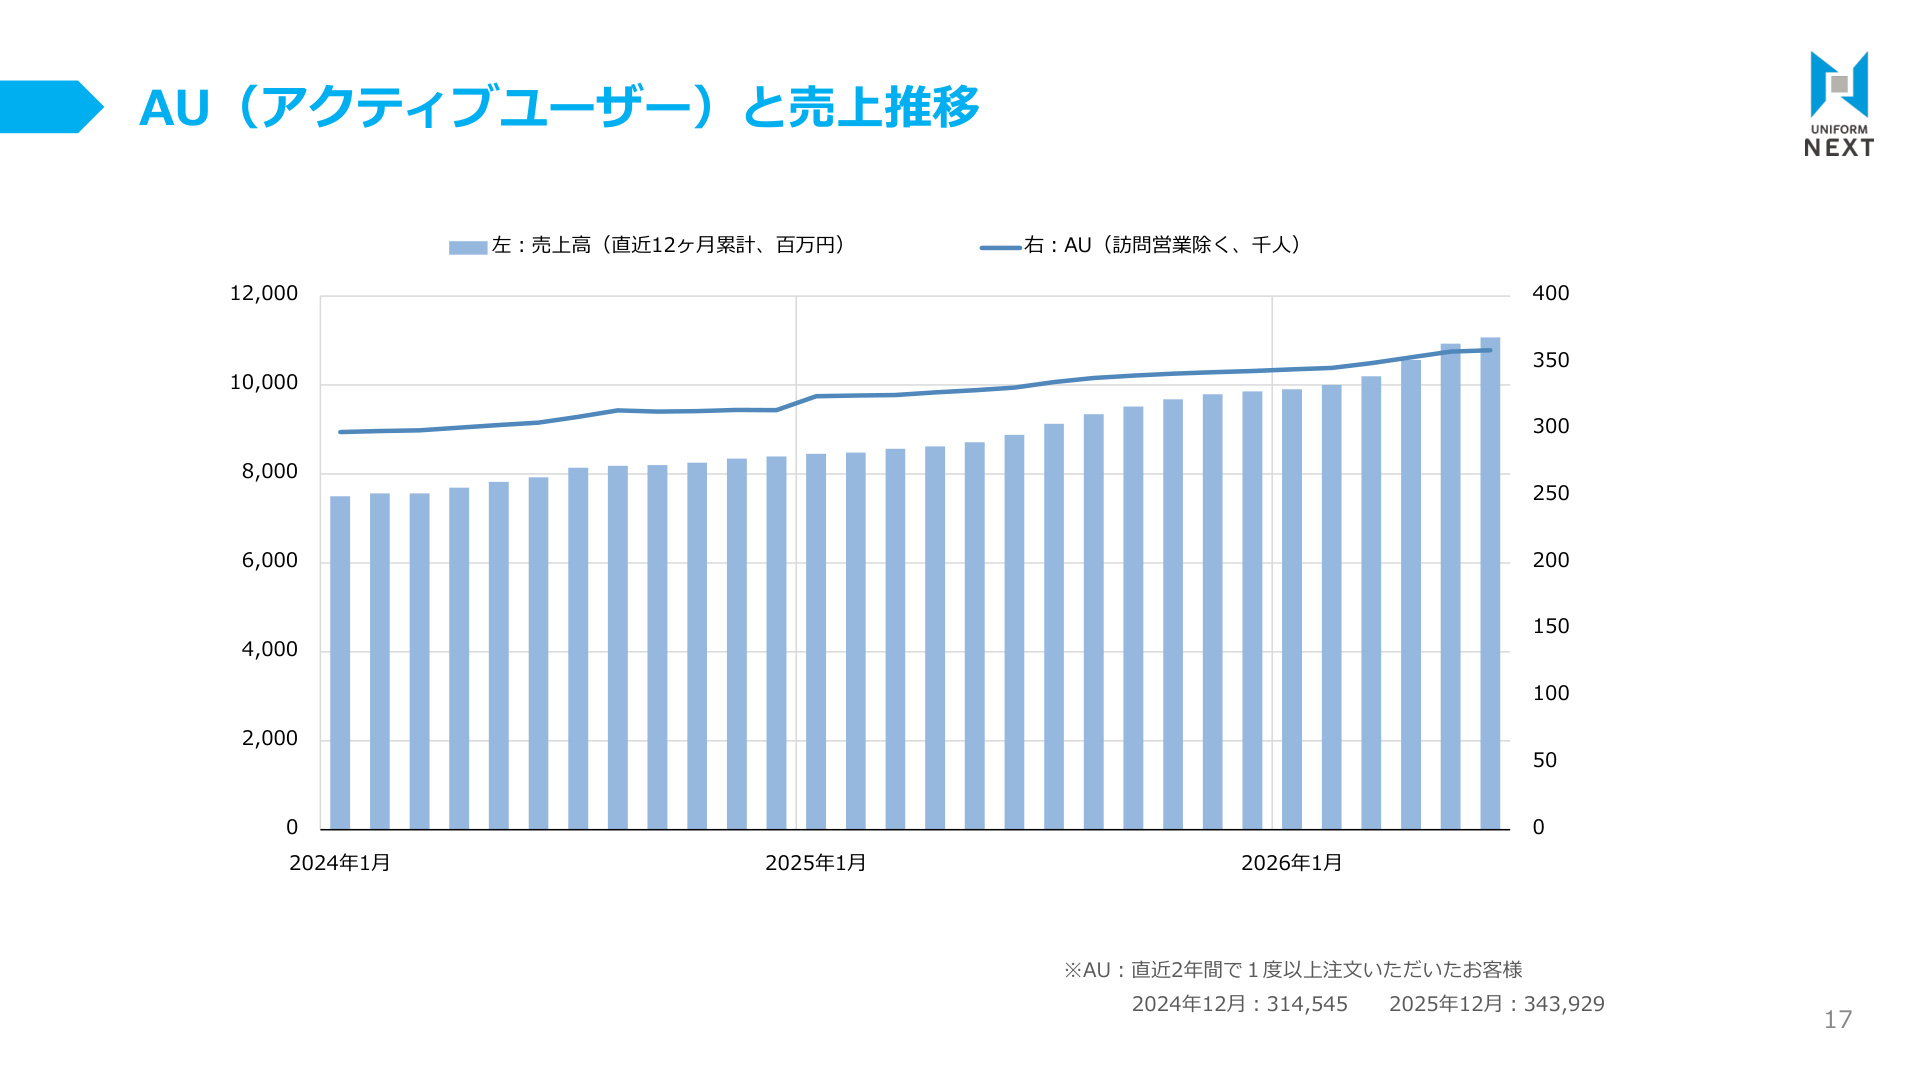
Analysis of AU and Revenue Data
The graph above shows the trailing 12-month revenue (left axis, bar chart) and the trend of AU excluding field sales (right axis, line chart).
- Sustainable Growth in Customer Numbers: AU increased from 314,545 in FY2024 to 343,929 in FY2025, and the upward trend has continued into FY2026.
- Improvement in LTV (Lifetime Value): As clearly shown by the graph, revenue is increasing at a steeper slope than the gradual increase in AU. This means that not only is the customer base growing, but the purchase value per customer and the frequency of corporate repeat purchases are also rising.
- Results of Marketing Investment: It is proven that advertising expenses invested in Q1 and Q2 have steadily led to the acquisition of new customers, which are being stocked as long-term active user assets.
4. Financial Position and Cash Flow
Total assets at the end of Q2 stood at 6,042 million yen , an increase of 686 million yen from the end of the previous fiscal year (5,356 million yen).
- Assets: While cash and deposits were 1,846 million yen (-386 million yen from the previous year-end), inventories increased to 1,964 million yen (+748 million yen) due to the early securing of summer seasonal stock.
- Liabilities and Net Assets: Although current liabilities increased to 1,799 million yen (+507 million yen), net assets reached 4,084 million yen (+228 million yen) due to the accumulation of net profit. The equity ratio remains high at approximately 67.6%, maintaining strong financial safety and soundness.
- Cash Flow: Operating cash flow was negative at -208 million yen due to inventory accumulation, but this is a temporary effect of strategic stocking, which is expected to be recovered through sales in the second half.
5. Full-Year Forecast and Growth Strategy: "Corporate Shift" and "Hybrid Sales"
The company has set full-year targets for FY2026 of 12,000 million yen in revenue (up 21.7% YoY) and 900 million yen in operating profit (up 19.3% YoY) . The fundamental strategies to achieve these ambitious goals are the "Acceleration of the Corporate Shift" and the "Establishment of Hybrid Sales."
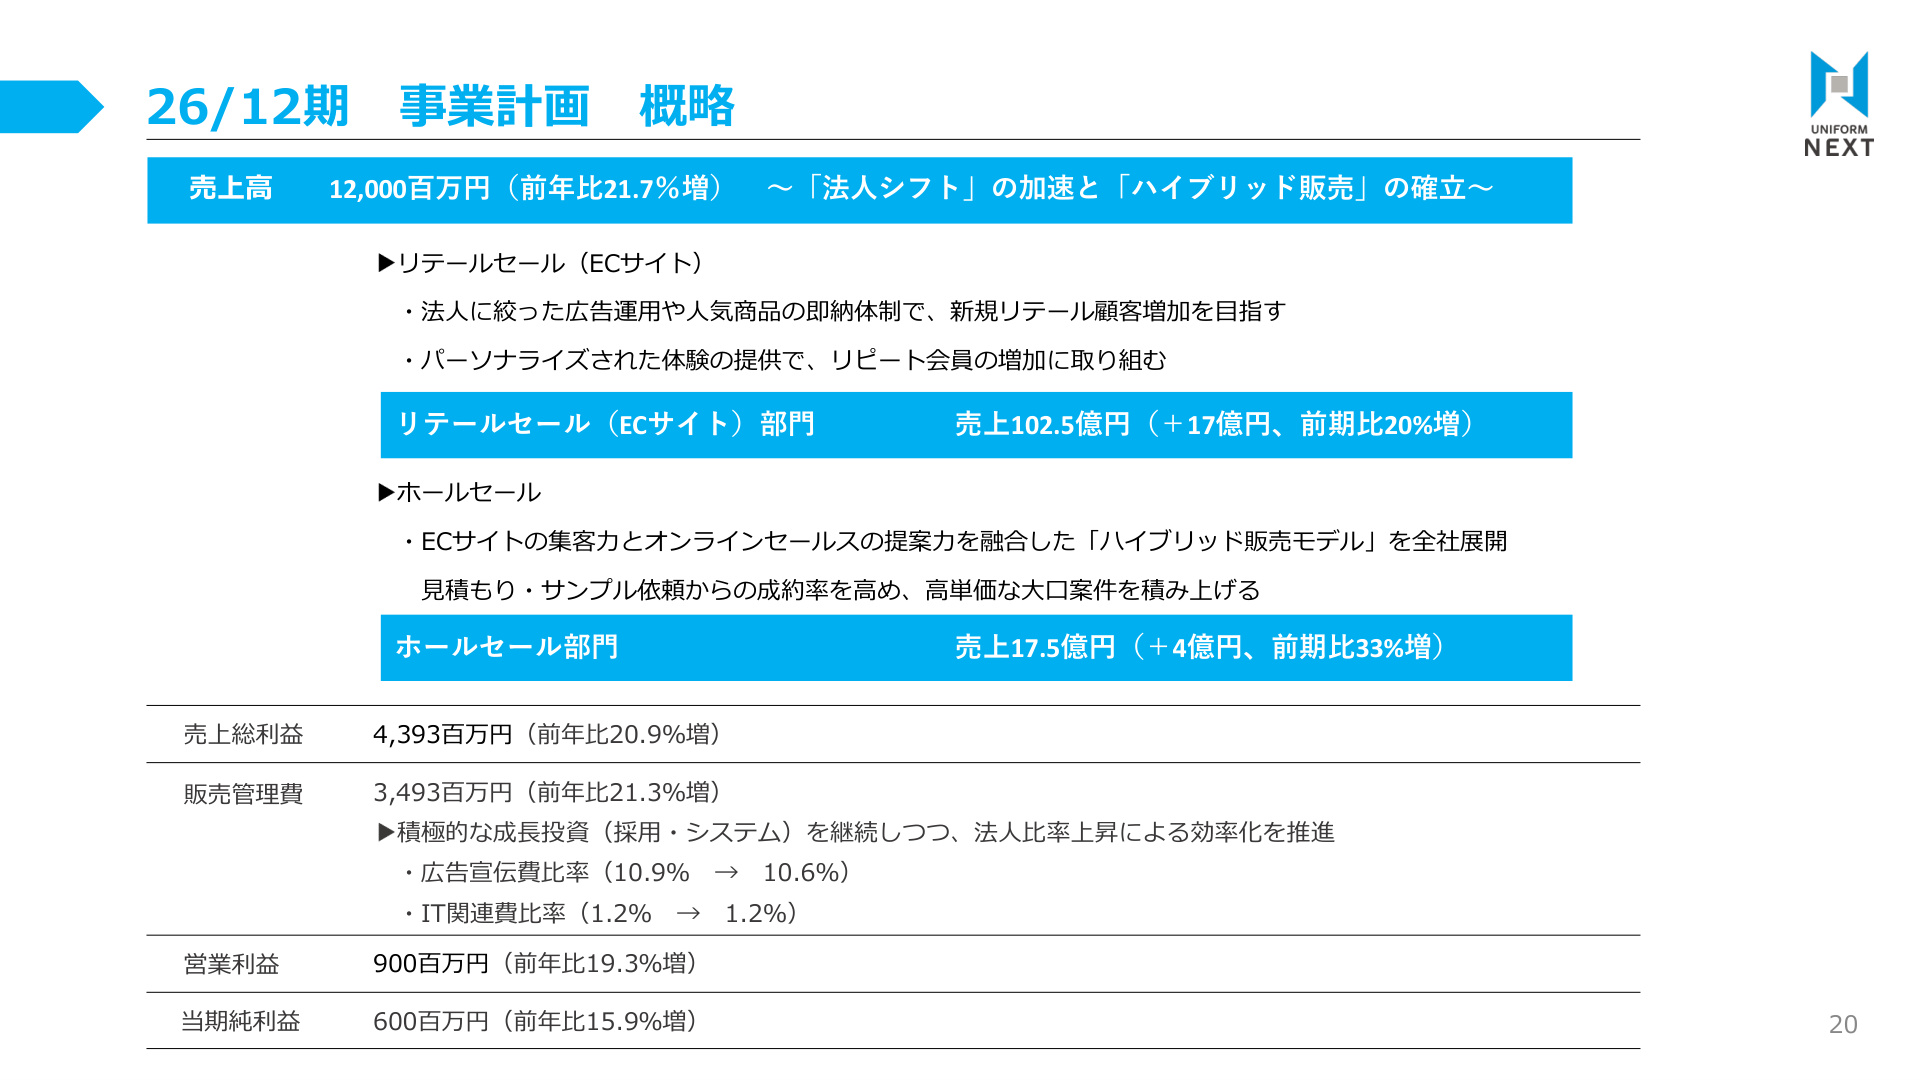
Overview of Business Plan and Strategic Points
The slide above summarizes the overall strategy and numerical targets for each department in FY2026.
1. Retail Sales (E-commerce) Strategy
- Target Revenue: 10.25 billion yen (+1.7 billion yen, up 20% YoY)
- Initiatives: Shifting from individual-focused traffic acquisition to "ad operations focused on corporate clients" with higher purchase values. Furthermore, by maintaining a "ready-to-ship" system for popular items, the company will reliably acquire new corporate clients and increase repeat rates by providing personalized purchasing experiences.
2. Wholesale Strategy
- Target Revenue: 1.75 billion yen (+0.4 billion yen, up 33% YoY)
- Deployment of "Hybrid Sales Model": The company will roll out a model across the organization that combines the overwhelming traffic and brand awareness of its websites with the high-level consultative capabilities of online sales teams (inside sales). By converting inquiries and sample requests into successful deals, the company aims to accumulate high-value, large-scale corporate projects .
3. Investment in Production Systems and Infrastructure
- Qualitative Shift in Processing Capacity: To meet the demand for complex logo embroidery and special processing resulting from the surge in corporate clients, the company invested heavily at the start of the year in processing equipment such as multi-head embroidery machines and presses, avoiding bottlenecks during peak seasons.
- Strengthening Organization and HR: Planning a net increase of approximately 40 employees to reach a 200-person structure to support business growth. Additionally, the company is aggressively promoting productivity improvements across all departments through the introduction of AI tools.
Conclusion
Uniform Next's Q2 FY2026 results demonstrated high growth in both revenue and profit, driven by the synergy between "capturing demand through early inventory securing" and the "success of corporate-shift marketing."
Upfront investments in advertising and inventory during Q1 have clearly borne fruit in the form of expanded performance from Q2 onwards. Moving forward, the further maturation of the hybrid sales model , the strengthening of in-house processing capabilities, and the maximization of LTV for the expanding active user (AU) base will be the keys to achieving the full-year targets of 12 billion yen in revenue and 900 million yen in operating profit.
This content is not intended as investment advice or a recommendation. Any opinions expressed are solely the personal views of each article.