


SUMCO Q2 FY2026 Earnings Analysis: Structural Shifts in Silicon Wafer Demand Driven by AI Evolution and Performance Recovery Scenarios

StockClub
Published: Aug 06, 2026, 10:16 AM
Sentiment Analysis
SUMCO Q2 FY2026 Earnings Deep Dive Report
SUMCO Corporation (Securities Code: 3436), a leader in semiconductor silicon wafers, has released its financial results for the second quarter (Q2) of the fiscal year ending December 2026, along with its earnings forecast for the third quarter (Q3). While the silicon wafer market remains in an environment characterized by customer inventory adjustments and market polarization, the company's earnings materials reveal two critical structural shifts: "signs of a bottoming out in Q2 performance" and "long-term demand expansion driven by the proliferation of Agentic AI."
This report provides an in-depth analysis based on facts and statistical data from the earnings materials, covering performance highlights, factors behind profit and loss fluctuations, market conditions by product and diameter, the mechanism of demand expansion through AI evolution, and shareholder return policies.
1. Performance Highlights: Q2 Results Exceed Company Forecasts; Q3 Targets Break-even Operating Profit
For the second quarter of FY2026 (Q2 standalone), the company reported net sales of ¥113.6 billion (+¥1.6 billion vs. forecast), an operating loss of ¥1.1 billion (+¥1.4 billion vs. forecast), an ordinary loss of ¥4.2 billion (+¥2.3 billion vs. forecast), and a net loss attributable to owners of the parent of ¥4.4 billion (+¥2.6 billion vs. forecast). The company significantly narrowed its losses compared to the initial operating loss forecast of ¥2.5 billion.
Cumulative Q2 (Q1+Q2) consolidated results compared to the same period last year are as follows:
- Net Sales : ¥215.0 billion (Previous year: ¥205.3 billion, change +¥9.7 billion / +4.7% )
- Operating Profit : -¥6.3 billion (Previous year: ¥7.4 billion, change -¥13.7 billion)
- Ordinary Profit : -¥12.1 billion (Previous year: ¥4.7 billion, change -¥16.8 billion)
- Net Profit Attributable to Owners of the Parent : -¥12.8 billion (Previous year: ¥3.0 billion, change -¥15.8 billion)
- EBITDA : ¥53.9 billion (Previous year: ¥56.1 billion, EBITDA margin 25.1% )
Although year-on-year results showed a significant decline due to increased depreciation burdens, a quarter-on-quarter (Q1 to Q2) comparison shows an improvement of ¥4.1 billion , moving from an operating loss of ¥5.2 billion in Q1 to -¥1.1 billion in Q2, indicating that performance momentum has shifted toward a recovery trajectory.
For the Q3 FY2026 earnings forecast , the company projects net sales of ¥118.0 billion (+¥4.4 billion QoQ), an operating profit of ¥0 billion (+¥1.1 billion QoQ), an ordinary profit of ¥1.0 billion (+¥5.2 billion QoQ), and a net profit of ¥0 billion (+¥4.4 billion QoQ), marking a planned step toward achieving a black-ink operating profit.
2. Analysis of Operating Profit Fluctuations: Profit Structure and Background of the Bottoming Out
Detailed analysis of quarterly operating profit trends is essential to understanding the company's profit structure and the pace of recovery.
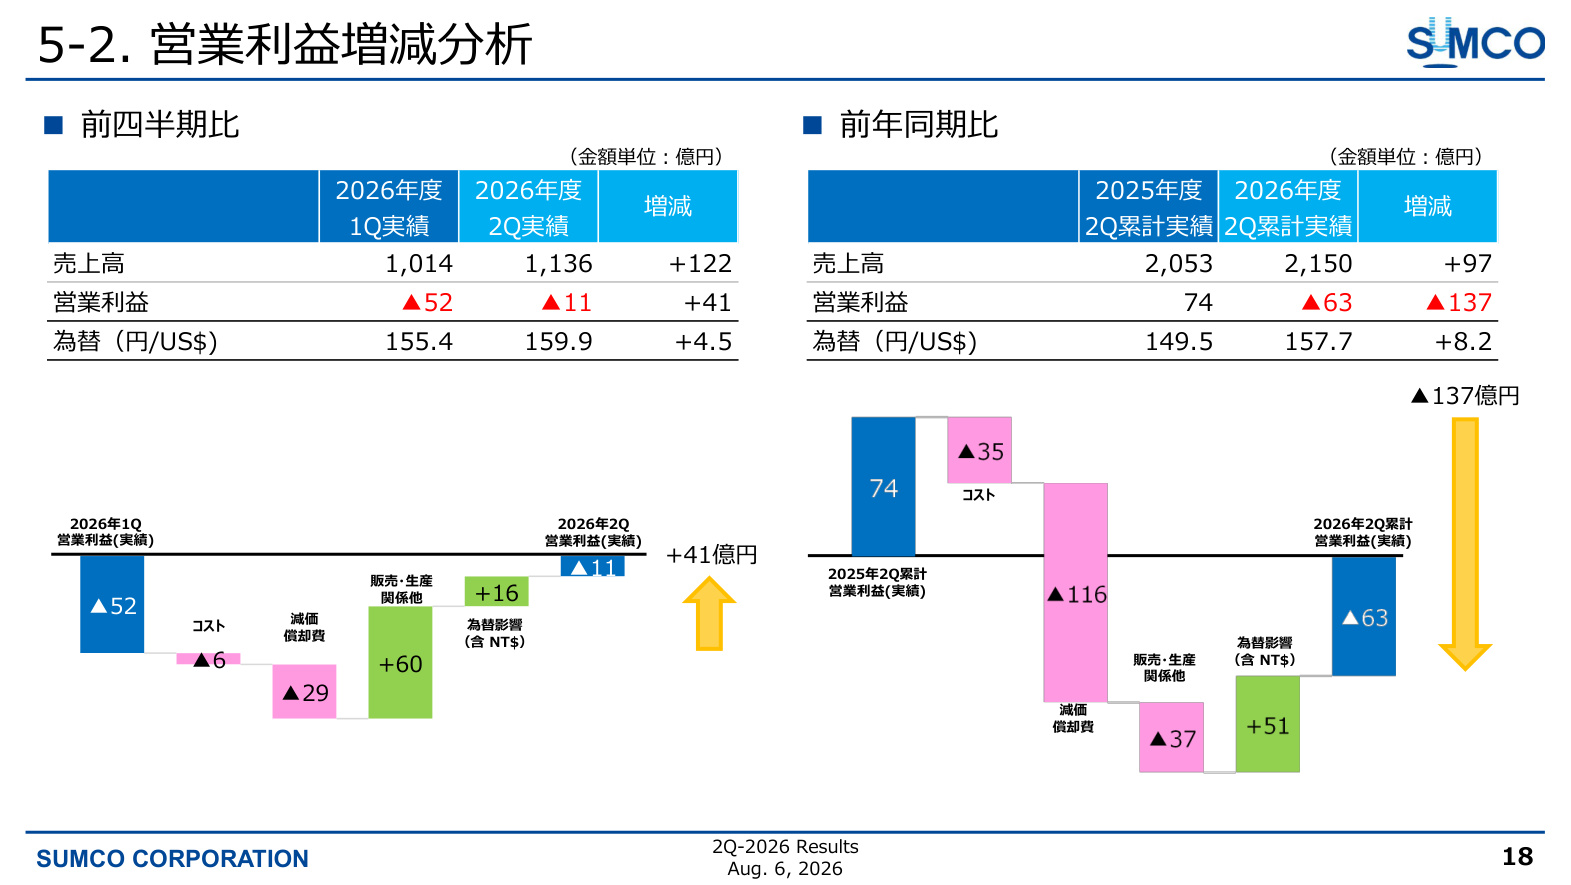
[Significance and Data Explanation of the Slide Above]
This slide presents a waterfall analysis of operating profit, showing the quarter-on-quarter (QoQ) improvement (+¥4.1 billion) from Q1 to Q2 FY2026, and the year-on-year (YoY) decline (-¥13.7 billion) from cumulative Q2 FY2025 to cumulative Q2 FY2026.
Key factors for the QoQ improvement (Q1 to Q2) include:
- Currency Impact (including NT$) : A positive factor of +¥6.0 billion . The depreciation of the yen (from an assumed rate of 155.4 JPY/USD to 159.9 JPY/USD) contributed significantly.
- Sales/Production and Other : A positive factor of +¥1.6 billion , reflecting improved capacity utilization due to increased volume.
- Despite the increased burden of depreciation (-¥2.9 billion) and higher costs (-¥0.6 billion) , the positive effects of currency and operational improvements outweighed these, leading to a sharp reduction in the deficit.
Conversely, the YoY decline of ¥13.7 billion (cumulative Q2) was driven by increased depreciation (-¥3.7 billion) , higher manufacturing costs (-¥3.5 billion) , and deterioration in sales/production and other factors (-¥11.6 billion) . While the upfront depreciation costs associated with new plant operations are pressuring profits, this has been partially offset by sales growth and currency effects (+¥5.1 billion).
3. Silicon Wafer Market Environment and Trends by Product and Diameter
Market conditions show a clear contrast between advanced and commodity products.
- 300mm (12-inch) Wafers : Demand for advanced logic and memory for AI remains extremely strong. Customer wafer inventory adjustments are progressing, and shipment volumes are clearly trending toward recovery.
- 200mm (8-inch) and smaller Wafers : While demand related to AI and data centers is visible, inventory adjustments in general-purpose fields such as industrial and automotive applications continue, resulting in a gradual recovery process overall.
- Price Trends : Prices based on Long-Term Agreements ( LTA ) remain firm. Meanwhile, spot prices are at a stage where some renegotiations and adjustments are beginning to occur.
According to estimated customer inventory data, inventory months for both logic and memory have entered a downward phase from high levels, suggesting that the speed of alignment with actual demand is increasing .
4. Demand Expansion Driven by AI Evolution: The Shift to Agentic AI
One of the most noteworthy topics in the company's earnings materials is the paradigm shift in AI technology and the resulting qualitative and quantitative changes in silicon wafer demand.
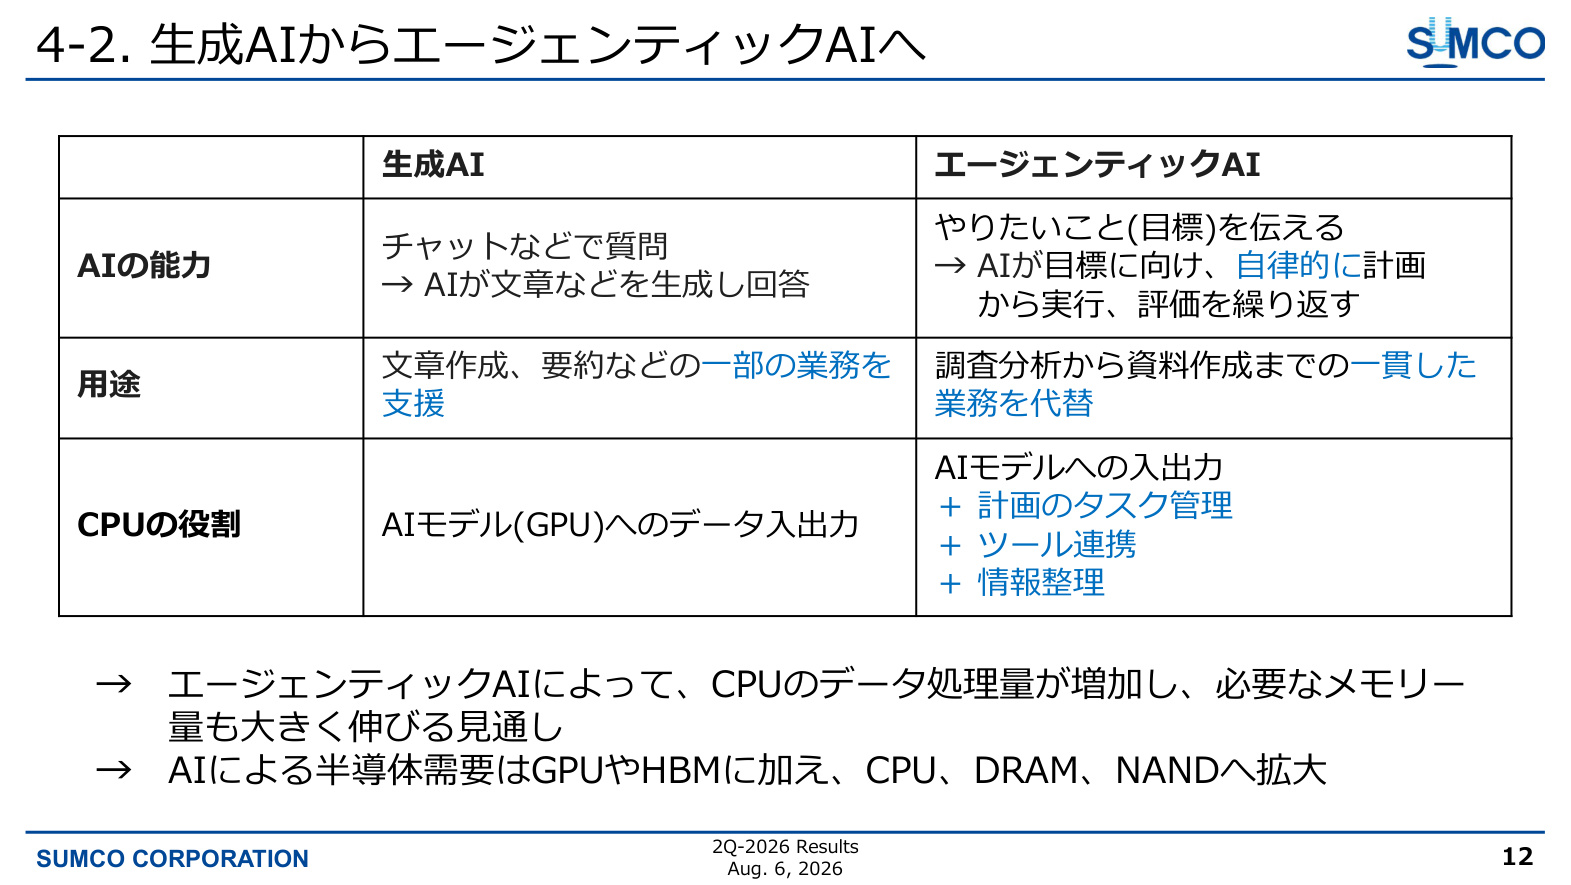
[Significance and Data Explanation of the Slide Above]
This slide compares and explains how the capabilities required for semiconductors and silicon wafers change as AI evolves from traditional "Generative AI" to "Agentic AI" and eventually to "Physical AI."
Traditional Generative AI focuses on "partial operational support," such as generating text in response to questions, where the CPU's role is primarily data input/output to the GPU. In contrast, Agentic AI autonomously repeats planning, execution, and evaluation once given a goal, handling tasks from research and analysis to document creation.
This functional evolution triggers the following significant demand ripple effects :
- Dramatic Expansion of CPU Roles and Data Processing Volume : Because the AI performs task management, tool integration, and information organization rather than just data transfer, demand for CPU processing power is surging .
- Ripple Effect on Memory Demand : As Agentic AI repeats complex processes, demand will expand significantly not only for the previously highlighted GPUs and HBM (High Bandwidth Memory) but also for general-purpose DRAM and NAND for storage.
5. Upward Revision of Server Silicon Wafer Demand Forecasts and Equipment Strategy
AI evolution is a major factor driving significant upward revisions in future server unit projections and various memory capacity forecasts.
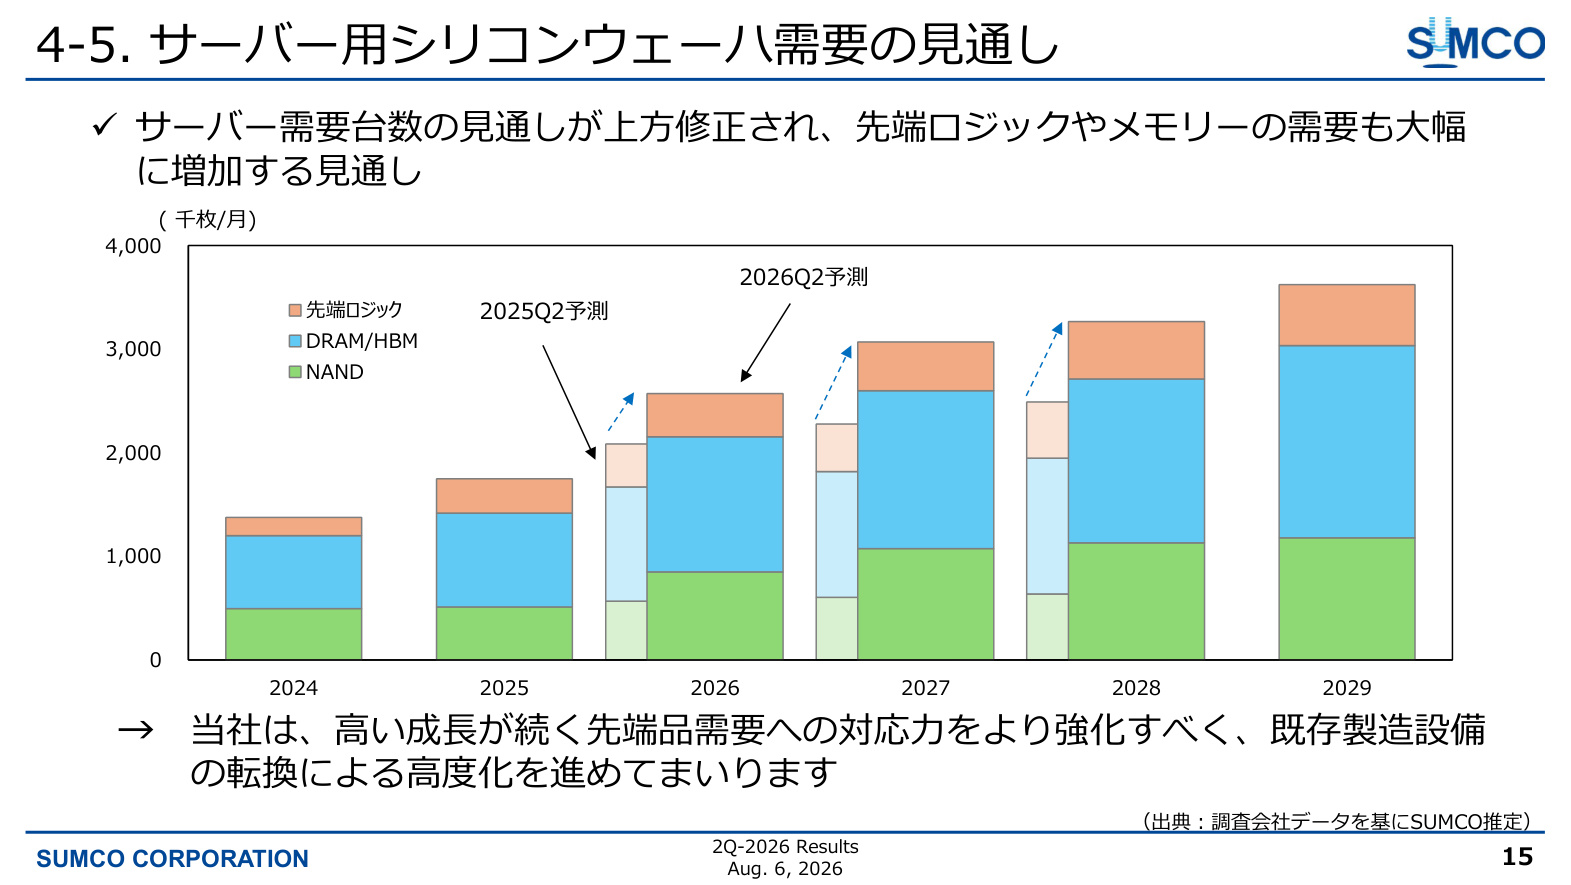
[Significance and Data Explanation of the Slide Above]
This slide shows the company's projected server silicon wafer demand (thousands of sheets/month) , illustrating the extent to which demand forecasts have been revised from the previous quarter (as of Q2 2025) to the current one (as of Q2 2026).
As the graph makes clear, demand estimates from 2026 to 2029 have been significantly revised upward . Specifically, forecasts have been increased across all categories: advanced logic , DRAM/HBM , and NAND .
To meet this robust demand for advanced products, SUMCO is not simply pursuing unlimited new plant construction (greenfield investment) but is strongly promoting a policy of "upgrading through the conversion of existing manufacturing equipment." This strategy allows the company to enhance investment efficiency while rapidly expanding supply capacity to meet the fast-growing demand for advanced products.
6. Financial Soundness and Shareholder Return Policy
Financial foundations, cash flow status, and shareholder return measures based on the earnings figures are as follows:
- Balance Sheet Status (as of end of June 2026) : Total assets are ¥1,136.6 billion (+¥8.7 billion from year-end). Cash and deposits increased to ¥111.7 billion (+¥36.5 billion), while tangible and intangible fixed assets were ¥630.6 billion (-¥40.0 billion). The equity ratio is maintained at 50.0% (51.3% at year-end), keeping financial soundness at a very high level.
- Cash Flow Status : Cumulative Q2 operating cash flow was a positive ¥46.5 billion , and investment cash flow was -¥25.5 billion , securing a positive free cash flow of ¥21.0 billion .
- Shareholder Returns (Dividend Forecast) : The interim dividend for FY2026 has been set at ¥10 per share (total dividend of ¥3.5 billion). The year-end dividend forecast remains "undecided" as it will be determined by comprehensively considering future profit levels, capital expenditure requirements, free cash flow, and EBITDA status.
7. Conclusion and Future Outlook
SUMCO's Q2 FY2026 earnings results clearly signaled a transition from current operating losses to break-even operating profit (pre-profitability) in Q3 . While concerns such as the burden of depreciation and the gradual recovery in general-purpose fields remain, the structural increase in advanced silicon wafer demand due to AI evolution (Agentic AI) and the company's existing equipment upgrade strategy form the core of its mid-to-long-term growth story.
Key points to watch moving forward include the achievement of operating profitability in Q3, trends in spot prices, and the timing of the completion of inventory adjustments by customers.
This content is not intended as investment advice or a recommendation. Any opinions expressed are solely the personal views of each article.