


SUBARU Q1 FY2027 Earnings Analysis: Revenue Growth and Value Chain Strengthening Bolster Business Foundation

StockClub
Published: Aug 05, 2026, 10:24 AM
Sentiment Analysis
SUBARU Q1 FY2027 Earnings Deep Dive Report
SUBARU Corporation (Securities Code: 7270) announced its Q1 FY2027 financial results (April 1, 2026 – June 30, 2026), reporting an increase in revenue but a decline in operating profit—a "higher revenue, lower profit" outcome. While rising incentives in the core North American market and deteriorating raw material and market conditions pressured margins, the company demonstrated resilience through mitigated U.S. tariff impacts, the benefits of a weaker yen, and the expansion of value chain earnings.
This report provides a comprehensive breakdown of the key data points from the earnings materials, offering an in-depth analysis of the company's current status and future growth trajectory.
1. Earnings Highlights: Revenue Growth and Progress Toward Full-Year Targets
Consolidated performance for the first quarter was as follows:
- Revenue : ¥1.2509 trillion (up ¥36.8 billion / +3.0% YoY)
- Operating Profit : ¥42.6 billion (down ¥33.8 billion / -44.2% YoY)
- Profit Before Tax : ¥61.4 billion (down ¥17.0 billion / -21.7% YoY)
- Profit Attributable to Owners of Parent : ¥49.2 billion (down ¥5.7 billion / -10.4% YoY)
- Exchange Rate (US$) : ¥159 (depreciation of ¥13 YoY)
Revenue growth was secured due to the resilience of overseas sales and favorable currency effects. Although operating profit declined from ¥76.4 billion in the same period last year, the company has achieved ¥42.6 billion against its full-year operating profit target of ¥150 billion (a progress rate of 28.4%) , with management characterizing the progress as "solid relative to the full-year outlook."
2. Production and Sales Trends: Domestic Production Adjustments and Market Dynamics
Group-wide volume figures for both production and consolidated sales fell below the levels of the same period last year.
Production Trends
- Domestic Production : 118,000 units (-35,000 units YoY)
- U.S. Production (SIA) : 95,000 units (+0 units YoY)
- Total Production : 213,000 units (-34,000 units YoY)
While domestic production saw a decrease due to line adjustments, Subaru of Indiana Automotive, Inc. (SIA) maintained high production levels comparable to the previous year.
Consolidated Vehicle Sales by Market
- Domestic Sales : 23,000 units (+0 units YoY)
- Registered vehicles: 20,000 units (+0)
- Mini-vehicles: 3,000 units (-1,000)
- Overseas Sales : 197,000 units (-23,000 units YoY)
- U.S. : 150,000 units (-21,000)
- Canada: 19,000 units (+0)
- Europe: 8,000 units (+2,000)
- Australia: 11,000 units (-4,000)
- Others: 9,000 units (+0)
- Total Consolidated Sales : 220,000 units (-23,000 units YoY)
The decline in sales in the U.S., the largest market, was the primary factor dragging down overall volume, though slight growth was observed in regions such as Europe.
3. Analysis of Operating Profit Fluctuations: Headwinds and Tailwinds
The decline in operating profit from ¥76.4 billion to ¥42.6 billion (a ¥33.8 billion decrease) is the result of several conflicting factors.
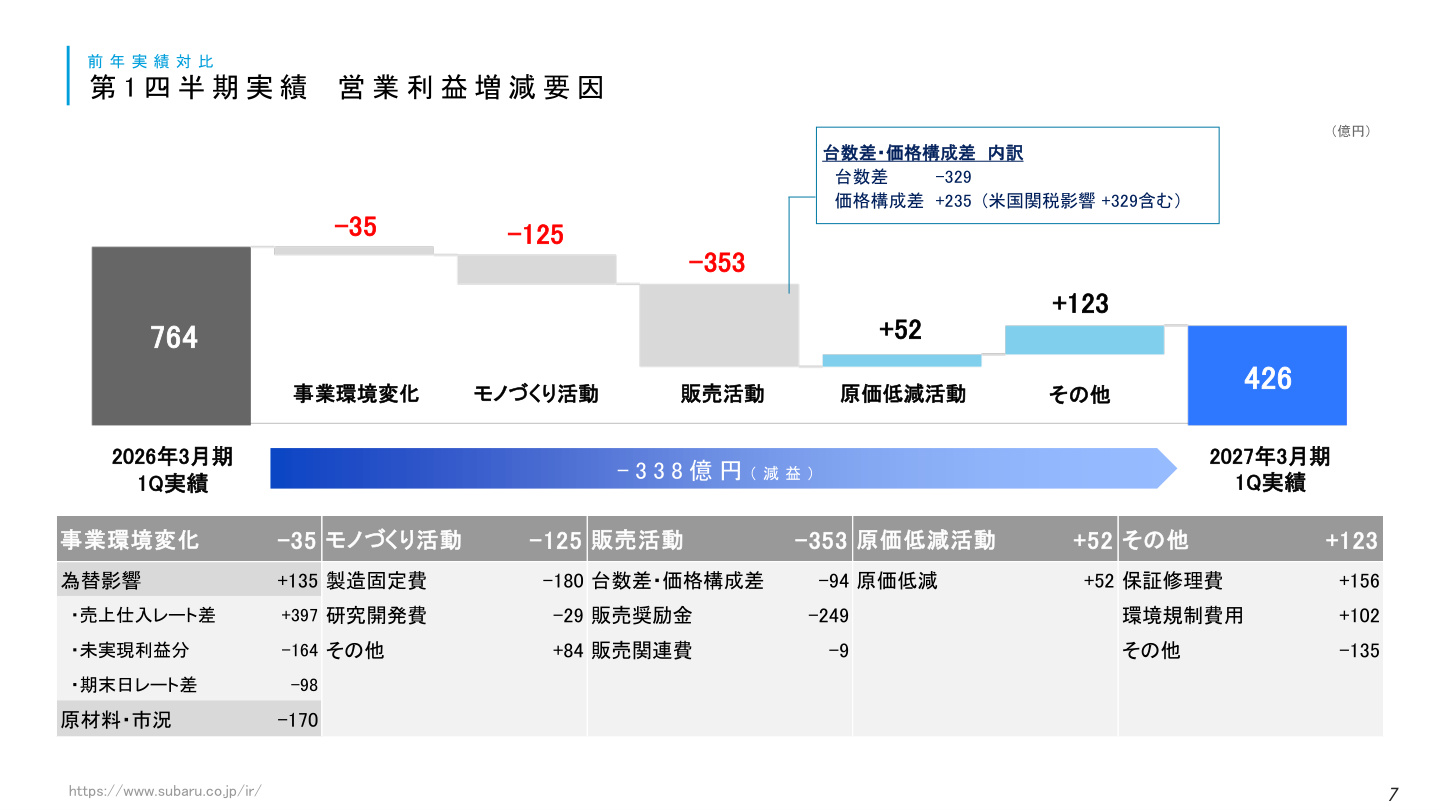
Why This Slide is Important and Data Context
The waterfall chart above is the core analytical data that structurally illustrates the year-over-year changes in Q1 operating profit. The following factor analysis is crucial for understanding the overall earnings picture:
- Sales Activities (-¥35.3 billion) : The largest contributor to profit pressure. This includes a volume/mix variance of -¥9.4 billion (comprising -¥32.9 billion from lower sales volume and +¥23.5 billion from price/mix) and a ¥24.9 billion decrease due to increased incentives amid intensifying competition.
- Business Environment Changes (-¥3.5 billion) : While deteriorating raw material and market conditions (-¥17.0 billion) were a significant negative, they were largely offset by currency effects (+¥13.5 billion) , driven by the weaker yen (e.g., +¥39.7 billion from sales/purchase rate differences).
- Manufacturing Activities (-¥12.5 billion) : Manufacturing fixed costs increased by ¥18.0 billion due to infrastructure investment for the future, as well as rising labor and fixed costs.
- Cost Reduction Activities (+¥5.2 billion) and Others (+¥12.3 billion) : In addition to cost improvements, factors such as reduced warranty repair expenses (+¥15.6 billion) and improvements in environmental regulatory costs (+¥10.2 billion) contributed positively.
Notably, the U.S. tariff impact included in the price/mix variance brought a ¥32.9 billion improvement (positive factor) YoY , primarily due to lower automotive tariff rates, demonstrating that reduced tariff costs significantly supported profitability.
4. Segment Performance and Management Metrics: Shifting Away from New Car Dependency
Looking at business segments, the Automotive and Aerospace businesses show contrasting trends.
Performance by Business Segment
- Automotive Business : Revenue ¥1.2109 trillion (+¥27.0 billion), Operating Profit ¥40.1 billion (-¥34.0 billion)
- Aerospace Business : Revenue ¥38.7 billion (+¥9.9 billion), Operating Profit ¥0.6 billion (+¥0.3 billion)
- Other/Corporate Adjustments : Operating Profit ¥1.9 billion (-¥0.1 billion)
While the decline in the Automotive business is the main driver of the overall profit drop, an internal breakdown of the Automotive business based on management metrics reveals a fascinating structural shift.
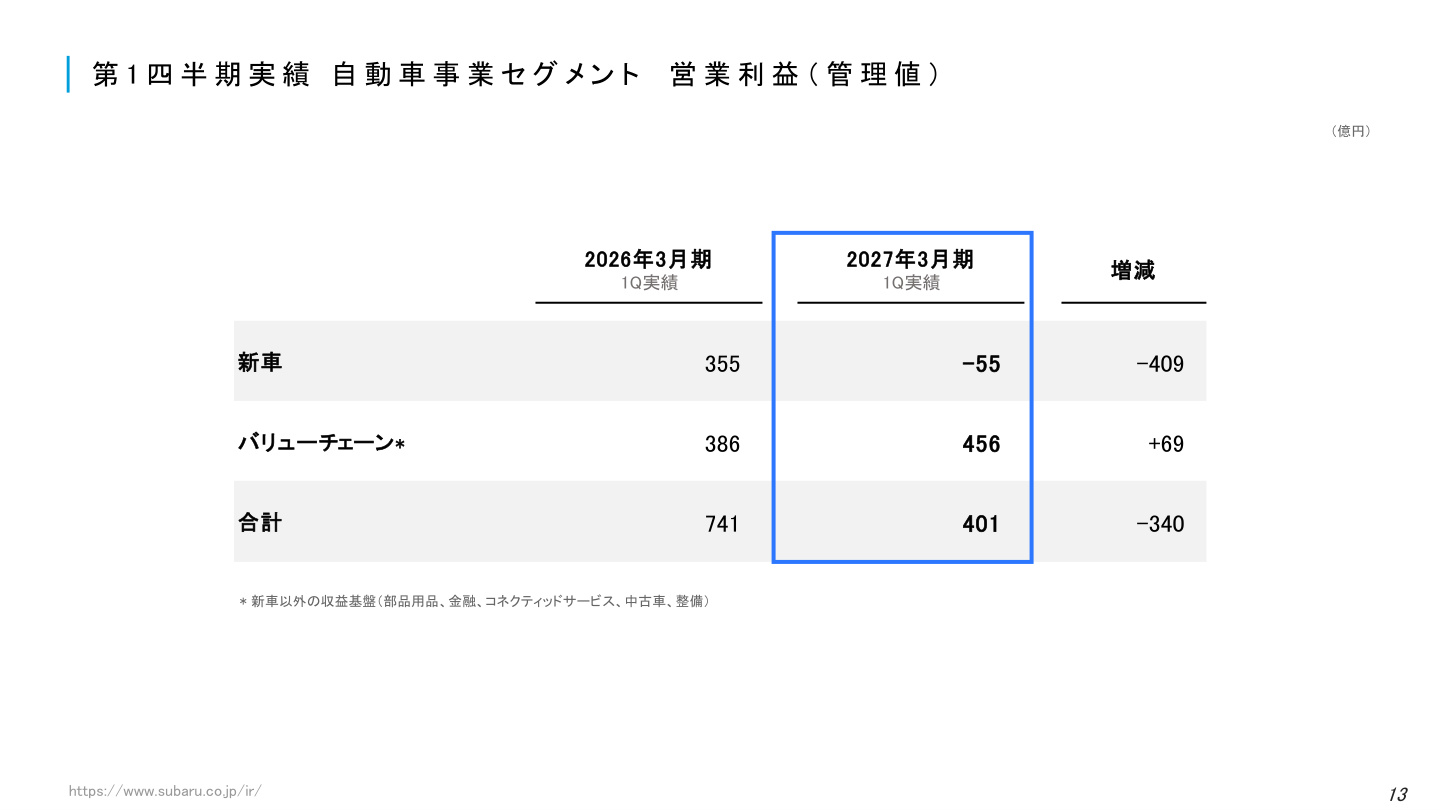
Why This Slide is Important and Data Context
This slide is a key indicator of the qualitative change in the company's earnings structure , breaking down the Automotive business operating profit (¥40.1 billion) into "New Car Sales Profit" and "Value Chain Profit."
- New Car Business : -¥5.5 billion (a turnaround to a loss of ¥40.9 billion from ¥35.5 billion in the same period last year)
- Value Chain Business : ¥45.6 billion (an increase of ¥6.9 billion from ¥38.6 billion in the same period last year)
Manufacturing and selling new cars alone fell into the red due to sluggish sales, increased incentives, and higher fixed costs. However, earnings from the value chain —including parts and accessories, automotive finance, connected services, and used car/maintenance services— expanded to ¥45.6 billion, fully offsetting the losses from the new car business . This proves that the company's "Value Chain Earnings Expansion" strategy is yielding results, acting as a cushion to mitigate earnings volatility.
5. Regional Analysis and U.S. Subsidiary Performance
From a regional perspective, performance diverged between Japan and North America.
Regional Segments
- Japan : Revenue ¥279.3 billion (+¥20.7 billion), Operating Profit ¥55.4 billion (+¥19.9 billion YoY)
- North America : Revenue ¥936.2 billion (+¥8.4 billion), Operating Profit -¥13.2 billion (a turnaround to a loss of ¥31.9 billion YoY )
While the Japan region achieved a significant profit increase due to improved export profitability and currency tailwinds, the North American region fell into an operating loss as local sales expenses and rising incentives took a direct toll.
U.S. Subsidiary Performance (USD-based)
- SOA (Subaru of America, Inc. / Sales) :
- Revenue: $5.354 billion (-$575 million)
- Operating Profit: -$115 million (vs. +$80 million in the same period last year)
- Retail Sales: 165,000 units (+11,000 units / +7.1% YoY)
- SIA (Subaru of Indiana Automotive, Inc. / Manufacturing) :
- Revenue: $2.674 billion (-$60 million)
- Operating Profit: -$35 million (vs. +$50 million in the same period last year)
- Production: 95,000 units (+0 units)
Although SOA's retail sales reached 165,000 units, showing solid demand, it is clear that timing differences with wholesale volume and increased incentives weighed on profitability.
6. Cash Flow and Financial Health
Despite the challenging business environment, the company maintains a robust balance sheet and strong cash flow generation capabilities.
Cash Flow Status (Q1 Actuals)
- Cash Flow from Operating Activities : ¥55.5 billion (vs. ¥147.2 billion YoY)
- Cash Flow from Investing Activities : -¥31.7 billion (vs. -¥102.0 billion YoY)
- Free Cash Flow : ¥23.8 billion (vs. ¥45.2 billion YoY)
- Cash Flow from Financing Activities : -¥104.0 billion (vs. -¥66.5 billion YoY)
Liquidity and Safety Indicators (As of June 30, 2026)
- Cash and Cash Equivalents (incl. time deposits) : ¥1.3577 trillion
- Interest-bearing Debt : ¥364.5 billion
- Net Cash (incl. time deposits) : ¥993.2 billion
- Equity Ratio : 51.2% (+0.6 points from end of previous fiscal year)
- D/E Ratio : 0.13 (-0.01 points from end of previous fiscal year)
With net cash of approximately ¥1 trillion and an equity ratio exceeding 50%, the company maintains a stable financial structure with sufficient funds for investments in electrification and new technology development.
7. Mid-to-Long-Term Growth Strategy: Entry into North American Automotive Finance
The company has announced new strategic initiatives to strengthen its future growth foundation.

Why This Slide is Important and Data Context
This slide is a significant announcement detailing specific measures for "strengthening the management foundation" and "expanding value chain earnings" as outlined in the "2025 Policy."
- Target Entry Timing : Around 2030
- Target Region : North American Market
- Business Scope : Automotive loans and leases for customers, and floor plan (inventory financing) for retailers.
Currently, automotive finance in North America relies heavily on external partners. By developing in-house or more direct finance operations, the company aims to strengthen long-term customer engagement, improve repurchase rates, and capture financial revenue from both retail customers and retailers. As noted, this is a critical step toward evolving into a business model that generates stable earnings across the entire value chain, even during periods of declining new car gross margins.
8. Full-Year Outlook and Key Focus Points
The full-year consolidated earnings forecast for FY2027 remains unchanged from the previous announcement.
Full-Year Earnings Outlook (Published Figures)
- Production : 900,000 units
- Consolidated Sales : 940,000 units
- Revenue : ¥5.2 trillion
- Operating Profit : ¥150 billion (Assumed exchange rate: ¥155/US$ )
- Profit Before Tax : ¥180 billion
- Net Profit : ¥130 billion
- Capital Expenditure : ¥160 billion
- Depreciation : ¥125 billion
- R&D Expenditure : ¥145 billion
Strategic Initiatives and Key Focus Points
- Start of Mixed BEV/ICE Production at Yajima Plant : The Gunma Yajima Plant will soon begin mixed production of Battery Electric Vehicles (BEVs) and Internal Combustion Engine (ICE) vehicles. This will establish a system to maintain high plant utilization and maximize sales volume while responding flexibly to fluctuations in EV demand.
- Further Expansion of Value Chain Earnings : To compensate for fluctuations in new car gross margins, the company will continue to evolve and generate earnings in value chain areas such as parts, maintenance, and finance.
- Monitoring Market and Geopolitical Risks : Raw material and market prices, which showed some decline around June, have recently reversed. Close attention must be paid to cost fluctuations resulting from high volatility and geopolitical risks.
Summary
SUBARU's Q1 FY2027 earnings saw an operating profit decline due to headwinds such as increased incentives and higher raw material costs. However, the company showed steady progress toward its full-year targets, supported by improved U.S. tariff impacts , yen depreciation effects , and the solid expansion of value chain earnings (¥45.6 billion) . Moving forward, the focus will be on whether the company can successfully shift to a more resilient business model through production optimization via mixed production at the Yajima Plant and the planned entry into the North American automotive finance business by 2030.
This content is not intended as investment advice or a recommendation. Any opinions expressed are solely the personal views of each article.