

Yamae Group Holdings Q1 FY2027 Earnings Analysis: Record-High Performance and Accelerated Growth Strategy

Sentiment Analysis

Yamae Group Holdings Co., Ltd. delivered an exceptionally strong start to the fiscal year ending March 2027, with Q1 results reaching record highs across both revenue and all profit lines . The combination of earnings contributions from group companies acquired through aggressive M&A and robust performance in existing segments has propelled consolidated net sales past the ¥300 billion milestone.
This report extracts 10 key topics from the recently released earnings materials, providing a detailed analysis of Yamae Group’s performance highlights, segment trends, M&A strategy, and full-year outlook.
1. Q1 Consolidated Performance Highlights: Record Highs Across All Profit Items
Consolidated results for the first quarter of the fiscal year ending March 2027 showed significant year-on-year growth in both revenue and profit.
- Net Sales : ¥301.1 billion ( +17.5% YoY, +¥44.8 billion)
- Gross Profit : ¥36.7 billion ( +17.9% YoY, +¥5.5 billion)
- Operating Profit : ¥3.9 billion ( +12.8% YoY, +¥0.4 billion)
- Ordinary Profit : ¥4.2 billion ( +21.0% YoY, +¥0.7 billion)
- Quarterly Net Profit Attributable to Owners of Parent : ¥5.1 billion ( +254.2% YoY, +¥3.7 billion)
- EBITDA : ¥7.2 billion ( +10.8% YoY, +¥0.7 billion)
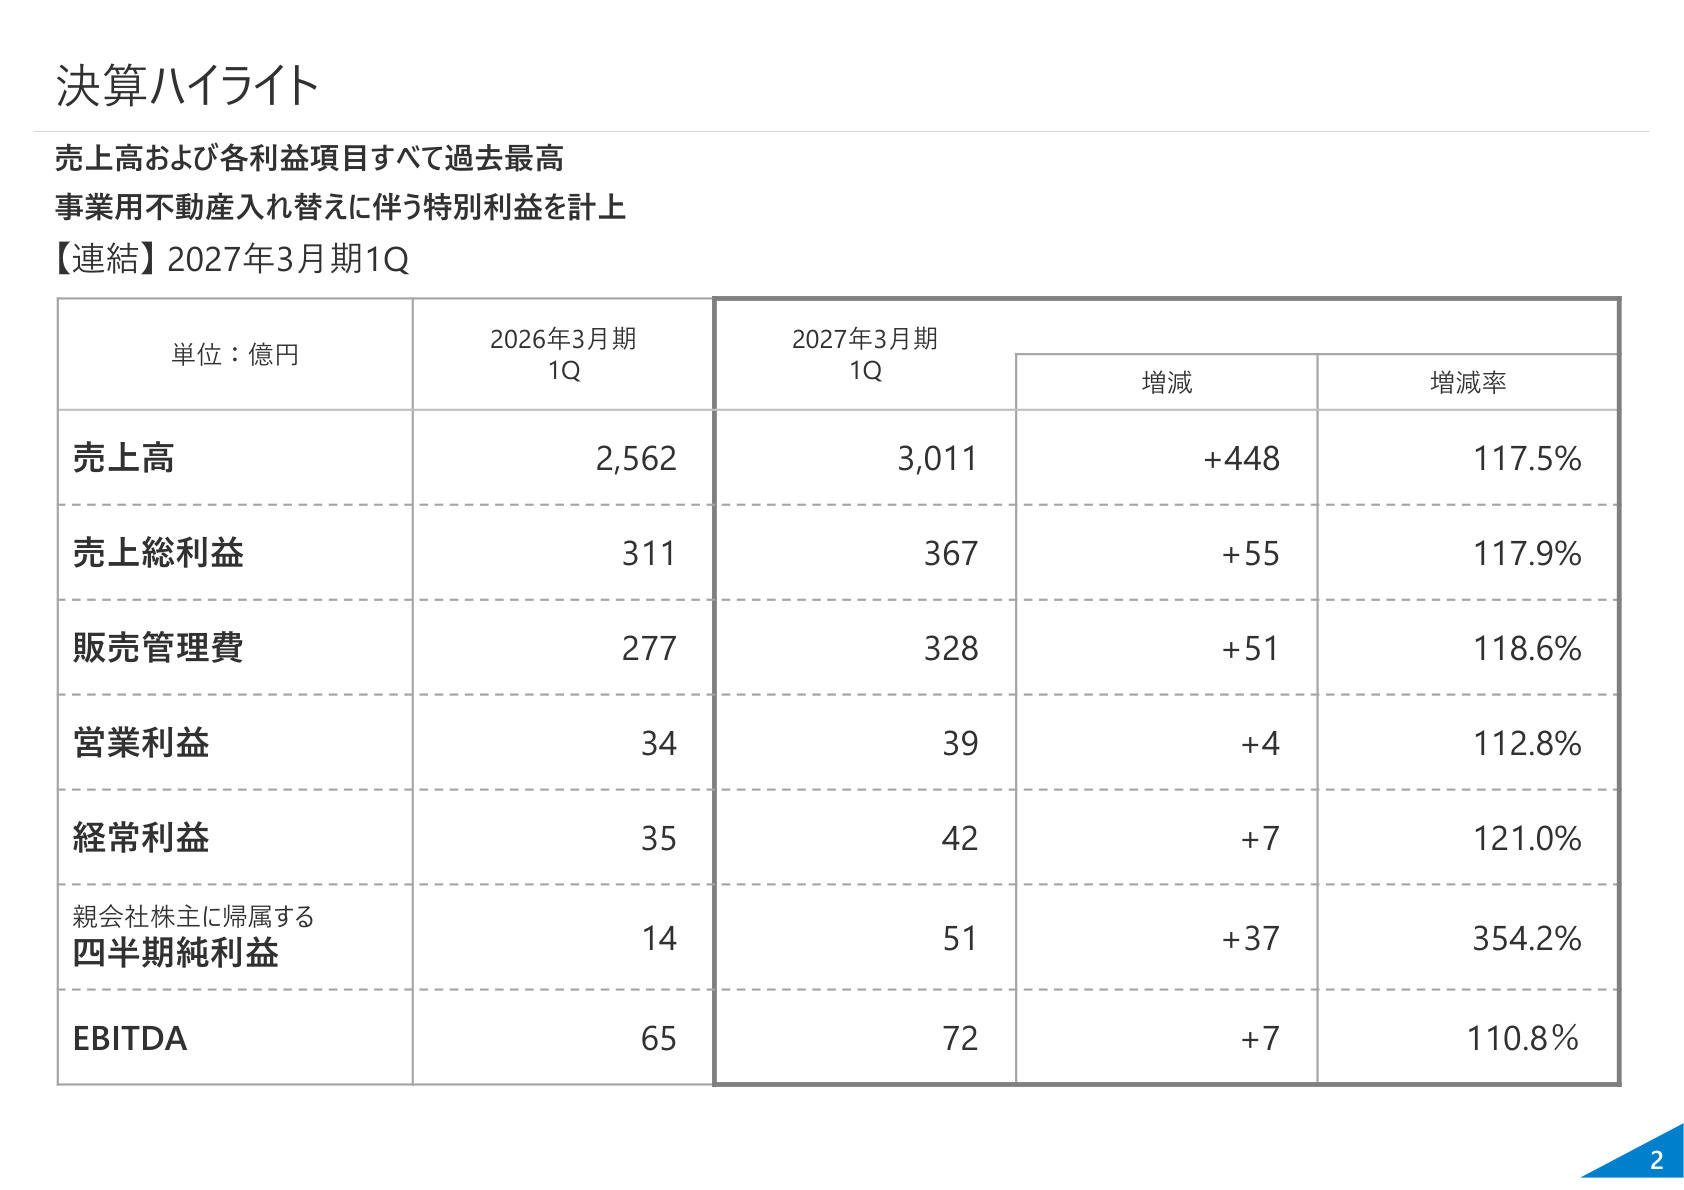
The slide above summarizes Yamae Group’s Q1 performance metrics. This slide is critical as it provides empirical data confirming that the company has achieved record highs in net sales and all profit categories . Of particular note is the surge in quarterly net profit attributable to owners of the parent, which jumped approximately 3.5 times (+254.2%) from ¥1.4 billion in the same period last year to ¥5.1 billion, driven by extraordinary gains from the rotation of business real estate assets . Core operating and ordinary profits also maintained double-digit growth, signaling a further strengthening of the company's growth foundation.
2. Sales Trends by Business Category: Significant Growth in Convenience Store and Manufacturing Sectors
Looking at sales by business category, the results reflect both stable growth in existing sectors and the successful integration of newly acquired subsidiaries.
- Supermarkets : ¥73.2 billion ( +5.9% YoY)
- Convenience Stores & Mini-Supermarkets : ¥54.0 billion ( +68.8% YoY)
- Drugstores : ¥33.6 billion ( +4.7% YoY)
- Agriculture, Fishery, Livestock & Manufacturing : ¥35.1 billion ( +21.0% YoY)
- Lumber & Housing Materials : ¥28.5 billion ( +22.3% YoY)
- Wholesale & Trading : ¥17.0 billion ( +25.0% YoY)
Notably, sales to convenience stores and mini-supermarkets surged by 68.8% YoY , driving the group's overall revenue growth. The agriculture, fishery, livestock, and manufacturing sectors, as well as lumber and housing materials, also demonstrated strong growth exceeding 20%.
3. Segment Performance Analysis: Synergies Between Core Food and Peripheral Businesses
The composition of sales and operating profit (before consolidated adjustments) by segment is as follows:
-
Food-Related Business :
- Sales: ¥233.8 billion (vs. ¥197.2 billion in the previous year)
- Operating Profit: ¥2.5 billion (vs. ¥2.3 billion in the previous year)
- Core businesses such as food wholesaling and prepared food manufacturing are growing strongly.
-
Sugar, Flour, Feed & Livestock-Related Business :
- Sales: ¥35.0 billion (vs. ¥30.2 billion in the previous year)
- Operating Profit: ¥1.2 billion (vs. ¥0.9 billion in the previous year)
- Captured demand in feed and livestock, contributing steadily to profits.
-
Housing & Real Estate-Related Business :
- Sales: ¥28.3 billion (vs. ¥23.1 billion in the previous year)
- Operating Profit: ¥0.5 billion (vs. ¥0.3 billion in the previous year)
- Lumber processing, housing material sales, and real estate operations are functioning as the group's second pillar of growth.
-
Other Businesses :
- Sales: ¥3.9 billion (vs. ¥5.6 billion in the previous year)
- Operating Profit: ¥0.1 billion (vs. ¥0.2 billion in the previous year)
4. Financial Position and Equity Trends: Balancing Asset Expansion with Financial Soundness
The balance sheet as of the end of Q1 FY2027 shows an expansion in total assets due to aggressive M&A and business growth, while the equity ratio has also improved.
- Total Assets : ¥457.9 billion ( +¥3.8 billion from the end of the previous fiscal year)
- Fixed assets, including buildings and land, increased by ¥4.4 billion to ¥210.5 billion.
- Total Liabilities : ¥337.3 billion ( +¥1.5 billion from the end of the previous fiscal year)
- Net Assets : ¥120.5 billion ( +¥2.3 billion from the end of the previous fiscal year)
- Equity Ratio : 24.1% ( +0.3 percentage points from the end of the previous fiscal year)
- Book Value Per Share (BPS) : ¥3,968 ( +¥86 from the end of the previous fiscal year)
By optimizing business real estate assets while steadily accumulating net assets, the equity ratio improved to 24.1% .
5. Full-Year Earnings Forecast: Aiming for the ¥1.2 Trillion Revenue Milestone
Yamae Group has set ambitious full-year earnings targets for the fiscal year ending March 2027, significantly exceeding the previous year's figures.
- Net Sales : ¥1,200 billion ( +10.6% YoY, +¥114.7 billion)
- Operating Profit : ¥22.0 billion ( +21.7% YoY, +¥3.9 billion)
- Ordinary Profit : ¥23.0 billion ( +23.2% YoY, +¥4.3 billion)
- Net Profit Attributable to Owners of Parent : ¥12.5 billion ( +12.8% YoY, +¥1.4 billion)
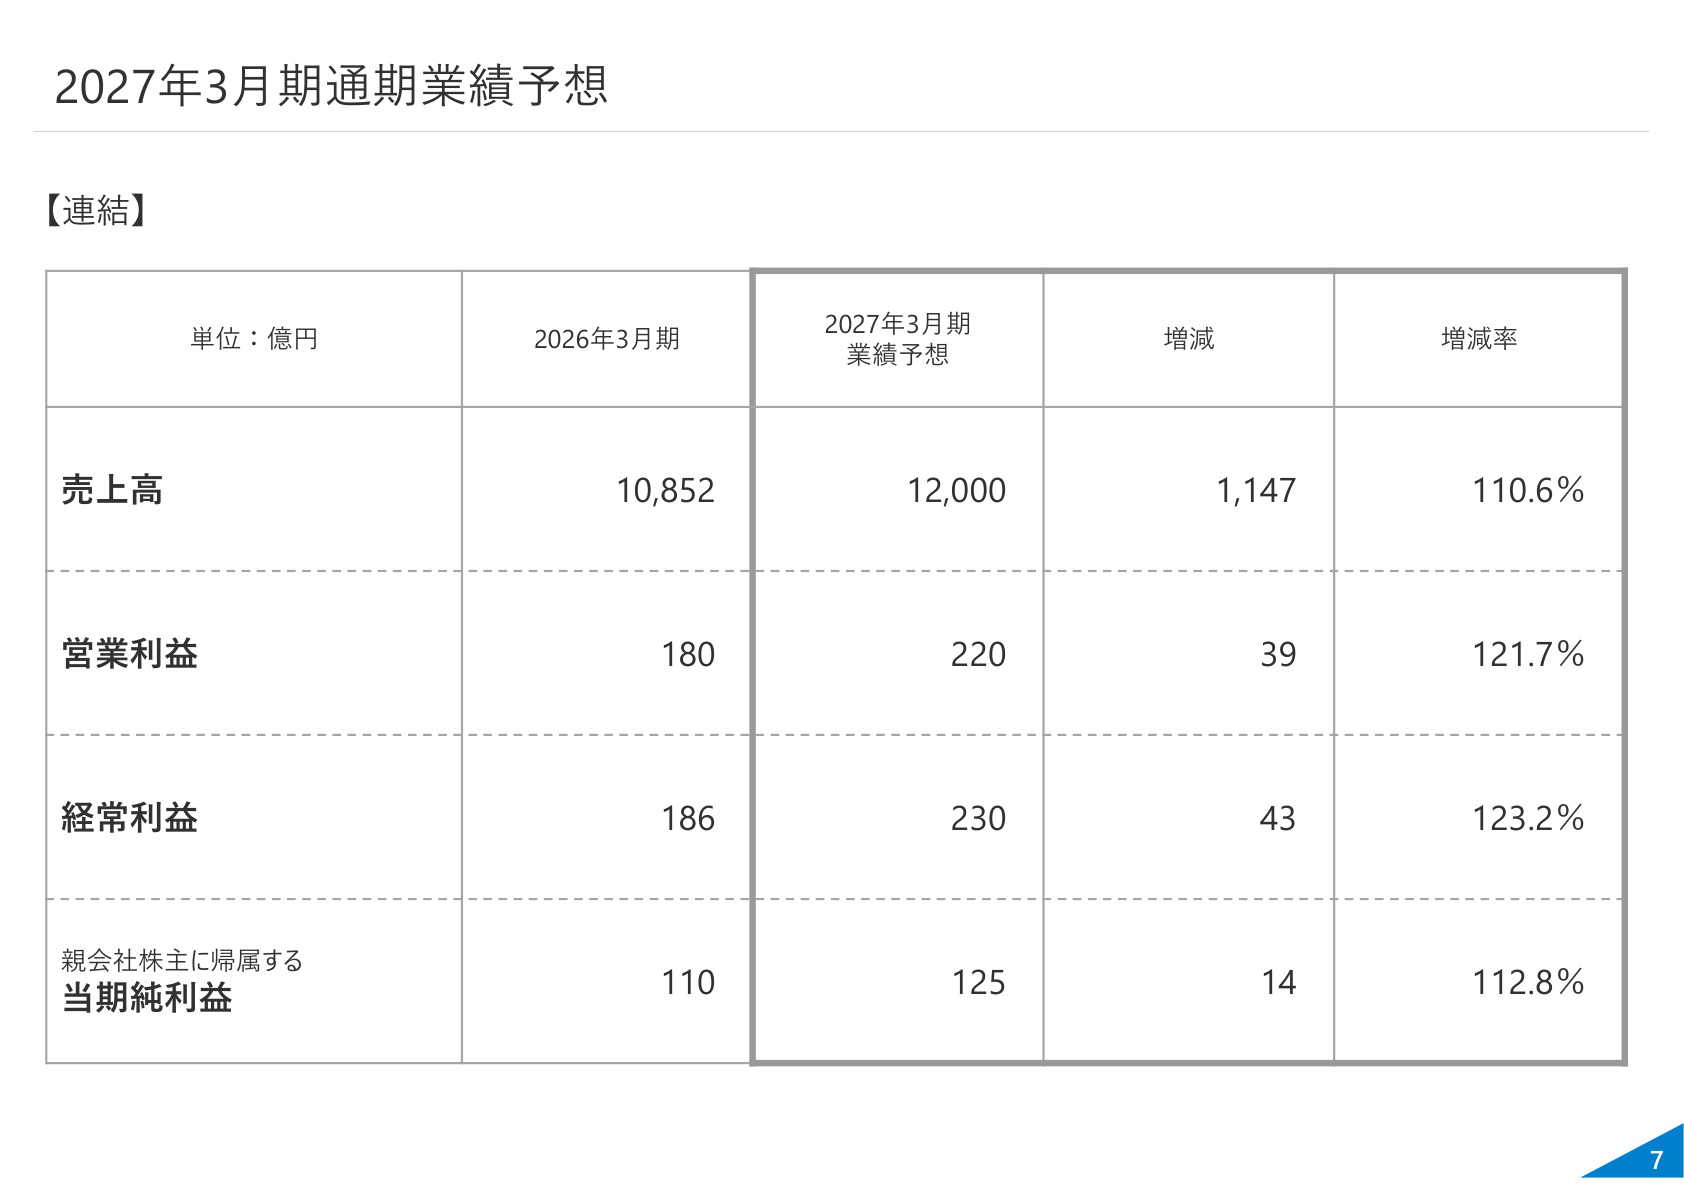
This slide shows the full-year earnings forecast for FY2027 and the Q1 progress rate as a basis. Due to the nature of Yamae Group's business structure, sales and profits tend to be weighted toward the second half of the year (particularly due to year-end demand) . While the Q1 progress rate against the full-year target is 25.1% for net sales (¥301.1 billion / ¥1,200 billion) and 18.3% for ordinary profit (¥4.2 billion / ¥230 billion), when measured against the first-half plan (¥550 billion in sales, ¥9 billion in ordinary profit), the progress rate for net sales reaches 55% and ordinary profit reaches 47% , confirming that the company is tracking at an extremely favorable pace.
6. Dividend Policy: Maintaining Stable Dividends and Shareholder Returns
Yamae Group maintains a policy of "continuing stable dividends."
- FY2027 Forecast Annual Dividend : ¥80 (Forecast Payout Ratio 17.8% )
- Historical Trend : The dividend has been steadily increased in line with business expansion, from ¥40 in FY2022 to ¥50 (FY23), ¥60 (FY24), ¥70 (FY25), and ¥80 (FY26).
While continuing high-level investments, the company plans to maintain an annual dividend of ¥80 , promoting a capital policy that balances shareholder returns with growth investment.
7. Strategic M&A Topic: Strengthening Detached Housing and Real Estate (My Life Planning)
In April 2026, Yamae Group acquired My Life Planning Co., Ltd. (87 employees) and its affiliates (My Life Home, Miyama Housing), which develop detached housing businesses primarily in the Tokyo metropolitan area.
- Business Scope : Provides urban package houses, handling everything from land procurement to planning, design, construction, and sales within the group.
- Objective : To strengthen detached housing development capabilities in key sales areas such as Tokyo's 23 wards, Saitama, and Kanagawa, and to create synergies with the group's existing housing and real estate business.
8. Strategic M&A Topic: Strengthening Logistics Networks in Northern Kyushu (Hazama Logistics Service)
Also in April 2026, the group acquired Hazama Logistics Service Co., Ltd. , which operates transportation and logistics businesses primarily in the northern Kyushu area.
- Facilities : Owns a headquarters (7,819 tsubo) and Ogori office (2,118 tsubo), providing refrigerated, ambient, and temperature-controlled transport, as well as 3PL services.
- Delivery Network : Possesses a network capable of delivering via its own fleet from all of Kyushu to the Chugoku region, covering the Chugoku, Shikoku, and Kansai areas.
- Objective : To expand the group's in-house logistics infrastructure and improve supply chain efficiency in food distribution, the group's core business.
9. Strategic M&A Topic: Nationwide Expansion in Housing and Building Materials (Brecs Group)
In August 2026, the group acquired the Brecs Group (Brecs HD, Brecs, Brecs Products), which develops unit bath businesses for multi-family housing.
- Features : Develops unit baths for rental housing under the "BReCS" brand. Possesses a vertically integrated production system from raw materials to molding (a 56,000㎡ factory in Komatsu City, Ishikawa Prefecture).
- Locations : Covers nationwide bases including Tokyo (Minato-ku), Ishikawa, Sendai, Niigata, Komatsu, Hiroshima, and Fukuoka.
- Objective : To accelerate the nationwide expansion of the housing equipment and materials business by leveraging high in-house production rates and nationwide sales and construction cooperation systems.
10. Comprehensive Analysis: A Unique "Food & Living" Ecosystem Covering the Entire Value Chain
Yamae Group's strength lies in its construction of a business model that covers the entire value chain , rather than acting merely as a distribution wholesaler.
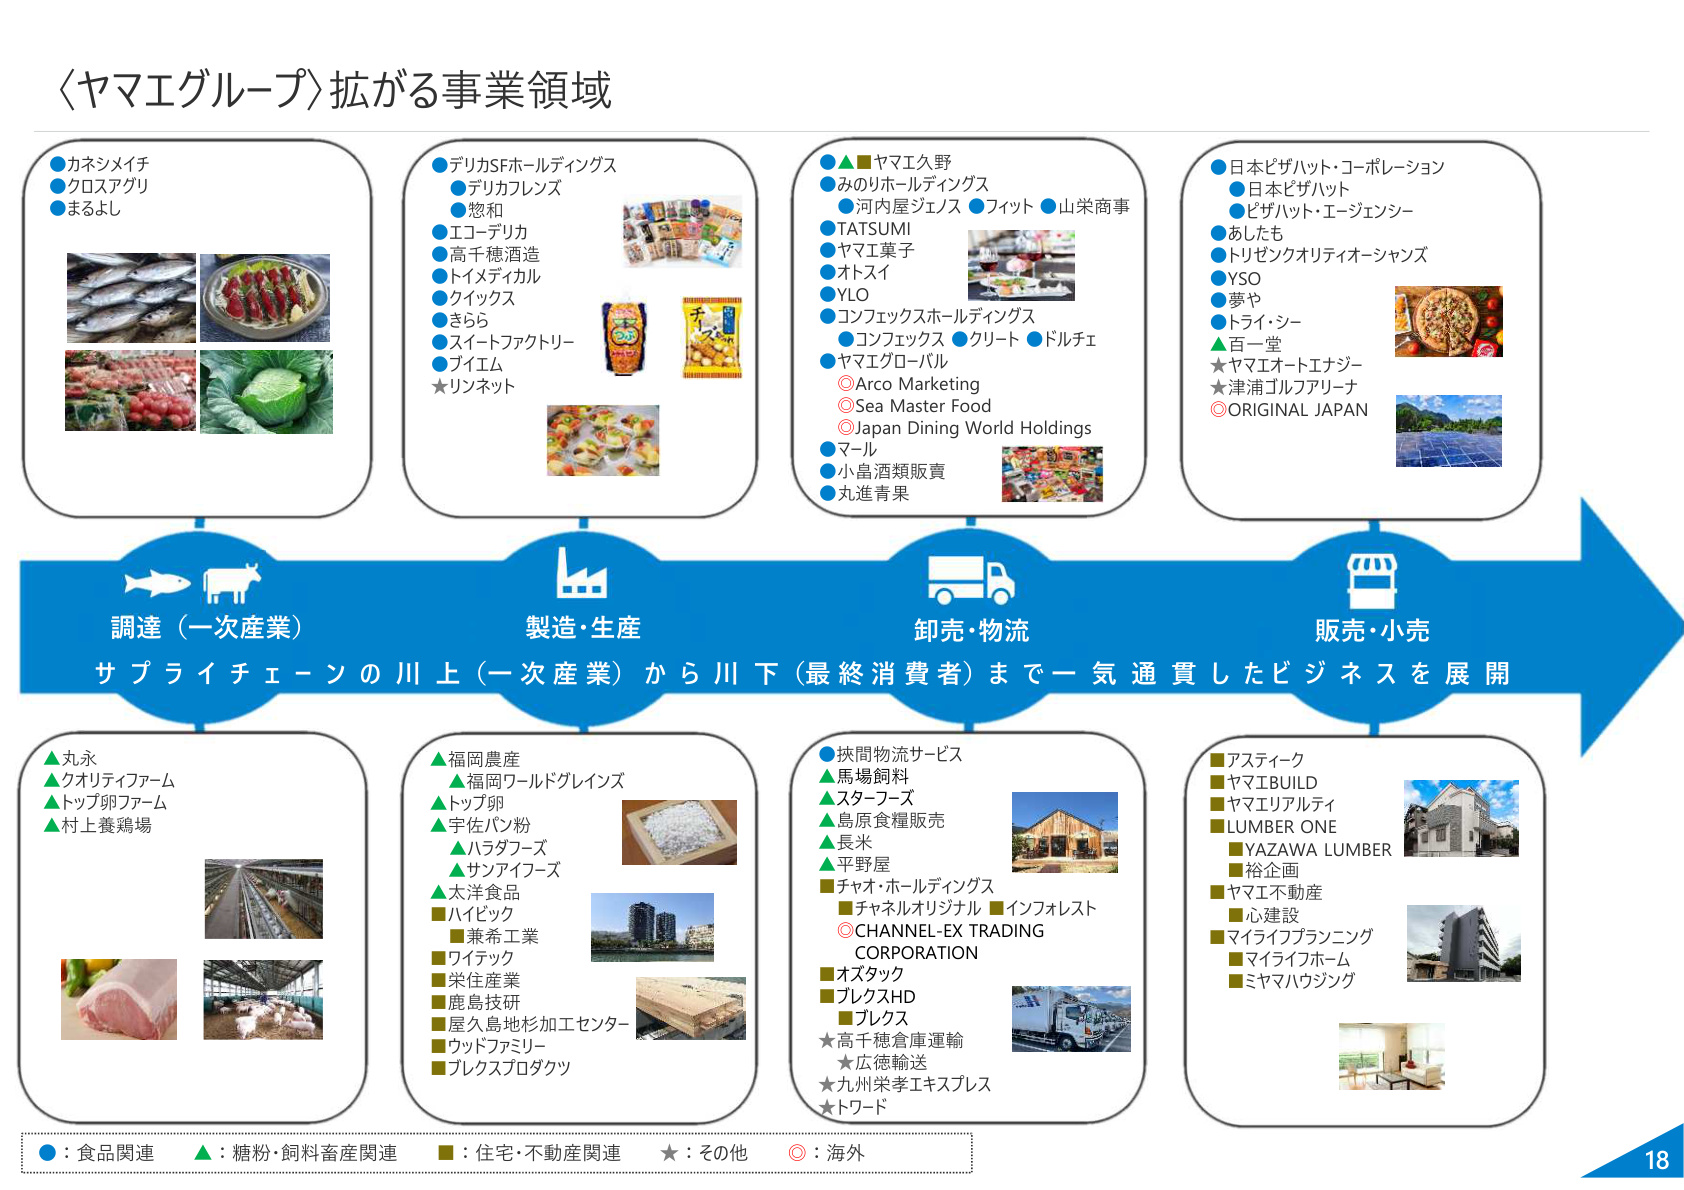
The slide above visualizes Yamae Group's vast business domain and supply chain structure. This diagram is crucial for understanding the reasons behind Yamae Group's sustainable growth.
The group has built an end-to-end network from upstream to downstream , starting with procurement (primary industry: pig farming, poultry farming, agriculture) , moving through manufacturing/production (side dishes, breadcrumbs, sake, housing materials) , wholesale/logistics (food wholesale, temperature-controlled transport, 3PL) , and finally sales/retail (CVS franchises, Pizza Hut, detached housing) .
With approximately 310 locations and 85 consolidated subsidiaries, the group has established a complex business ecosystem that is difficult for competitors to replicate by combining a robust distribution network in the food-related business with M&A in the housing and real estate sectors. Through continued synergy creation via M&A and the optimization of existing businesses, the growth story toward the full-year sales target of ¥1.2 trillion is expected to unfold steadily.
This content is not intended as investment advice or a recommendation. Any opinions expressed are solely the personal views of each article.