


Hirose Electric Q1 FY2026 Earnings Deep Dive: Performance Growth Driven by FA, Automotive, and Communications, Leading to Upward Revision of Full-Year Forecast

StockClub
Published: Aug 05, 2026, 10:19 AM
Sentiment Analysis
Hirose Electric Q1 FY2026 Earnings Deep Dive Report
Connector giant Hirose Electric Co., Ltd. (Securities Code: 6806) has announced its financial results for the first quarter of the fiscal year ending March 2026 (April–June 2026). Driven by revenue growth across all market segments, the company achieved significant year-on-year increases in both net sales and operating profit, marking a strong start to the fiscal year.
This report provides a comprehensive and detailed analysis based on the recently released financial materials, covering the earnings summary, a waterfall analysis of key profit drivers, segment-specific trends, the revised full-year forecast, and updates on shareholder returns and capital expenditure.
1. Q1 FY2026 Earnings Summary
Hirose Electric’s performance in the first quarter showed substantial year-on-year growth in both sales and profit . Despite persistent pressure from material costs, the recovery in demand and increased volume in core sectors have bolstered profitability.
【Q1 Key Financial Highlights】
- Orders Received : ¥71.06 billion (+36.6% YoY / +12.4% QoQ)
- Net Sales : ¥62.08 billion (+26.8% YoY / +13.5% QoQ)
- Operating Profit : ¥13.34 billion (+35.6% YoY / +27.1% QoQ)
- Operating Profit Margin : 21.5% (+1.4pt YoY / +2.3pt QoQ)
- Profit Before Tax : ¥14.47 billion (+41.3% YoY)
- Quarterly Profit : ¥7.33 billion (+1.4% YoY)
Orders exceeding ¥70 billion and outpacing net sales suggest robust underlying demand for the future.
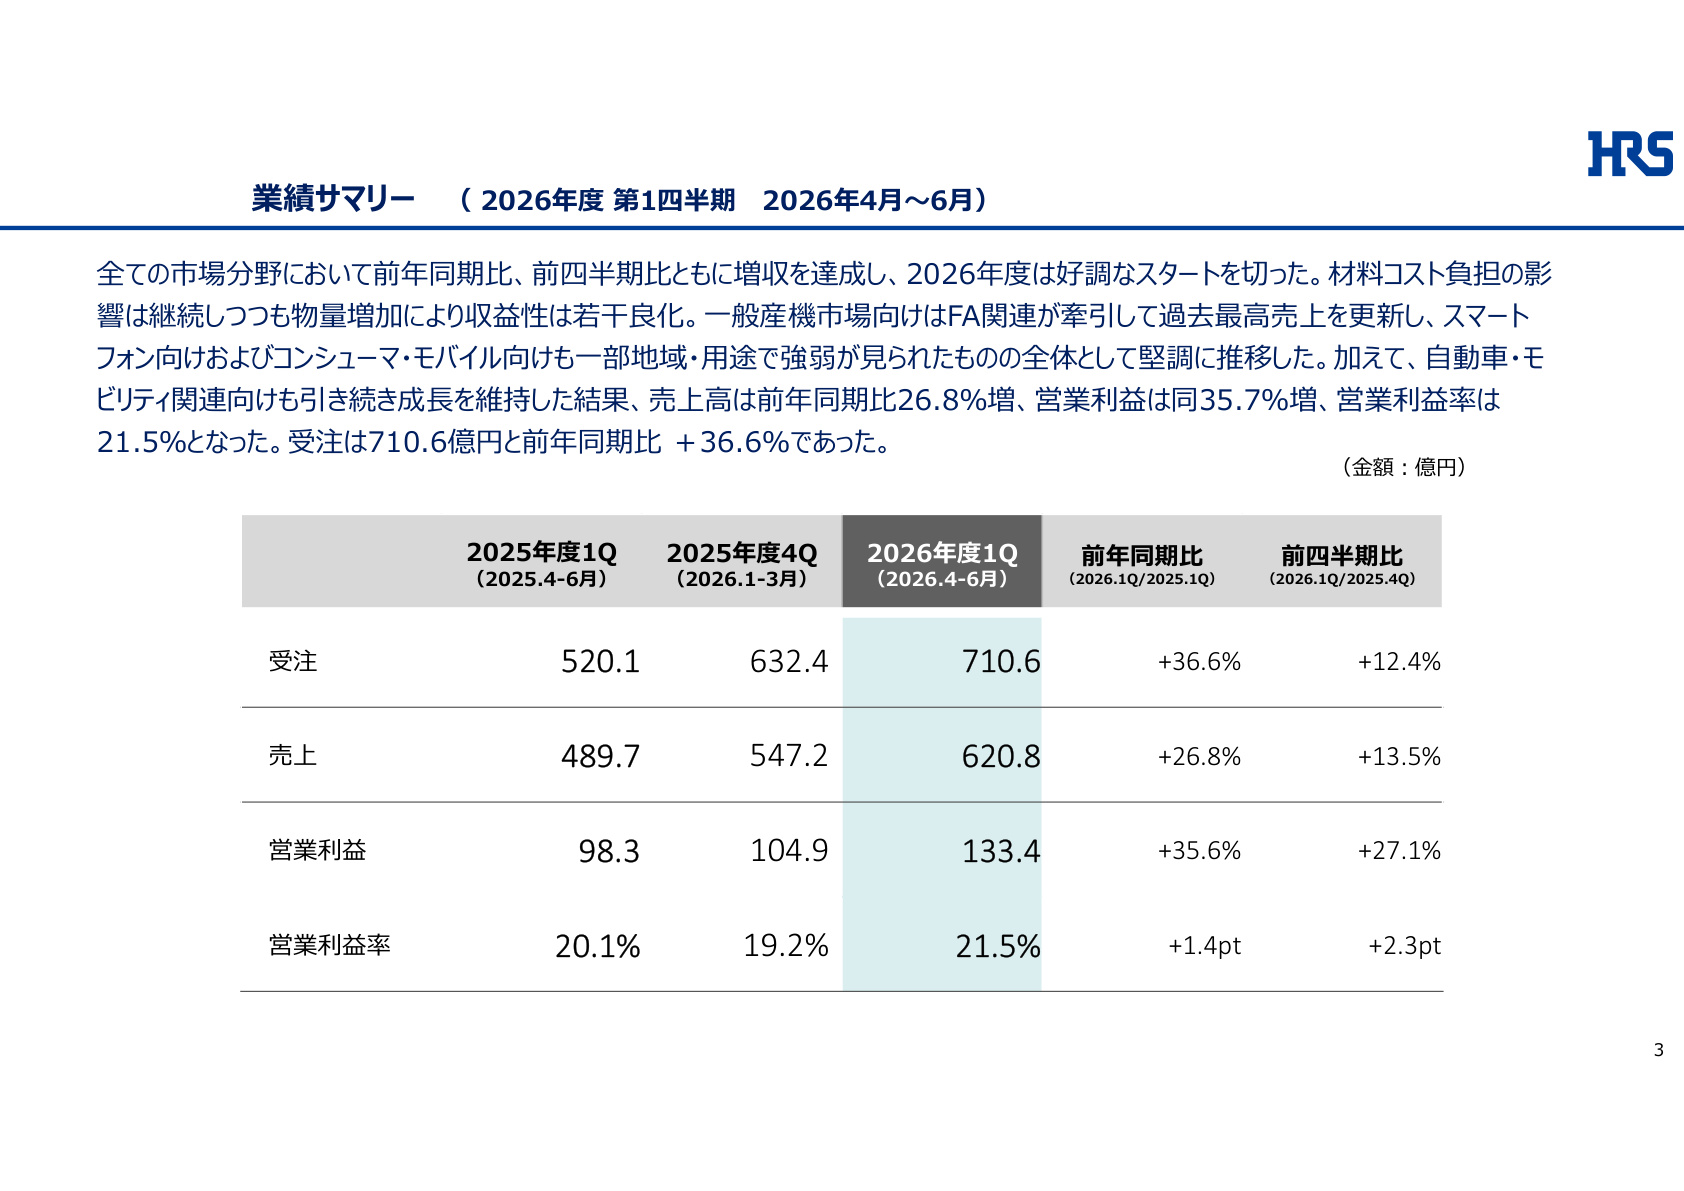
Slide Commentary: Importance of the Earnings Summary
The slide (PAGE 2) above presents critical data symbolizing the strong start to the current fiscal year. All key metrics—orders, sales, operating profit, and operating profit margin—show positive growth compared to both the same period last year (Q1 FY2025) and the previous quarter (Q4 FY2025). Notably, orders reaching ¥71.06 billion (+36.6% YoY) highlight a powerful recovery in demand, particularly in industrial machinery (FA) and automotive sectors. Furthermore, the operating profit margin has rebounded to 21.5% from 19.2% in the previous quarter, confirming a structure where increased capacity utilization, driven by larger sales volume, is boosting profitability.
2. Analysis of Operating Profit Variance (YoY)
Operating profit expanded from ¥9.83 billion in the same period last year to ¥13.34 billion (+¥3.51 billion increase) . The structure shows that volume growth and foreign exchange effects have successfully offset rising costs.
【Breakdown of Key Operating Profit Variance (YoY)】
- Positive Impact from Volume Growth: +¥5.5 billion
- Increased shipments for factory automation (FA), automotive, and AI server applications strongly drove profit.
- Positive Impact from FX: +¥1.8 billion
- The depreciation of the yen (1 USD = ¥159.49, 1 EUR = ¥185.39) acted as a tailwind.
- Positive Impact from Price Optimization: +¥0.7 billion
- The effects of price revisions to reflect rising material costs are now materializing.
- Increase in Material/Procurement Costs (Negative Factor): -¥2.5 billion
- Rising raw material and procurement costs acted as a drag on profit.
- Increase in Personnel Expenses (Negative Factor): -¥1.4 billion
- Higher labor costs due to base pay increases and additional hiring.
- Increase in Depreciation and Other Expenses (Negative Factor): -¥0.6 billion (Depreciation -¥0.3 billion, Others -¥0.3 billion)
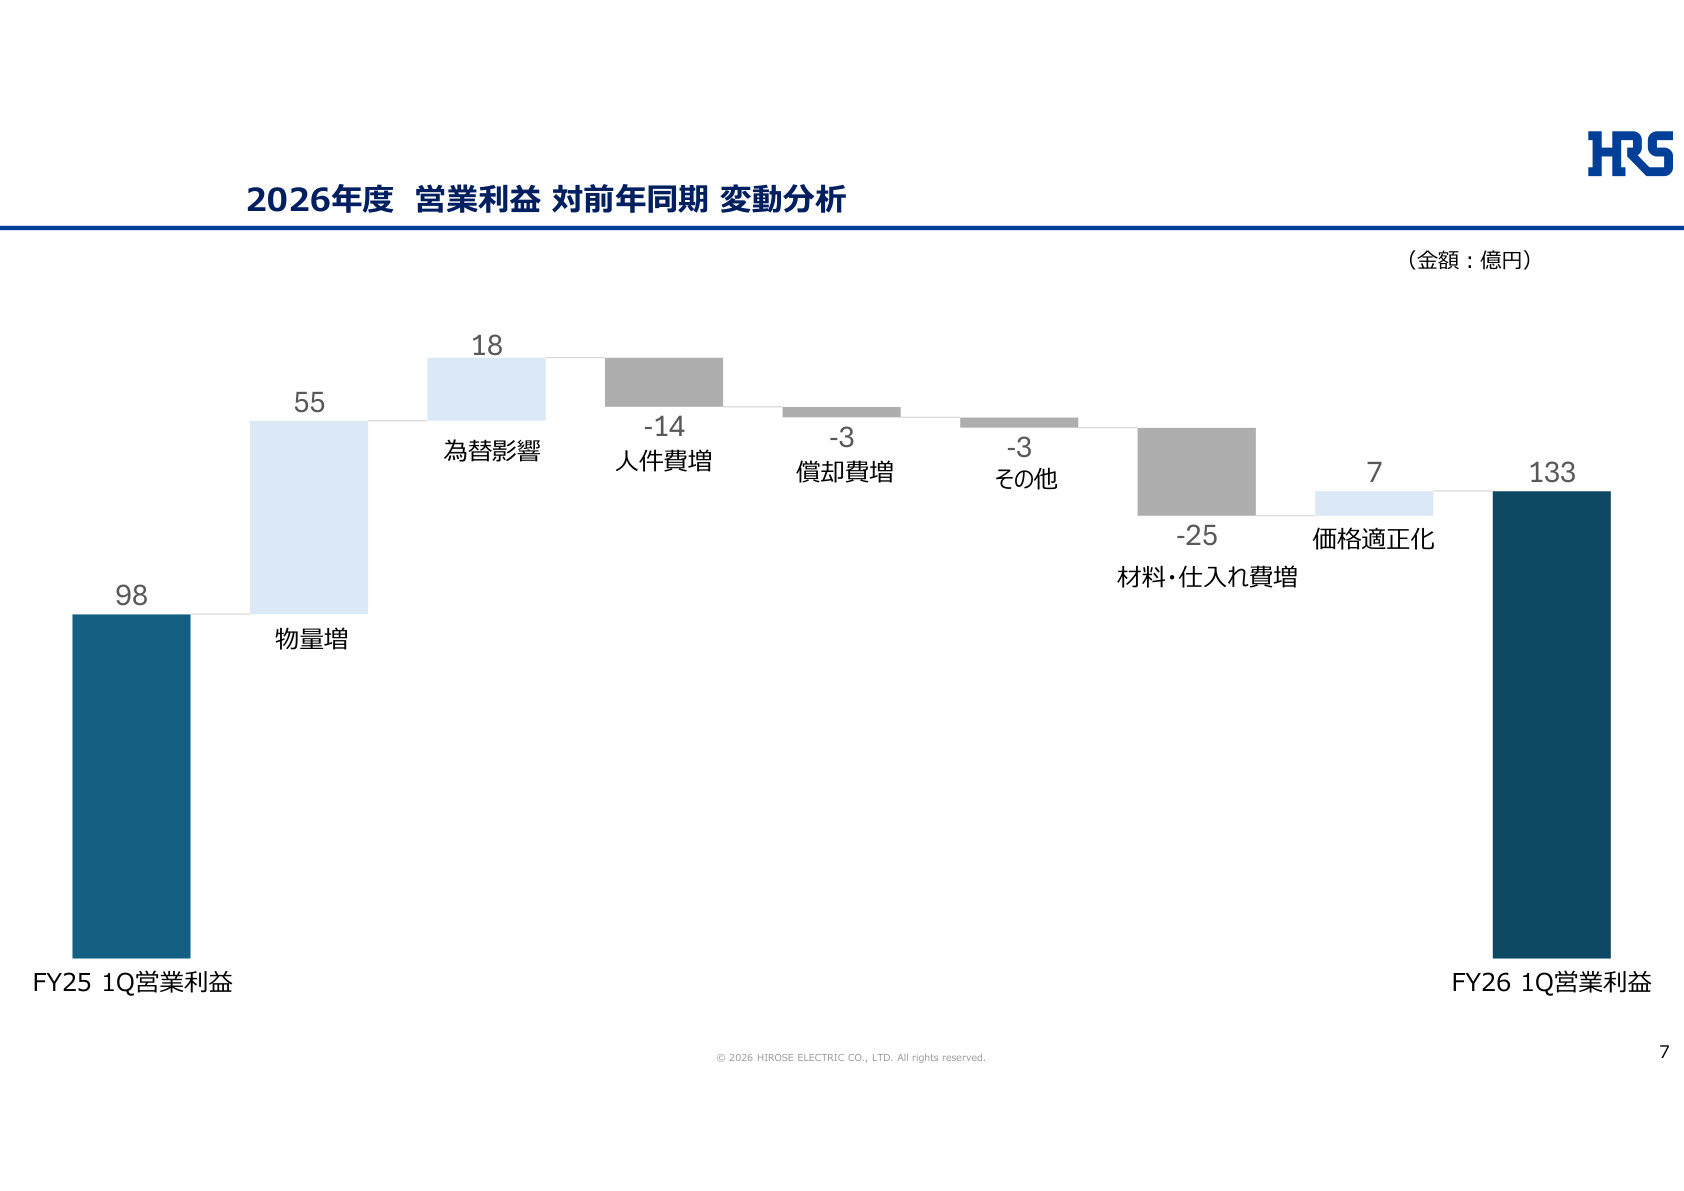
Slide Commentary: Importance of Operating Profit Variance Analysis
The waterfall chart on slide (PAGE 6) clearly illustrates Hirose Electric’s current profit structure. While cost pressures exist—specifically in material/procurement costs (-¥2.5 billion) and personnel expenses (-¥1.4 billion)—the key takeaway is the volume growth effect (+¥5.5 billion) , which significantly outweighs these costs. Combined with proactive price optimization (+¥0.7 billion) and favorable FX tailwinds (+¥1.8 billion), the company is successfully maintaining and expanding its high profit levels.
3. Sales Trends by Sector: Detailed Market Analysis
Growth in the FA-related and AI/mobility-related sectors stands out in the market-specific sales trends.
① General Industrial Machinery (Sales: ¥20.6 billion / +46% YoY / 33% of total sales)
- Topics : Driven by a strong recovery and growth in FA (Factory Automation) , sales reached ¥20.6 billion, significantly exceeding the previous record of ¥18.0 billion.
- Background : Resumption of automation and labor-saving investments in the manufacturing sector, along with increased demand for connectors used in semiconductor manufacturing equipment and robots.
② Automotive & Mobility (Sales: ¥15.6 billion / +22% YoY / 25% of total sales)
- Topics : Quarterly sales surpassed the ¥15 billion mark for the first time , setting a new record.
- Background : Progress in vehicle electrification, adoption of connectors for ADAS (Advanced Driver Assistance Systems) and EVs, and an expanding customer base.
③ Smartphones & Mobile Devices (Sales: ¥10.8 billion / +4% YoY / 17% of total sales)
- Topics : Despite sluggish performance in the Chinese market, steady shipments in other regions maintained year-on-year growth.
④ Consumer & Mobile Equipment (Sales: ¥9.5 billion / +10% YoY / 15% of total sales)
- Topics : Boosted by an increase in connectors for edge AI-related devices and the development of new customers and applications.
⑤ Communication Infrastructure Equipment (Sales: ¥2.5 billion / +92% YoY / 4% of total sales)
- Topics : Although the share of total sales remains small, it achieved near-doubling growth year-on-year.
- Background : The steady expansion of AI server-related demand is the primary growth driver.
⑥ Non-Connector "Hirose SER" (Sales: ¥1.1 billion / +57% YoY / 2% of total sales)
- Topics : Hirose SER, a new business area, is progressing as planned, with capital investment and production increases underway to meet the full-year target of ¥6.0 billion.
4. Upward Revision of FY2026 Full-Year Forecast
Following better-than-expected performance in the general industrial machinery sector during Q1, Hirose Electric has announced an upward revision to its consolidated full-year earnings forecast for FY2026 .
【Revisions to Full-Year Consolidated Forecast】
- Net Sales : Previous forecast ¥230.0 billion → Revised forecast ¥250.0 billion (+18.3% YoY, +¥20.0 billion increase)
- Operating Profit : Previous forecast ¥46.0 billion → Revised forecast ¥50.0 billion (+16.3% YoY, +¥4.0 billion increase)
- Operating Profit Margin Forecast: 20.0% (20.4% expected for the first half)
- Profit Before Tax : Previous forecast ¥48.0 billion → Revised forecast ¥53.0 billion (+13.7% YoY, +¥5.0 billion increase)
- Net Profit : Previous forecast ¥34.0 billion → Revised forecast ¥35.0 billion (+5.6% YoY, +¥1.0 billion increase)
- Earnings Per Share (EPS) : ¥1,039.08 → ¥1,069.63
- Assumed Exchange Rates : 1 USD = ¥155.00 , 1 EUR = ¥180.00
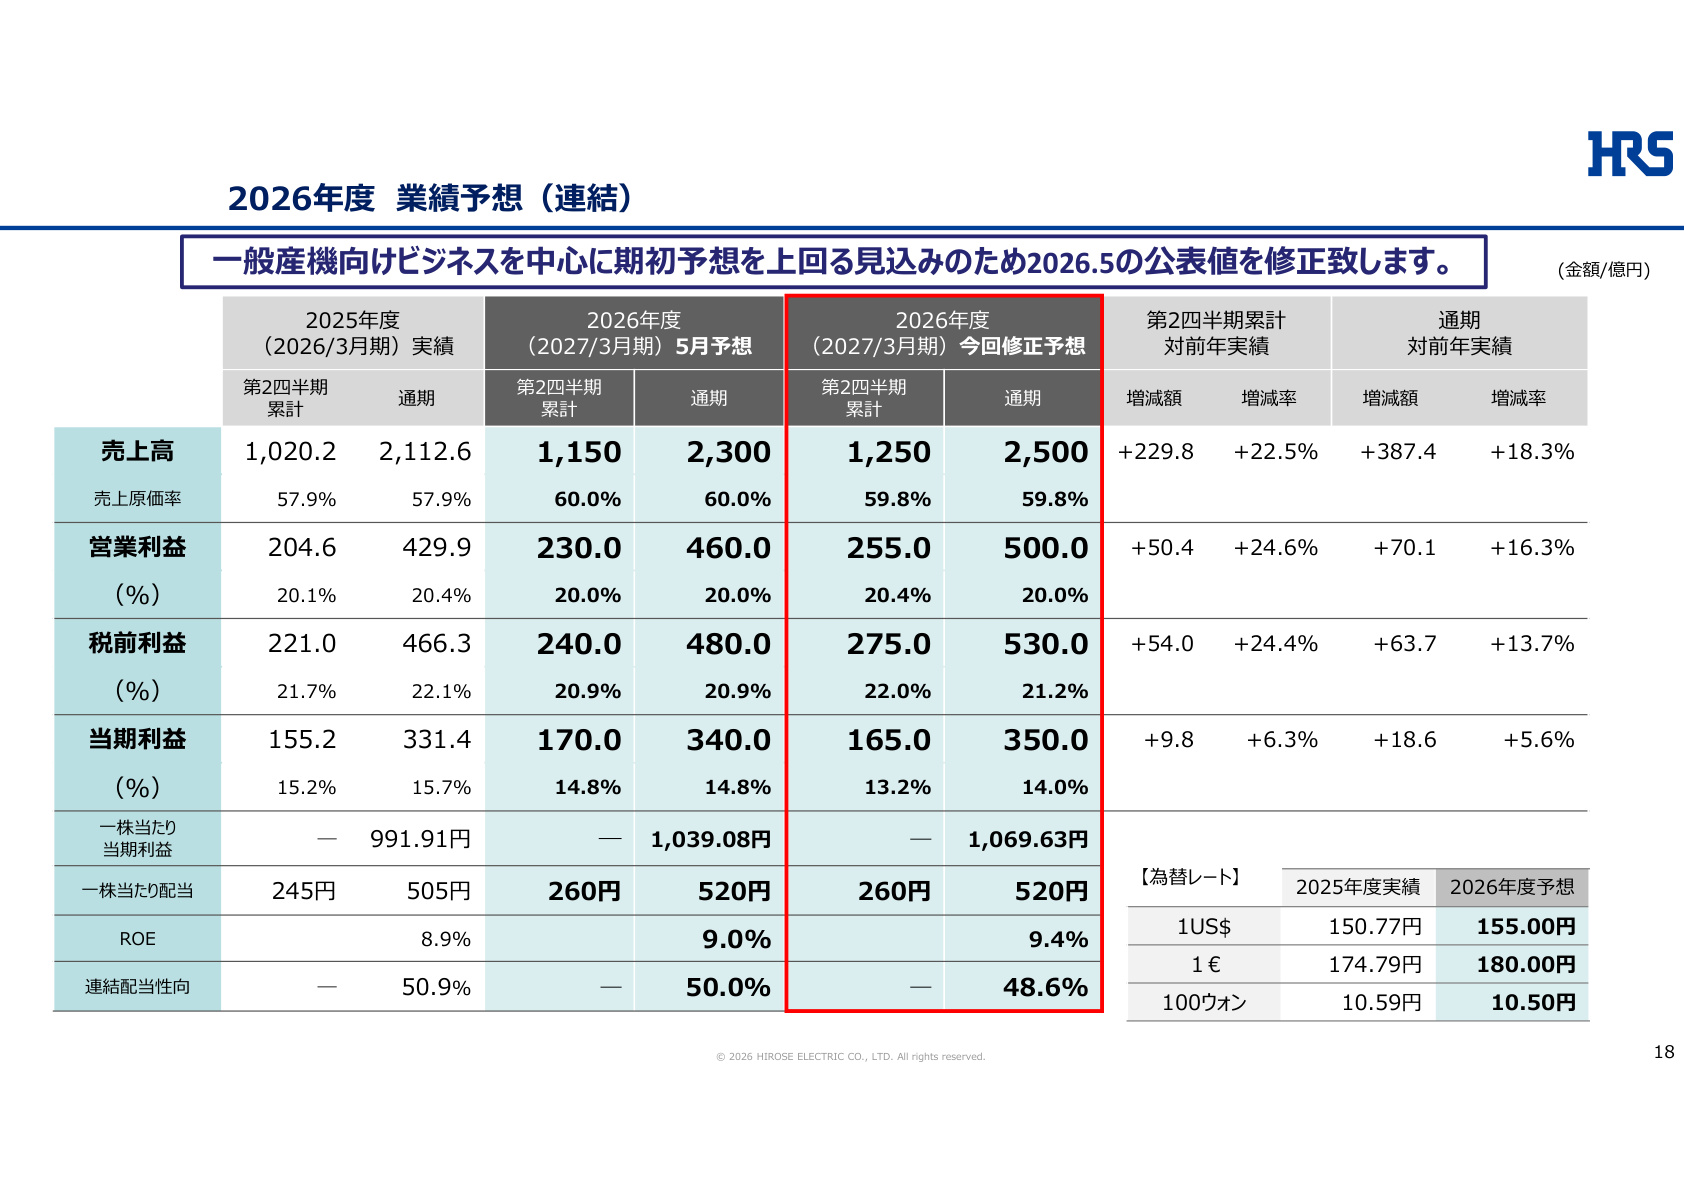
Slide Commentary: Importance of Consolidated Earnings Revision
Slide (PAGE 17) is the most important slide supporting Hirose Electric’s full-year growth story. It emphasizes a significant upward revision of ¥20 billion in net sales and ¥4 billion in operating profit compared to the initial forecast (as of May). The plan to maintain an operating profit margin of 20.0% or higher throughout the year, with targets of ¥250 billion in sales and ¥50 billion in operating profit, highlights the company’s confidence in its product competitiveness and market recovery.
【Revision of Annual Sales Forecast by Market (Change in YoY Growth Forecast)】
- General Industrial Machinery : May forecast +15% → August forecast +34% (Significant upward revision, sales forecast ¥83.0 billion)
- Automotive & Mobility : May forecast +10% → August forecast +16% (Upward revision, sales forecast ¥63.0 billion)
- Communication Infrastructure : May forecast +34% → August forecast +49% (Upward revision, sales forecast ¥10.0 billion)
- Smartphones & Mobile : May forecast -3% → August forecast ±0% (Sales forecast ¥44.5 billion)
- Consumer & Mobile : May forecast -2% → August forecast +4% (Sales forecast ¥36.0 billion)
5. Capital Policy, Shareholder Returns, and Growth Investment
Backed by a solid financial foundation with a high equity ratio of 86.4% , Hirose Electric continues to pursue flexible capital policies and investments for future growth.
① Share Buybacks (Shareholder Returns)
In May 2025, the company established a policy to conduct share buybacks of up to ¥60 billion over four years (FY2025–FY2028) . Based on this, the following buyback framework has been set:
- Number of shares to be acquired : Up to 700,000 shares (2.14% of total shares outstanding, excluding treasury stock)
- Total acquisition cost : Up to ¥15.0 billion
- Acquisition period : August 10, 2026 – November 30, 2026
- Annual Dividend Forecast : Maintained at ¥520 per share (Consolidated payout ratio of 48.6%)
② Strengthening Global Supply Chain (New AMC Logistics Center for Hirose Korea)
To meet the growing global demand, particularly for automotive products, the company announced the construction of a new logistics hub at its Korean subsidiary (Hirose Korea).
- Facility Name : AMC Logistics Center
- Schedule : Construction to begin in September 2026, completion scheduled for December 2027
- Structure/Scale : 8 stories, site area of 6,404.7㎡ (approx. 1,937 tsubo)
- Purpose : To improve receiving/shipping efficiency through automated transport systems and stabilize the supply chain by increasing storage capacity.
6. Conclusion
Hirose Electric’s Q1 FY2026 results achieved record-high quarterly performance, supported by a dramatic recovery in general industrial machinery (FA) and strong demand in the automotive and AI server sectors .
Despite cost-push factors such as rising raw material and personnel expenses, the company successfully absorbed these through volume effects, price optimization, and FX tailwinds, securing a high profit margin of 21.5%. The upward revision of the full-year forecast (¥250 billion in sales, ¥50 billion in operating profit) and the decision for a ¥15 billion share buyback underscore the company’s robust business foundation and proactive stance on shareholder returns.
This content is not intended as investment advice or a recommendation. Any opinions expressed are solely the personal views of each article.