


Kobe Steel FY2026 Q1 Earnings Deep Dive: Navigating External Headwinds and Portfolio Resilience

StockClub
Published: Aug 05, 2026, 10:12 AM
Sentiment Analysis
1. Earnings Overview
Kobe Steel's first quarter (1Q) of FY2026 was marked by significant external challenges, including soaring global raw material costs, extended periodic maintenance at power facilities, and heightened uncertainty stemming from Middle Eastern geopolitical tensions. While the bottom line was hit by a deterioration in metal spreads (the difference between steel product prices and raw material costs) in the Steel segment and a decline in profit in the Power segment, the company maintained its full-year ordinary profit forecast. This resilience was supported by robust demand in aluminum plates, castings and forgings, and engineering, alongside improvements in inventory valuation gains.
2. Performance Highlights and Profit Structure Analysis
First, let us examine the overall performance for 1Q FY2026 and the outlook for the full fiscal year.
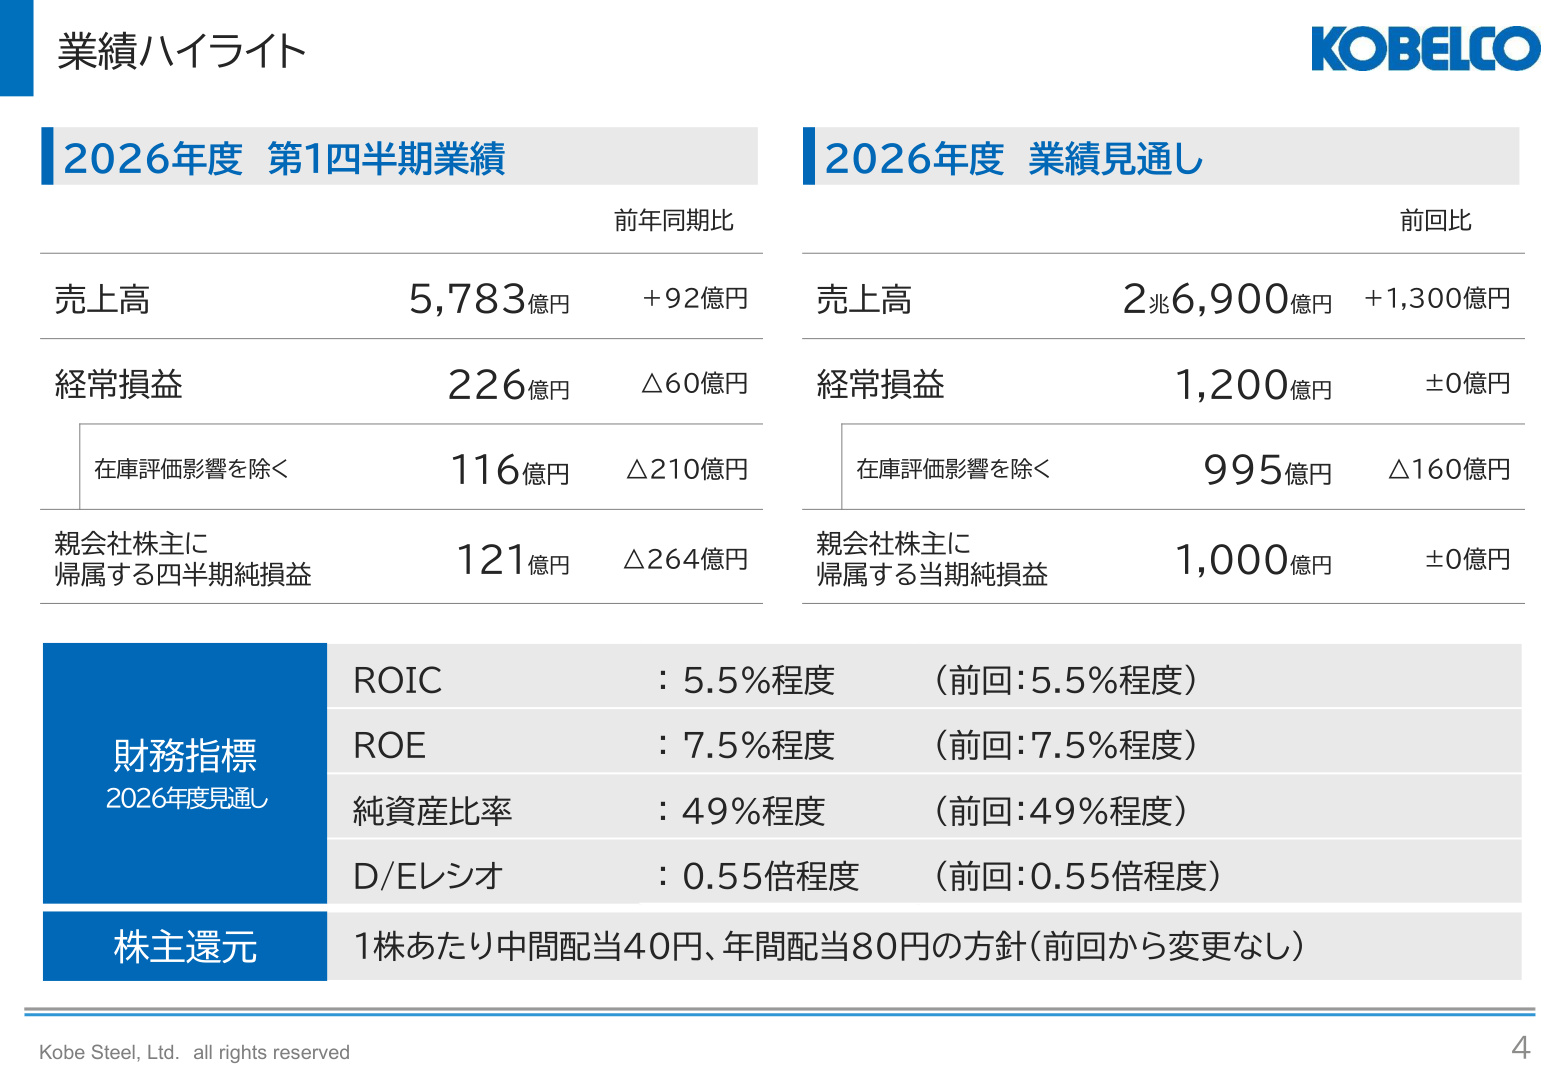
The slide above provides critical data, summarizing the 1Q FY2026 results, the full-year outlook, and key financial indicators.
In 1Q FY2026, net sales reached 578.3 billion yen (up 9.2 billion yen, or +1.6% YoY) . However, ordinary profit fell to 22.6 billion yen (down 6.0 billion yen, or -21.0% YoY) , and net income attributable to owners of the parent dropped to 12.1 billion yen (down 26.4 billion yen, or -68.6% YoY) , resulting in higher sales but lower profits.
The increase in net sales was primarily driven by higher selling prices following the rise in aluminum and copper market prices. Conversely, the profit decline was driven by the aforementioned metal spread compression in the Steel segment and lower earnings in the Power segment. The sharp decline in net income compared to the same period last year is largely attributed to the absence of one-time gains from the sale of cross-shareholdings recorded in the previous year (a decrease of 14.0 billion yen in extraordinary income).
Furthermore, "ordinary profit excluding inventory valuation effects," which reflects the core earning power of the business, stood at only 11.6 billion yen (down 21.0 billion yen YoY), highlighting the intensifying severity of the underlying operating environment excluding market fluctuations.
3. 1Q Ordinary Profit YoY Variance Analysis (Waterfall Chart)
The structural internal factors behind the 6.0 billion yen YoY decline in 1Q ordinary profit are as follows:
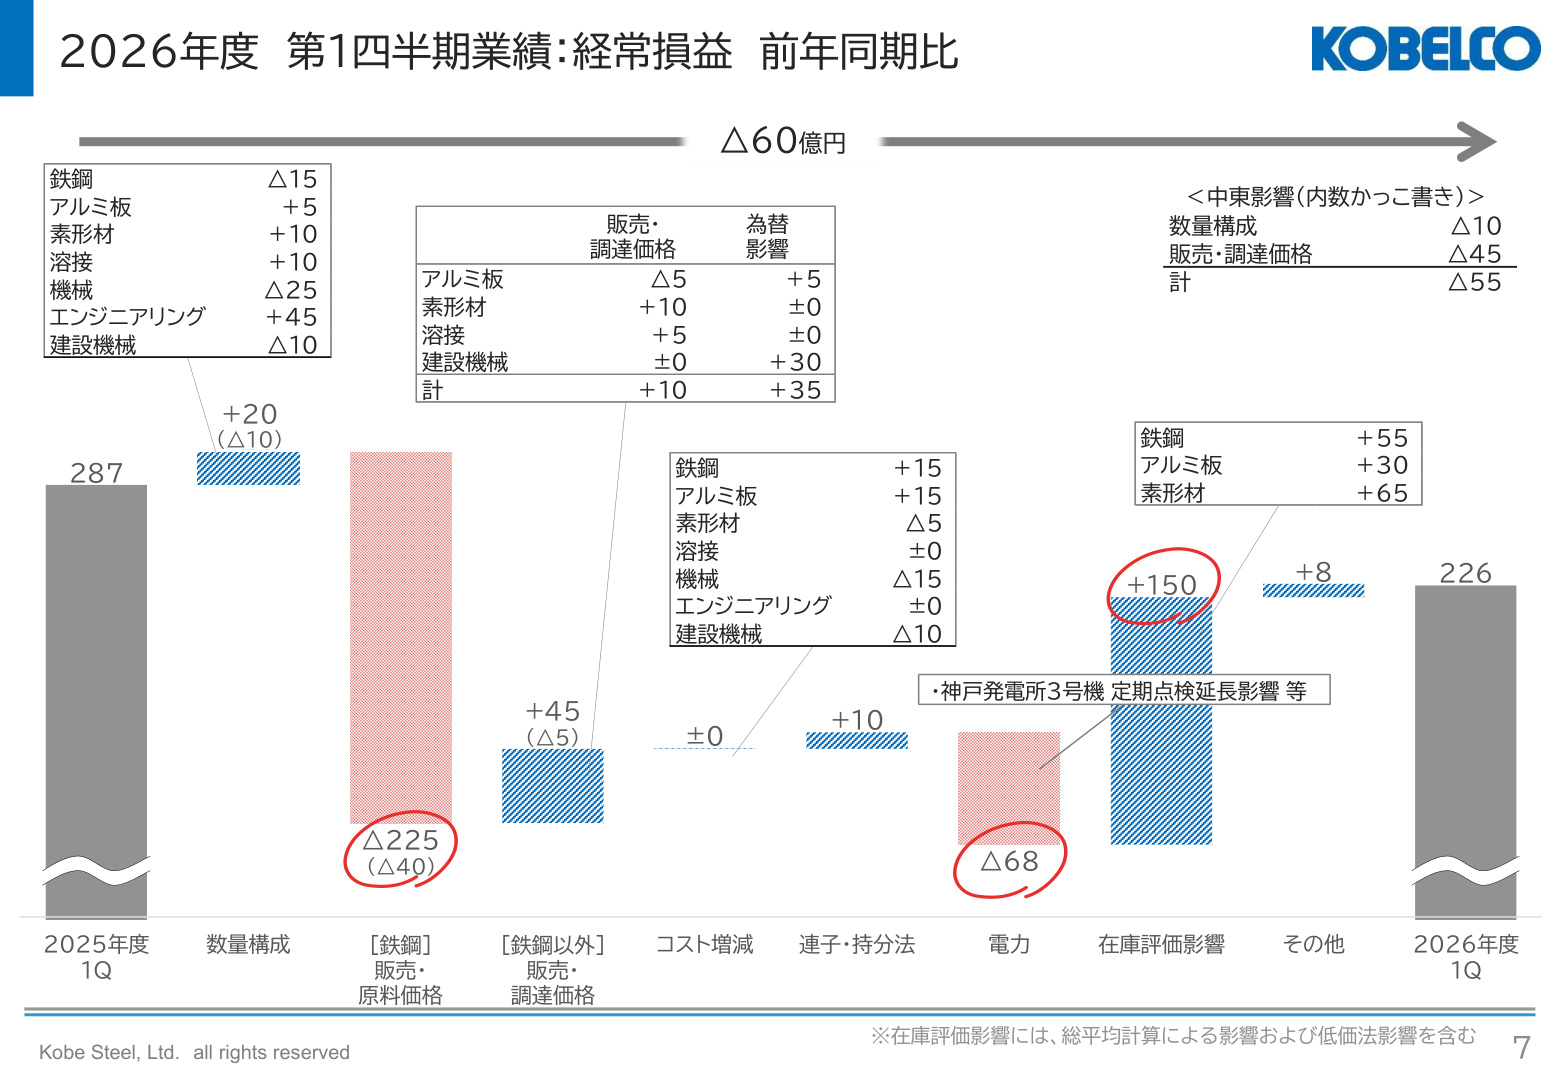
This slide, which visualizes the breakdown of the year-on-year change in ordinary profit, provides significant insights into the company's business structure and the impact of the external environment.
The main factors are broken down as follows:
- Volume/Mix (+2.0 billion yen): Increased sales volumes in Castings and Forgings (+1.0 billion yen), Welding (+1.0 billion yen), and Engineering (+4.5 billion yen) contributed positively, though these were offset by sluggish performance in Machinery (-2.5 billion yen) and Steel (-1.5 billion yen).
- Steel Sales/Raw Material Prices (-22.5 billion yen): The most significant negative factor was the deterioration of metal spreads in the Steel segment. The company was unable to pass on the rising costs of iron ore and hard coking coal to steel product prices due to sluggish demand, leading to a significant compression of profit margins.
- Non-Steel Sales/Procurement Prices (+4.5 billion yen): Progress in price pass-throughs for aluminum plates and castings/forgings, along with the positive impact of the weak yen, contributed to this gain.
- Power Business (-6.8 billion yen): The primary impact was a decrease in electricity sales volume due to the extension of periodic maintenance at the Kobe Power Station Unit 3, as well as the loss of the temporary profit boost from falling coal prices seen in the previous year.
- Inventory Valuation Effects (+15.0 billion yen): Rising aluminum and copper prices led to inventory valuation gains, which significantly covered the decline in core business profits.
4. Segment Performance Details
The detailed trends for each segment in the first quarter are as follows:
- Steel: Ordinary profit was -7.7 billion yen (compared to a 6.0 billion yen profit in the same period last year, a variance of -13.8 billion yen) . While crude steel production (1.47 million tons) and steel product sales (1.14 million tons) remained on par with the previous year, the deterioration in metal spreads due to high raw material costs and lower unit sales prices (133,000 yen/t, down 5,000 yen/t YoY) had a major impact.
- Aluminum Plates: Ordinary profit was 5.4 billion yen (compared to -0.5 billion yen in the same period last year, a variance of +5.9 billion yen) . In addition to a reduction in depreciation expenses following fixed asset impairment, inventory valuation gains (+3.5 billion yen) from rising metal prices drove the profit increase.
- Castings and Forgings: Ordinary profit was 8.1 billion yen (compared to 0 billion yen in the same period last year, a variance of +8.0 billion yen) . Driven by increased investment in data centers, sales of aluminum extrusions and copper plates for semiconductor manufacturing equipment increased, supported by inventory valuation gains (+6.5 billion yen).
- Welding: Ordinary profit was 2.3 billion yen (compared to 0.9 billion yen in the same period last year, a variance of +1.4 billion yen) . A moderate recovery in domestic demand and the weak yen had a positive impact.
- Machinery: Ordinary profit was 6.2 billion yen (compared to 10.5 billion yen in the same period last year, a variance of -4.2 billion yen) . This was affected by a decline in sales of main equipment for the energy and chemical sectors.
- Engineering: Ordinary profit was 6.0 billion yen (compared to 1.1 billion yen in the same period last year, a variance of +4.8 billion yen) . Progress in direct reduced iron-related projects strongly drove performance.
- Construction Machinery: Ordinary profit was 0.9 billion yen (compared to 1.2 billion yen in the same period last year, a variance of -0.2 billion yen) . Despite the weak yen and progress in price pass-throughs, sluggish demand in Europe and Southeast Asia, along with increased material procurement costs, weighed on results.
- Power: Ordinary profit was 1.6 billion yen (compared to 8.5 billion yen in the same period last year, a variance of -6.8 billion yen) . The primary factor was the decline in electricity sales volume due to extended periodic maintenance.
5. FY2026 Full-Year Earnings Outlook Analysis
Next, we examine the revisions to the full-year plan and the background behind them.
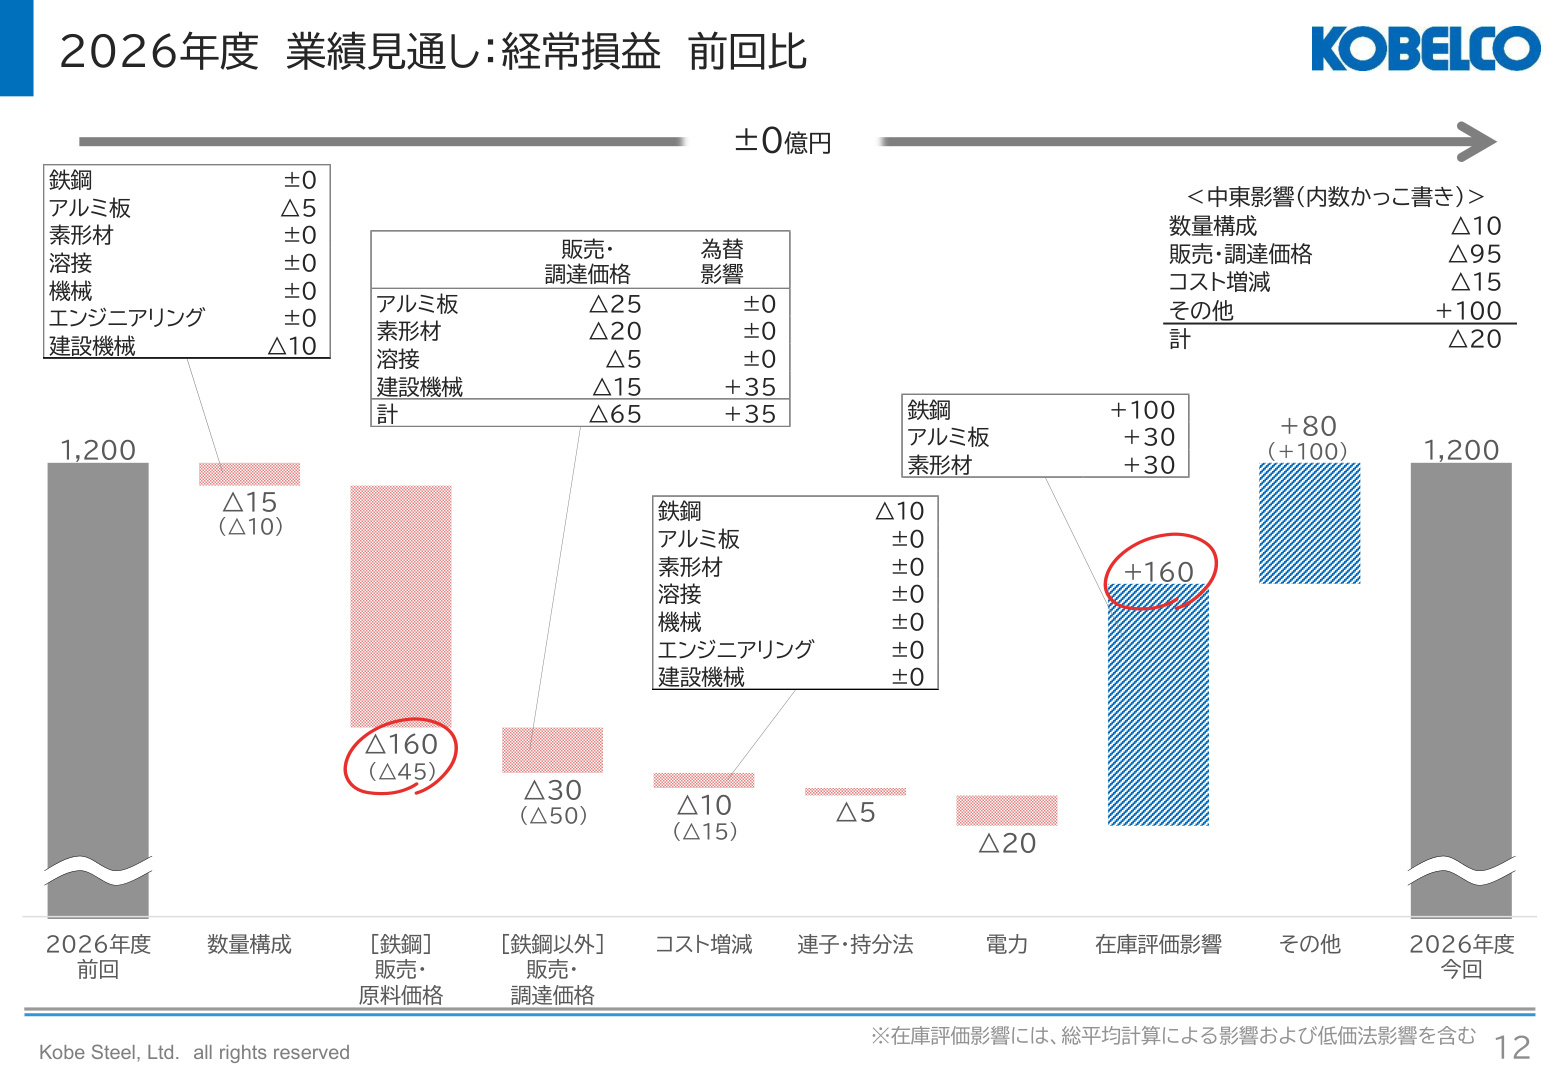
This slide is a key document showing the revisions to the FY2026 full-year earnings outlook compared to the initial plan.
Full-year consolidated net sales have been raised to 2.69 trillion yen (an upward revision of 130 billion yen). This reflects expectations for higher selling prices in the materials and power businesses due to rising raw material prices and the depreciation of the yen.
However, regarding profit items, ordinary profit of 120 billion yen and net income attributable to owners of the parent of 100 billion yen remain unchanged from the previous announcement.
While the 120 billion yen ordinary profit target appears to be on track, its internal structure has shifted:
- Downward Revision in Core Business: Due to soaring oil prices and increased logistics costs (estimated impact of -12.0 billion yen annually) caused by the worsening Middle East situation, and a greater-than-expected deterioration in steel metal spreads, core ordinary profit (excluding inventory valuation) has been revised downward by 16.0 billion yen to 99.5 billion yen (from the previous plan of 115.5 billion yen).
- Offset by Inventory Valuation Gains: This 16.0 billion yen decline in core business profit is being completely offset by an increase in inventory valuation gains (+16.0 billion yen, with a total of 12.0 billion yen expected for the full year) resulting from rising metal market prices.
6. Cash Flow, Financial Position, and Shareholder Returns
Financial and Cash Flow Trends
Financially, the operating cash flow forecast has been reduced to 180 billion yen (down 20 billion yen from the previous forecast). Consequently, free cash flow, after deducting capital expenditures (180 billion yen), has been revised downward to 0 yen (down 10 billion yen).
However, regarding safety indicators, the equity ratio is approximately 49% and the D/E ratio is approximately 0.55x. The company is expected to meet the financial soundness guidelines set out in its medium-term management plan, maintaining a robust balance sheet.
Shareholder Return Policy
The company has clearly stated its policy of maintaining a "dividend payout ratio of approximately 30%" during the medium-term management plan period. In this earnings announcement, the company decided to maintain its initial policy of an interim dividend of 40 yen per share and a year-end dividend of 40 yen, for an annual dividend of 80 yen. Based on the projected full-year net income of 100 billion yen, the payout ratio will be 31.7% , confirming the company's commitment to its return policy.
7. Conclusion and Future Outlook
In FY2026, Kobe Steel is facing a challenging external environment characterized by rising costs due to Middle Eastern tensions, sluggish demand in Chinese and European markets, and compressed steel metal spreads. Nevertheless, its diversified business portfolio—supported by growth in castings and forgings driven by semiconductor and data center demand, as well as progress in engineering projects—is functioning as a buffer for overall performance. Moving forward, the speed of passing on cost increases to selling prices and the stable operation of large-scale infrastructure facilities, such as power plants, will be critical factors in achieving the company's performance targets.
This content is not intended as investment advice or a recommendation. Any opinions expressed are solely the personal views of each article.