


AGC (5201) H1 FY2026 Earnings Deep Dive: Revenue and Profit Growth Driven by Chemicals and Life Sciences, with Strategic Business Progress

StockClub
Published: Aug 05, 2026, 10:11 AM
Sentiment Analysis
AGC Inc. (Ticker: 5201) reported its H1 FY2026 (cumulative 1Q-2Q) financial results , achieving year-on-year growth in both revenue and profit . This performance was driven by the tailwind of a weaker yen, successful price adjustments and increased shipment volumes in core segments, and a significant improvement in the profitability of the Life Sciences business. This report provides a comprehensive analysis of the earnings highlights, segment-specific performance, progress in strategic businesses, full-year outlook, and capital allocation policy.
1. H1 FY2026 Earnings Highlights
The consolidated results for the first half (1Q-2Q) showed a solid performance, with net sales, operating profit, and profit attributable to owners of the parent all exceeding the figures from the same period last year.
Slide Analysis: Overview of H1 Results
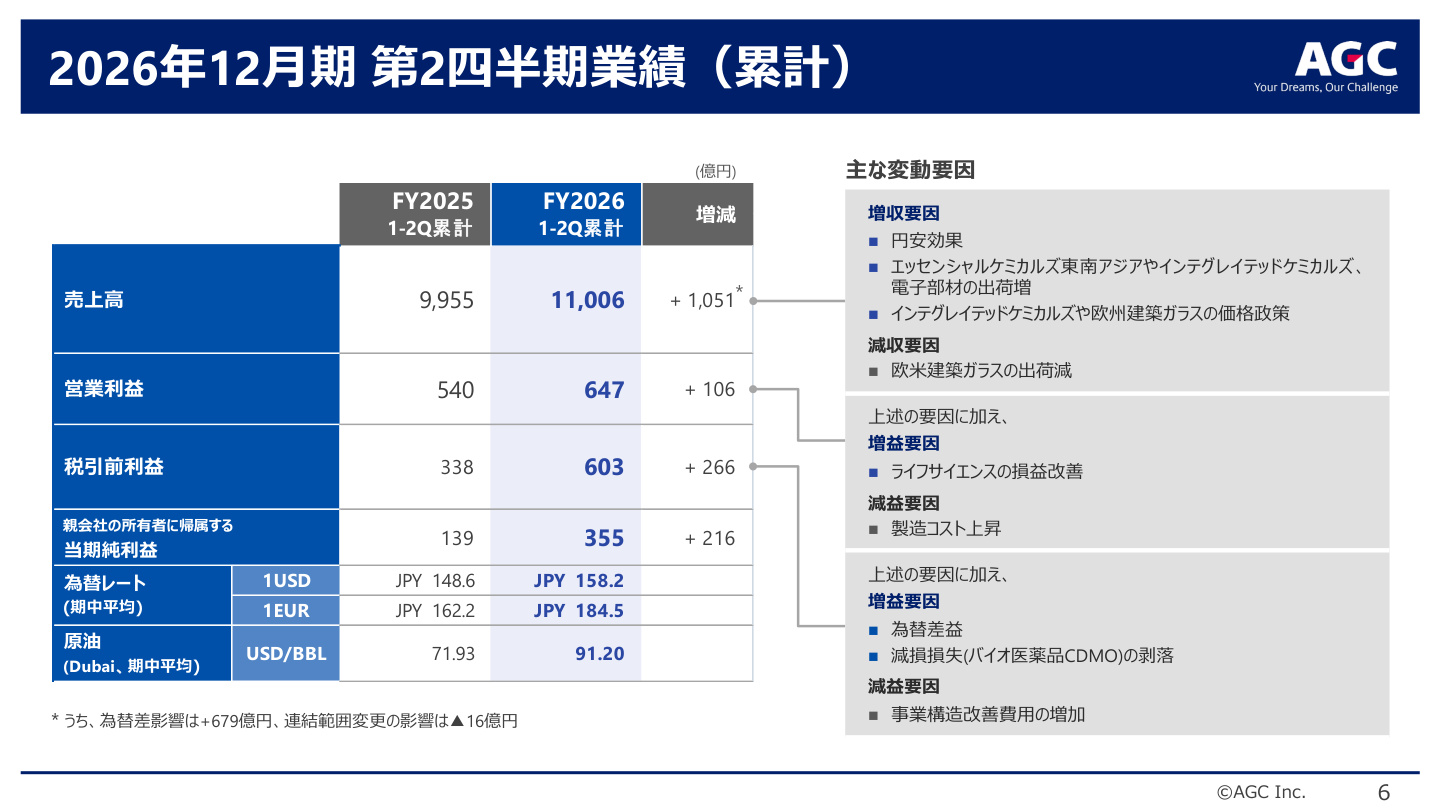
The slide above (P.5) summarizes the overall performance and key financial indicators compared to the same period last year. This data is critical as it illustrates the factors behind the revenue increase (+105.1 billion JPY) and the momentum of the underlying earnings recovery supporting the operating profit growth (+10.6 billion JPY).
- Net Sales : 1,100.6 billion JPY (+105.1 billion JPY, +10.6% YoY)
- Operating Profit : 64.7 billion JPY (+10.6 billion JPY, +19.6% YoY)
- Profit Before Tax : 60.3 billion JPY (+26.6 billion JPY, +78.7% YoY)
- Profit Attributable to Owners of the Parent : 35.5 billion JPY (+21.6 billion JPY, +155.4% YoY)
While net sales include a 67.9 billion JPY positive impact from the weaker yen , even excluding this effect, the company saw significant contributions from increased shipments in Essential Chemicals (Southeast Asia), Integrated Chemicals, and Electronics, as well as price optimization policies in European Architectural Glass and Integrated Chemicals.
2. Analysis of Operating Profit Variance
The increase in operating profit from 54.0 billion JPY to 64.7 billion JPY ( +10.6 billion JPY, +19.6% ) can be broken down into three main factors:
- Sales Volume, Price, and Product Mix (+26.5 billion JPY) : Driven by increased chemical shipments in Southeast Asia, the recovery in electronics materials, and successful price pass-throughs and optimizations across various products.
- Raw Material and Fuel Prices (-4.4 billion JPY) : High costs for energy sources such as crude oil and natural gas continued to exert pressure on margins.
- Costs and Other (-11.4 billion JPY) : Impacted by rising manufacturing costs, particularly in Europe and the US, and increased expenses related to business structural reforms.
The structure of covering rising manufacturing costs caused by inflation and high energy prices through price revisions and volume recovery is clearly evident.
3. Segment Performance Trends
① Architectural Glass Segment
- Net Sales : 229.3 billion JPY (+18.5 billion JPY YoY)
- Operating Profit : 8.8 billion JPY (+5.5 billion JPY YoY)
- Analysis : Despite lower shipments in Japan and falling sales prices in Southeast Asia, price policies in Europe successfully offset the decline in shipments caused by the economic slowdown, translating into profit growth.
② Automotive Segment
- Net Sales : 280.3 billion JPY (+24.6 billion JPY YoY)
- Operating Profit : 13.3 billion JPY (-1.8 billion JPY YoY)
- Analysis : While sales expanded due to increased volumes in Japan, Europe, and North America and an improved product mix (higher ratio of high-value-added glass), inflation-driven manufacturing cost increases in Western markets led to a slight decline in operating profit.
③ Electronics Segment
- Net Sales : 174.4 billion JPY (+6.2 billion JPY YoY)
- Operating Profit : 18.7 billion JPY (-5.7 billion JPY YoY)
- Analysis : Although prices for display glass substrates rose, the segment was impacted by lower shipments of chemically strengthened specialty glass, which is slated for business withdrawal. Conversely, shipments of EUV exposure photomask blanks and optoelectronic materials are showing signs of recovery.
④ Chemicals Segment
- Net Sales : 332.0 billion JPY (+46.2 billion JPY YoY)
- Operating Profit : 28.2 billion JPY (+5.6 billion JPY YoY)
- Analysis : This segment was a strong driver of overall profit growth. Key contributors included increased shipments and higher prices for semiconductor/electronics products in Integrated Chemicals , as well as expanded capacity in Essential Chemicals (Southeast Asia) .
⑤ Life Sciences Segment
- Net Sales : 72.3 billion JPY (+8.8 billion JPY YoY)
- Operating Profit : -6.1 billion JPY (vs. -11.9 billion JPY in the same period last year; an improvement of 5.9 billion JPY)
- Analysis : Although still in the red, the segment achieved a significant improvement in profitability. This was driven by fixed cost reductions following the closure of the Colorado site, increased CDMO contract manufacturing in Copenhagen, and successful productivity enhancement measures.
4. Growth Drivers: Progress in Strategic Businesses
AGC has designated four areas as Strategic Businesses for long-term growth: Mobility, Electronics, Performance Chemicals, and Life Sciences.
Slide Analysis: Growth Momentum in Strategic Businesses
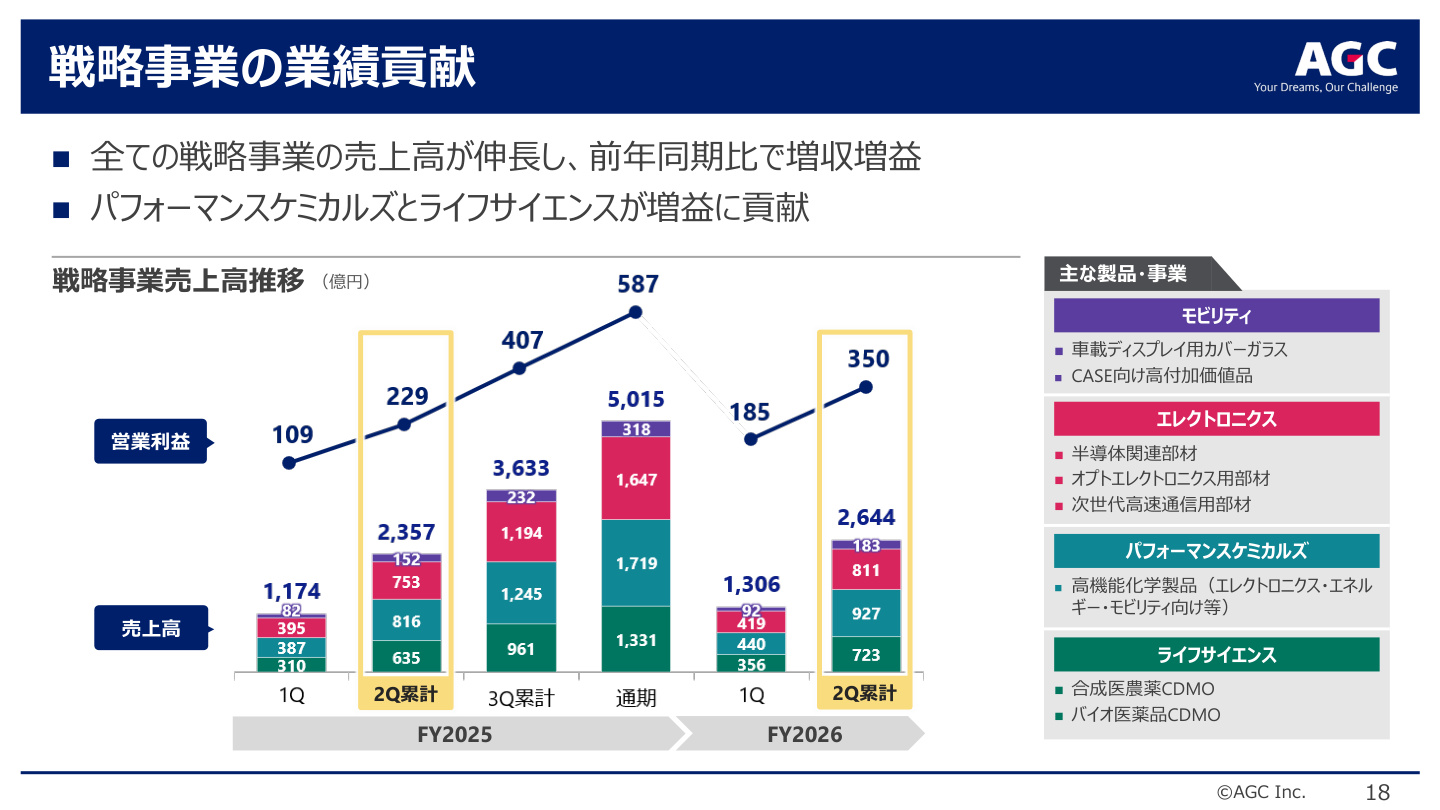
The slide above (P.17) shows the quarterly trends in net sales and operating profit for the strategic businesses. This is significant as it clearly demonstrates the shift away from dependence on traditional core businesses and the progress in portfolio transformation toward high-value-added sectors.
- Strategic Business Net Sales : 264.4 billion JPY (+28.7 billion JPY YoY)
- Strategic Business Operating Profit : 18.3 billion JPY (-4.6 billion JPY YoY, though showing steady growth from 9.2 billion JPY in 1Q to 18.3 billion JPY in H1).
Demand capture for advanced industries —such as fluorinated high-performance chemicals in Performance Chemicals and EUV blanks in Electronics—is progressing well. Combined with the narrowing losses in Life Sciences, the strategic business portfolio is steadily building a foundation for mid-to-long-term earnings.
5. Full-Year Outlook and Management Challenges
AGC has maintained its initial full-year earnings forecast for FY2026.
Slide Analysis: Validity of Full-Year Outlook and Financial Assumptions
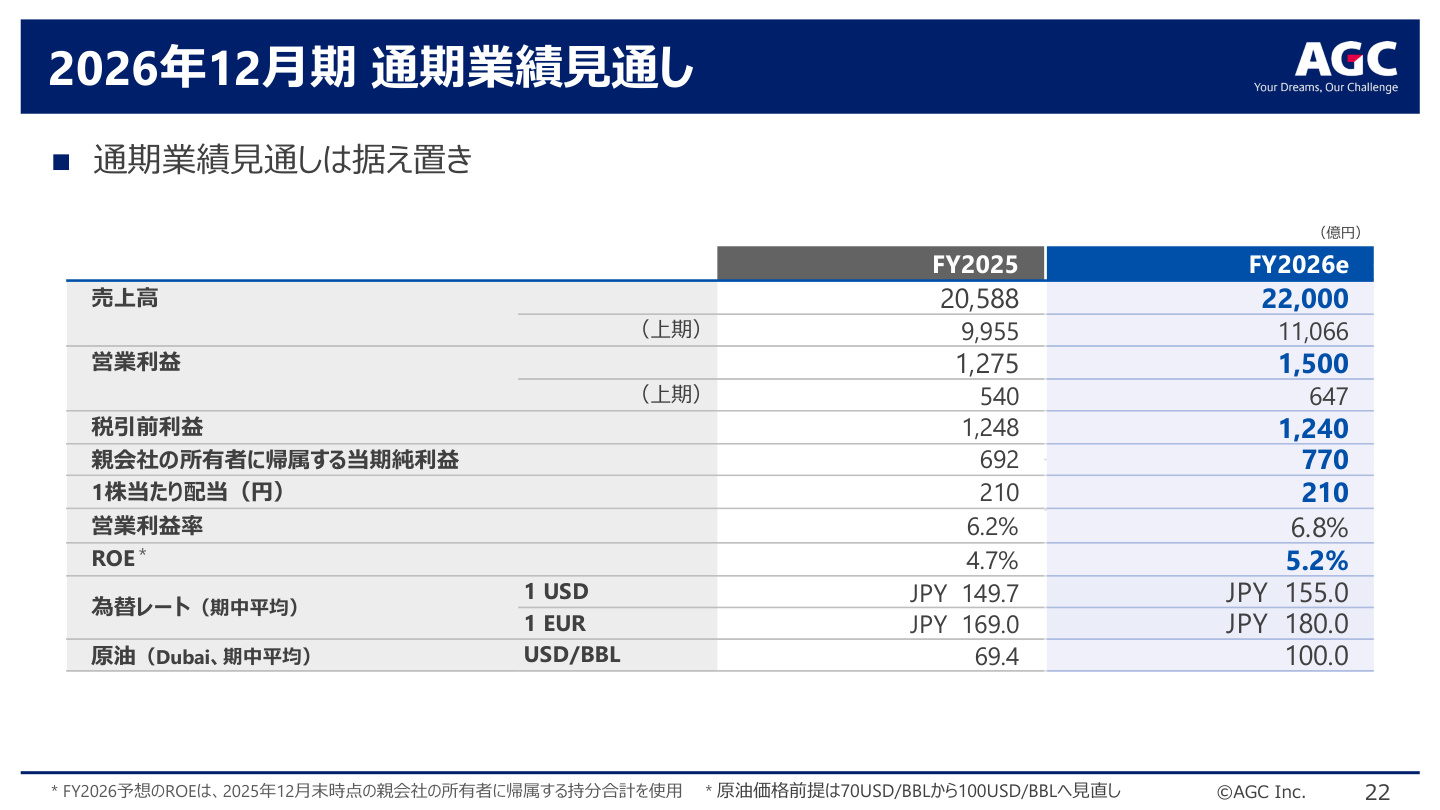
The slide above (P.21) presents the consolidated earnings forecast for FY2026. This data is important because it indicates that the company expects to achieve its full-year targets even after factoring in external risks, such as the upward revision of crude oil price assumptions (100 USD/BBL) and heightened geopolitical tensions in the Middle East.
- Net Sales Forecast : 2,200.0 billion JPY (+141.2 billion JPY, +6.9% YoY)
- Operating Profit Forecast : 150.0 billion JPY (+22.5 billion JPY, +17.6% YoY)
- Net Income Forecast : 77.0 billion JPY (+7.8 billion JPY, +11.3% YoY)
- ROE Forecast : 5.2% (+0.5pt YoY)
- Assumed Exchange Rates : 1 USD = 155.0 JPY, 1 EUR = 180.0 JPY
Response to Middle East Situation and Raw Material Risks
By diversifying procurement sources during the first half, the company has secured a stable supply of necessary raw materials. For increases in crude oil and natural gas costs, AGC continues to implement price adjustments (pass-throughs) , primarily in architectural glass and chemicals, and expects the impact on the full-year results to be minimal .
6. Capital Expenditure Plan and Shareholder Returns
Capex Compression and Cash Flow Optimization
Following the completion of large-scale capacity expansion investments through 2025, AGC has entered a phase of compressing capital expenditures from 2026 onwards .
- FY2025 Capex : 251.3 billion JPY → FY2026 Capex Forecast : 190.0 billion JPY (-61.3 billion JPY reduction)
- FY2026 Depreciation Forecast : 183.0 billion JPY (trending downward due to investment compression)
- FY2026 R&D Expenses : 62.0 billion JPY (maintaining selective investment in advanced fields)
The completion of large-scale investments is expected to improve free cash flow, contributing to a healthier financial position and improved capital efficiency.
Shareholder Return Policy
AGC maintains a policy focused on stable dividends and capital efficiency.
- Annual Dividend Forecast : 210 JPY per share (105 JPY interim, 105 JPY year-end; maintaining the same level as the previous year)
- Return Metric : The basic policy is to provide stable dividends with a target DOE (Dividend on Equity) of approximately 3.0% , with potential future reviews of returns based on earnings recovery.
Conclusion
AGC's H1 FY2026 results were driven by the synergistic effects of a weaker yen, price policies, strong chemical performance, and structural reforms in Life Sciences, resulting in steady revenue and profit growth. Moving forward, while closely monitoring manufacturing cost increases in Western markets and raw material price trends, the acceleration of growth in strategic businesses (EUV blanks, Bio-CDMO, high-performance fluoropolymers, etc.) and the strengthening of the financial structure through investment compression will be key to sustainable corporate value creation.
This content is not intended as investment advice or a recommendation. Any opinions expressed are solely the personal views of each article.