

Astellas Pharma Q1 FY2026 Earnings Deep Dive: Strategic Product Surge and Structural Cost Reform Pave the Way for Record-Breaking Performance

StockClub
Published: Aug 05, 2026, 10:09 AM
Sentiment Analysis
1. Earnings Overview: A Strong Start with Significant Growth in Both Revenue and Profit
Astellas Pharma’s consolidated financial results for the first quarter (1Q) of FY2026 showed remarkable year-on-year growth in both revenue and core operating profit, indicating extremely steady progress toward achieving record-high full-year results .
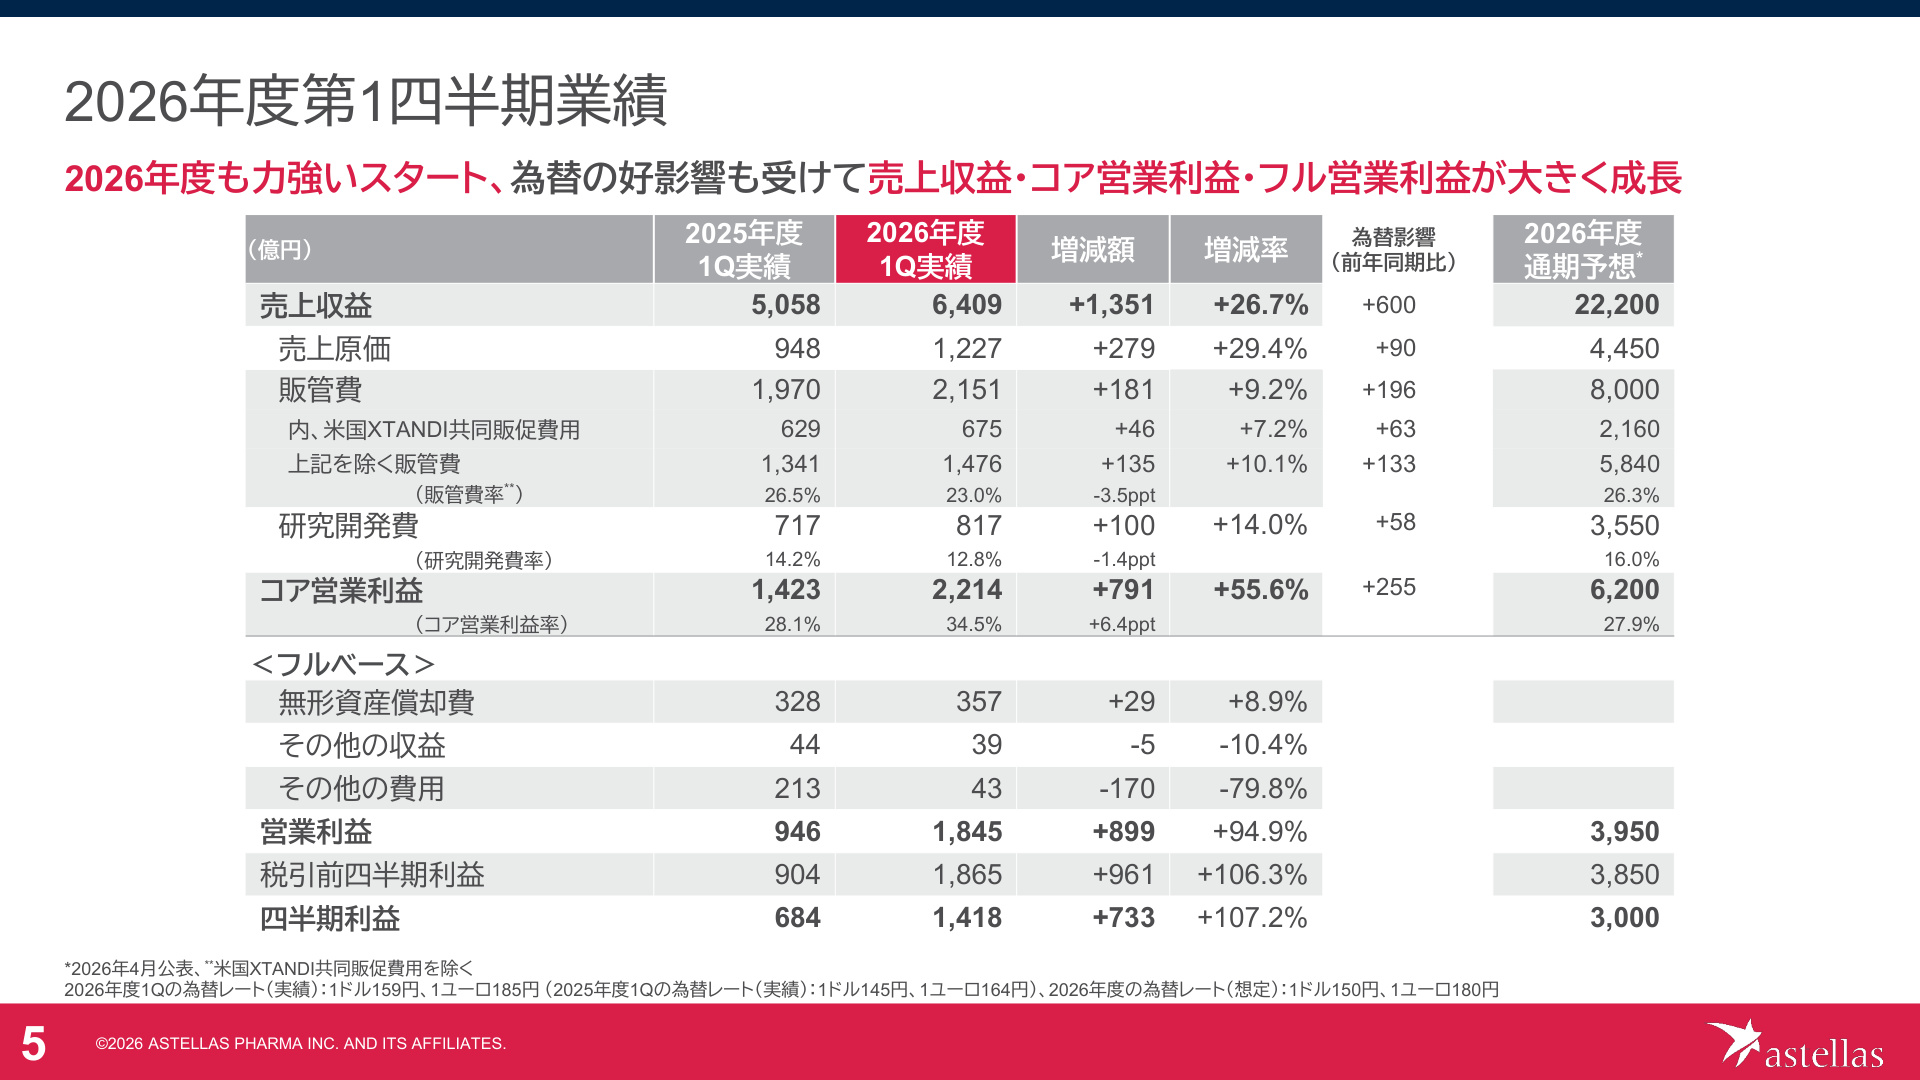
Revenue reached ¥640.9 billion , a +26.7% increase year-on-year (compared to ¥505.8 billion in the same period last year). Core operating profit , the primary driver of earnings growth, surged by +55.6% to ¥221.4 billion (compared to ¥142.3 billion). Consequently, the core operating profit margin rose to 34.5% , an improvement of +6.4 percentage points from the previous year (28.1%), clearly demonstrating not only top-line expansion but also structural improvements in core business profitability.
On a full-basis (IFRS) level, the company also recorded more than double-digit growth, with operating profit rising +94.9% year-on-year to ¥184.5 billion and quarterly profit increasing +107.2% to ¥141.8 billion .
[Slide Commentary: Q1 FY2026 Consolidated Results (P.4)]
This slide provides an overview of the key items in Astellas' income statement for the quarter. Notably, the increase in core operating profit ( +¥79.1 billion ) is substantial relative to the revenue growth ( +¥135.1 billion ), indicating that revenue gains are being efficiently converted into profit. While favorable foreign exchange impacts (yen depreciation against the dollar and euro) contributed +¥60.0 billion to revenue and +¥25.5 billion to core operating profit , the company also demonstrated strong growth on a Constant Exchange Rate (CER) basis, with revenue up +14.8% and core operating profit up +37.7% year-on-year. The 1Q progress rate against the full-year forecast (Revenue: ¥2.22 trillion, Core Operating Profit: ¥620 billion) stands at 28.9% for revenue and 35.7% for core operating profit, visually and numerically confirming a strong start.
2. Product Sales Trends: Growth Momentum Driven by Strategic Products
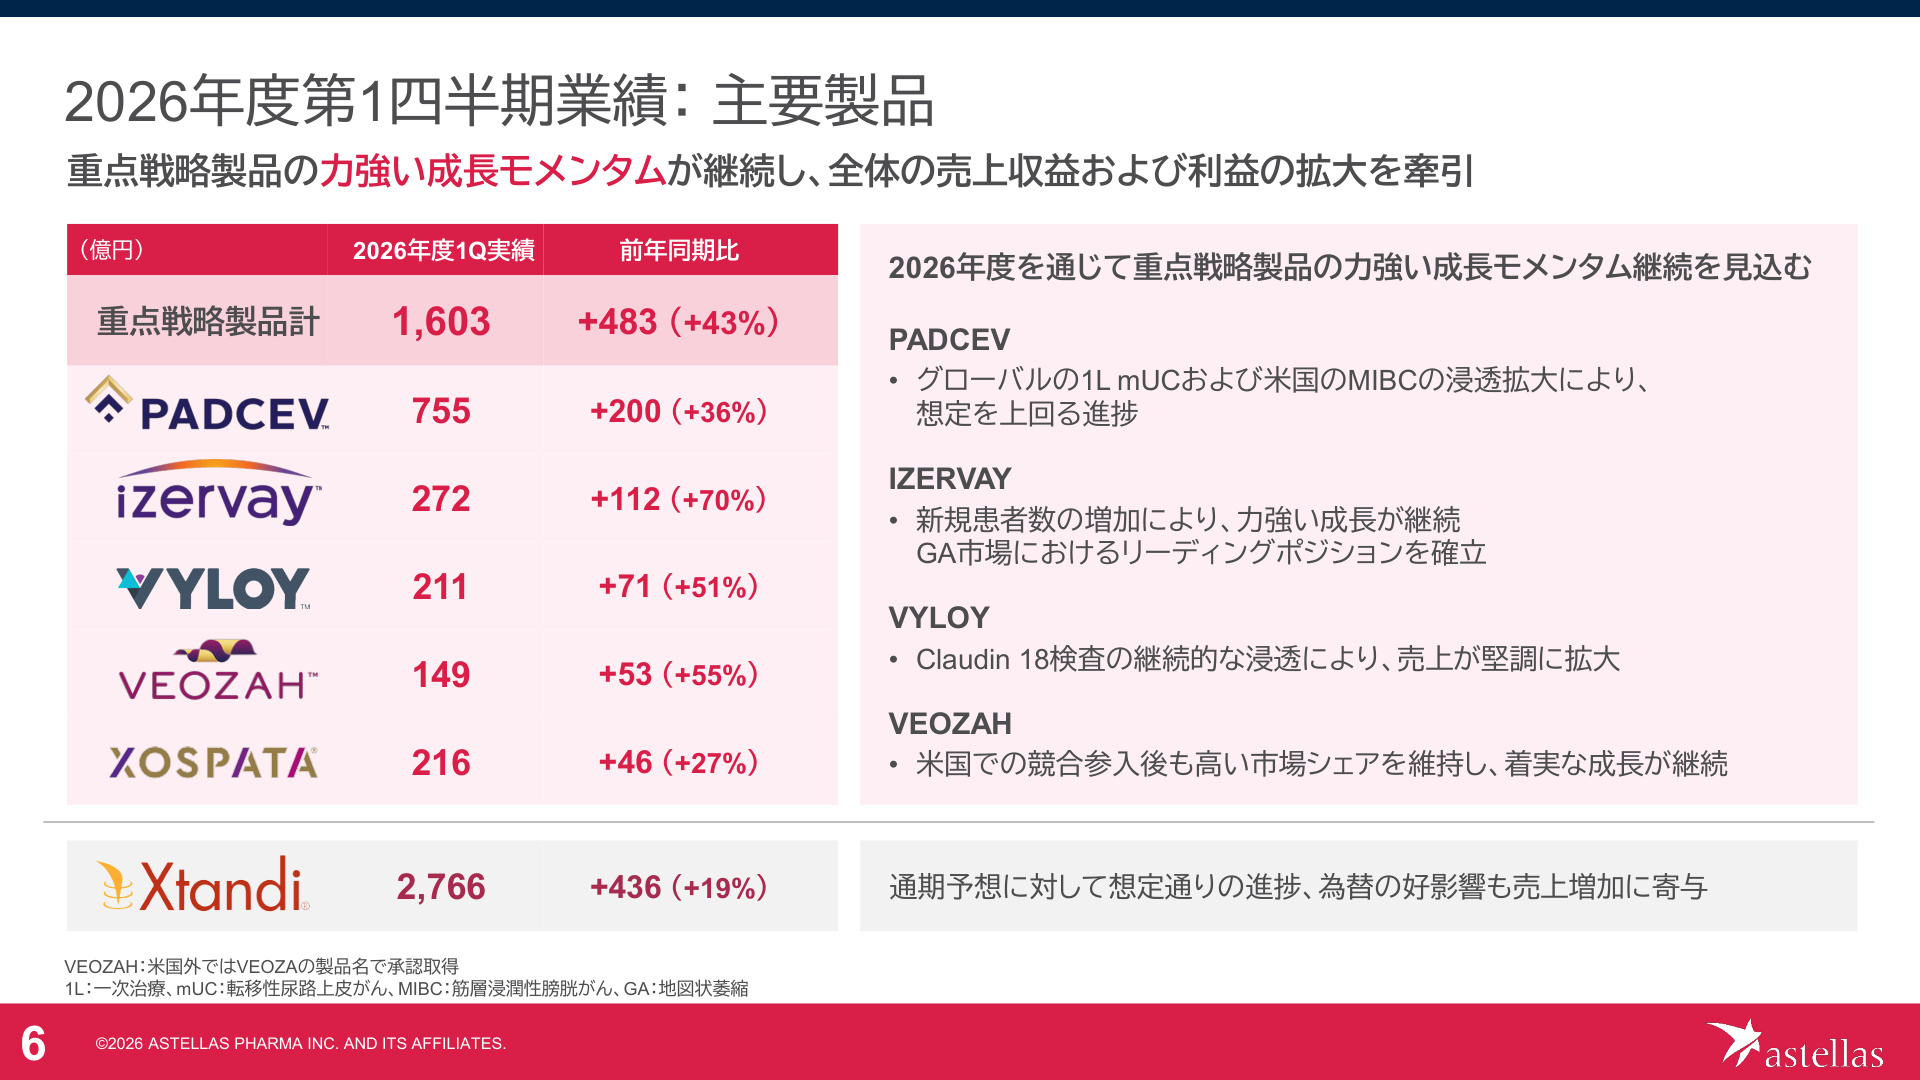
The primary factor accelerating the company's growth is the rapid expansion of its Strategic Products (PADCEV, izervay, VYLOY, VEOZAH, and XOSPATA) . Total 1Q sales for these strategic products surged by +43% year-on-year to ¥160.3 billion (an increase of ¥48.3 billion).
Individual performance trends for key products are as follows:
- PADCEV (generic name: enfortumab vedotin) : 1Q sales rose +36% year-on-year to ¥75.5 billion . Growth is outpacing company expectations, driven by the global penetration of combination therapies for first-line metastatic urothelial cancer (1L mUC) and the expansion of indications for muscle-invasive bladder cancer (MIBC) in the U.S.
- izervay (generic name: avacincaptad pegol) : 1Q sales increased +70% year-on-year to ¥27.2 billion . As a treatment for geographic atrophy (GA) secondary to age-related macular degeneration, the drug is successfully acquiring new patients and solidifying its leadership position in the market.
- VYLOY (zolbetuximab) : 1Q sales grew +51% year-on-year to ¥21.1 billion . As a treatment for Claudin 18.2-positive gastric cancer, it is on a stable growth trajectory as diagnostic testing becomes more widespread.
- VEOZAH (fezolinetant) : 1Q sales rose +55% year-on-year to ¥14.9 billion . This treatment for vasomotor symptoms (VMS) associated with menopause has maintained a solid market share despite the entry of competitors.
- XOSPATA (gilteritinib) : 1Q sales increased +27% year-on-year to ¥21.6 billion , maintaining steady growth as a treatment for acute myeloid leukemia.
- Xtandi (enzalutamide) : The company's flagship prostate cancer treatment, Xtandi, saw 1Q sales of ¥276.6 billion, a +19% year-on-year increase . It is progressing in line with full-year forecasts, forming a solid earnings foundation bolstered by the weak yen.
[Slide Commentary: Performance Trends of Key Products (P.5)]
This slide presents critical data symbolizing how new drugs and strategic products are driving Astellas' growth. It illustrates a two-tiered portfolio structure: the existing pillar, Xtandi (¥276.6 billion) , continues to generate massive cash flow, while the next-generation Strategic Products (totaling ¥160.3 billion) are achieving an extremely high year-on-year growth rate of +43% . The commentary for each product indicates that success is not merely due to volume increases, but also to effective marketing and regulatory strategies, such as "increased penetration of clinical testing," "acquisition of new patients," and "early acquisition of indications."
The peak sales forecasts for strategic products (from reference material P.15) are estimated at ¥400–500 billion for PADCEV , ¥200–400 billion for izervay , ¥150–250 billion for VEOZAH , and ¥100–200 billion each for VYLOY and XOSPATA , outlining a highly reproducible story for raising the medium- to long-term earnings base.
3. Cost Structure and Margin Improvement: Results of Disciplined Cost Optimization (SMT)
Astellas' significant profit improvement this quarter was driven not only by the operating leverage from revenue growth but also by rigorous cost control and structural reform .
Selling, General and Administrative (SG&A) expenses (excluding U.S. Xtandi co-promotion costs) were contained at ¥147.6 billion, a +10.1% increase year-on-year (or +0.1%, essentially flat, excluding FX impacts ). As a result, the SG&A-to-revenue ratio improved by 3.5 percentage points, from 26.5% in the previous year to 23.0% . R&D expenses were ¥81.7 billion (+14.0% year-on-year, or +5.9% excluding FX) , with the R&D-to-revenue ratio improving to 12.8% (compared to 14.2% in the same period last year).
The backbone of this cost containment is the company-wide structural reform project, "SMT (Sustainable Margin Transformation)."
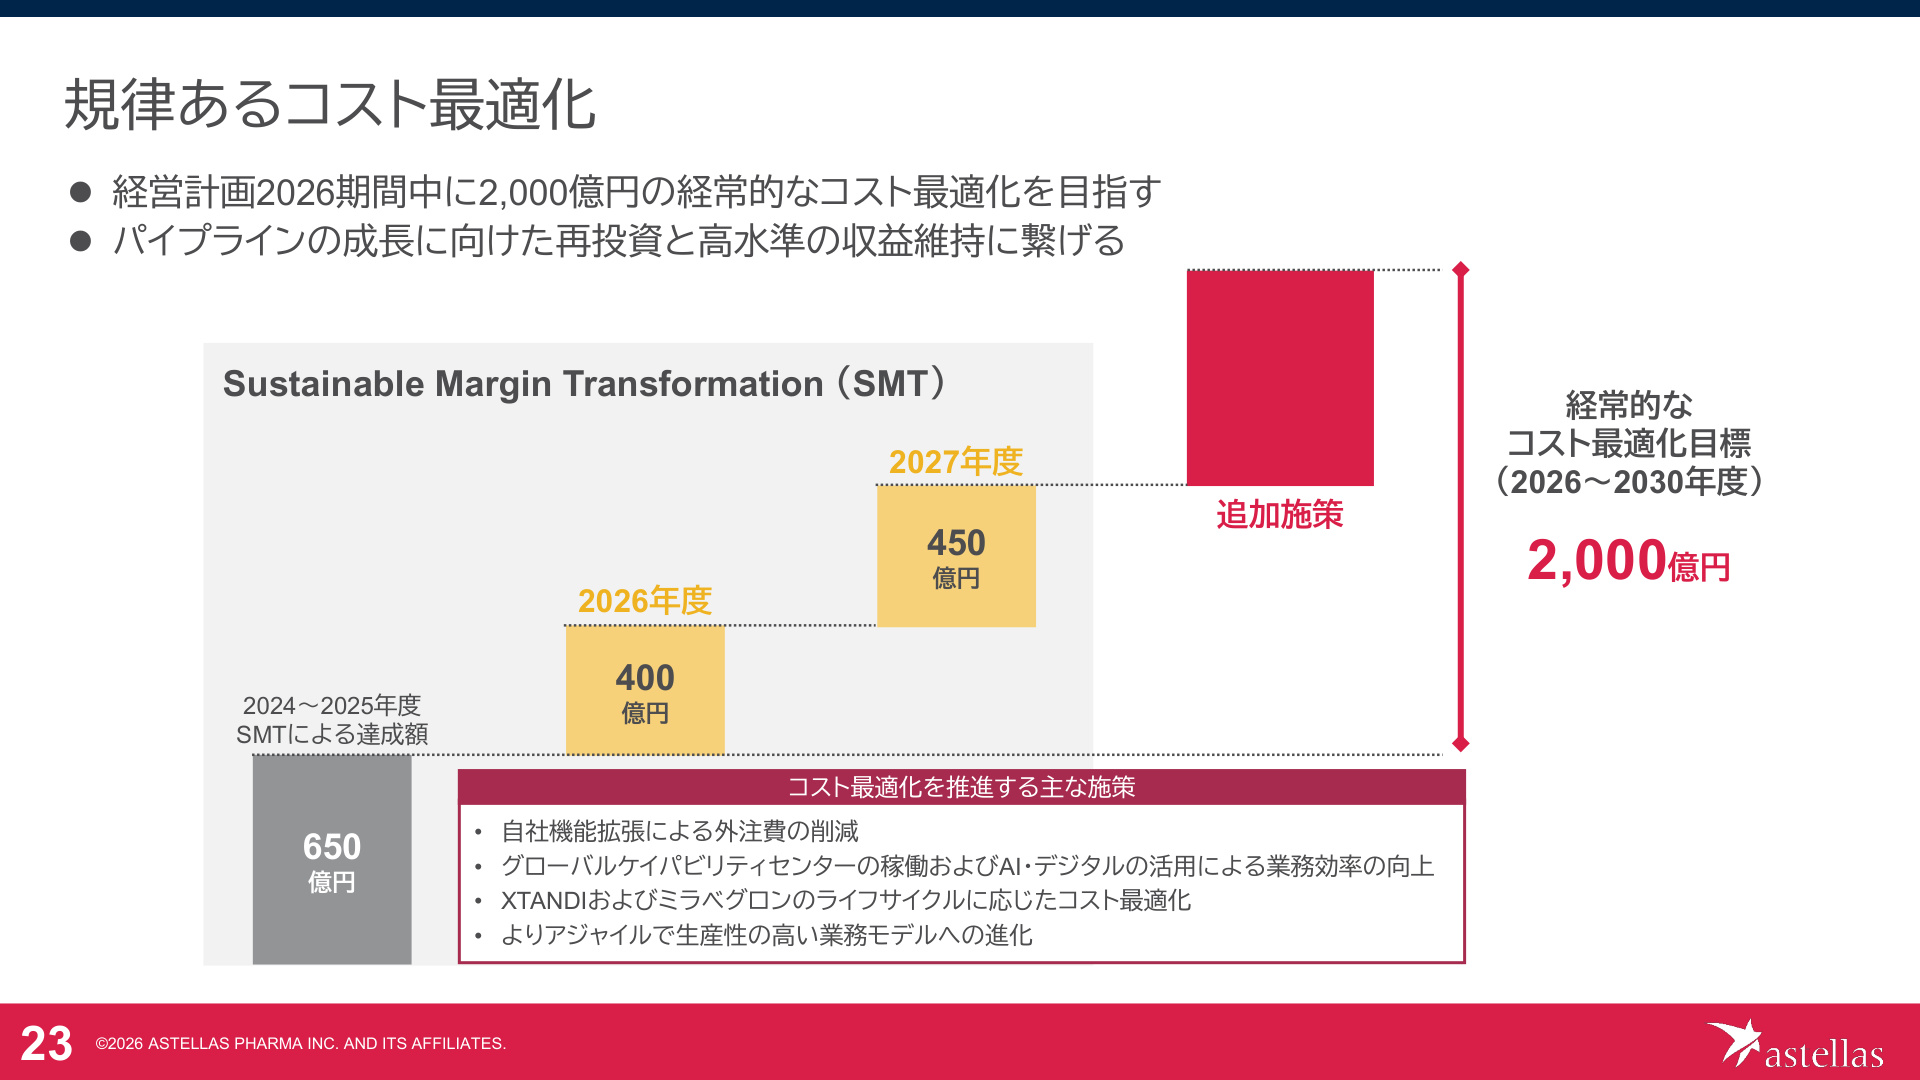
[Slide Commentary: Disciplined Cost Optimization (P.22)]
This slide shows the roadmap and targets for the "Sustainable Margin Transformation (SMT)" initiative. Astellas aims for a cumulative ¥200 billion in recurring cost optimization during the Corporate Strategic Plan 2026 period (FY2026–FY2030) . Specifically, the company plans to accumulate ¥65 billion by FY2024–2025, ¥40 billion in FY2026, and ¥45 billion in FY2027. In this 1Q alone, the company achieved approximately ¥8 billion in cost reduction effects year-on-year (approx. ¥3 billion in SG&A, ¥3 billion in R&D, and ¥2 billion in cost of sales, etc.). Key initiatives include "reducing outsourcing costs through internal functional expansion," "operation of Global Capability Centers," "business efficiency through AI and digital utilization," and "in-house clinical trial functions." The funds generated are reinvested into clinical development (LCM: Life Cycle Management) and R&D for growth products, creating a mechanism for "high-quality management" that sustains growth while maintaining high profit margins.
4. Pipeline and Development Strategy: Evolution of LCM and New Modalities
In R&D and clinical pipelines, significant milestones have been achieved in both Life Cycle Management (LCM) of key products and the expansion of new drug discovery platforms .
(1) Life Cycle Management (LCM) of Key Products
- PADCEV : Received European approval in June for the EV-303 trial (cisplatin-ineligible) in muscle-invasive bladder cancer (MIBC), and filed for approval in Japan (May) and received U.S. approval (July) for the EV-304 trial (cisplatin-eligible) . Furthermore, the Phase III EV-309 trial aimed at bladder-sparing therapy was initiated in June, steadily expanding the target patient population.
- VYLOY : In the Phase III LUCERNA trial (combination with pembrolizumab and chemotherapy) for gastric/gastroesophageal junction adenocarcinoma, the company achieved enrollment of the target number of patients ahead of schedule .
(2) Progress in New Pipelines and Expansion of Drug Discovery Focus
The company has expanded its primary focus in drug discovery from "Targeted Protein Degradation (TPD)" to "Induced Proximity." This conceptual expansion aims to remove or control disease-causing proteins that were difficult to address with conventional methods.
- setidegrasib (ASP3082) : Initiated patient enrollment in the Phase III trial (NCT07566052) for non-small cell lung cancer (NSCLC). Additionally, Phase I data (presented at ESMO GI 2026) in biliary tract cancer (BTC) and gynecological cancer (GYN) confirmed favorable anti-tumor activity.
- ASP2138 : Initiated enrollment in the Phase III trial (NCT07673887) for gastric/gastroesophageal junction adenocarcinoma.
- ASP546C : An antibody-drug conjugate (ADC) targeting Claudin 18.2, which demonstrated high objective response rates (ORR) and disease control rates (DCR) in second-line or later gastric/gastroesophageal junction adenocarcinoma and pancreatic cancer in a Phase II trial in China.
5. Financial Foundation and Shareholder Returns (Capital Allocation)
Financially, the equity ratio (ratio of equity attributable to owners of the parent) remains at a healthy level of 52.6% (as of the end of June 2026, up 1.3 percentage points from the end of the previous fiscal year). Operating cash flow generated ¥86.5 billion in 1Q, and free cash flow secured a surplus of ¥17.2 billion .
Capital allocation policy is clearly defined by the following three priorities:
- Prioritize business investment to achieve growth
- Increase dividend levels based on earnings and financial plans/results
- Flexibly execute share buybacks when surplus funds are available
Regarding shareholder returns, the company maintains a policy of "increasing dividends by at least ¥2 every year throughout the Corporate Strategic Plan 2026 period." Dividend payments have grown steadily from ¥14 in FY05, with the annual dividend forecast for FY26 set at ¥80 (a ¥2 increase from ¥78 in FY25). The company is structured to balance growth investment and shareholder returns while controlling the Gross Debt/EBITDA ratio within the 1.0–1.5x range as an indicator of financial health.
Summary: Outlook and Key Points
Astellas Pharma's Q1 FY2026 earnings demonstrated a high-profit structure with an operating margin exceeding 30%, driven by the high-speed sales expansion of strategic products and structural cost optimization via SMT .
Moving forward, the following points will remain key indicators for evaluating performance trends and corporate value:
- Market penetration speed toward peak sales (totaling over ¥1 trillion) for strategic products (PADCEV, izervay, VYLOY, etc.)
- Progress of ongoing Phase III trials (setidegrasib, ASP2138, EV-309, etc.) and disclosure of clinical data
- Steady implementation of fixed cost reductions through SMT (full-year target of ¥200 billion)
- Accuracy in achieving the full-year forecast (Core Operating Profit of ¥620 billion), considering FX sensitivity (a ¥1 fluctuation against the dollar impacts revenue by approx. ¥8.1 billion and core operating profit by approx. ¥2.3 billion)
This earnings report confirms that the foundation for sustainable value creation is being steadily built through a robust product portfolio and disciplined cost control.
This content is not intended as investment advice or a recommendation. Any opinions expressed are solely the personal views of each article.