


Earnings Deep Dive: H2O Retailing Q1 FY2027 Results Analysis – Strong Department Store Performance and Future Outlook

StockClub
Published: Aug 04, 2026, 10:11 AM
Sentiment Analysis
H2O Retailing (8242) delivered a robust start to the fiscal year ending March 2027, with its core department store business driving significant year-on-year growth in both revenue and profit for the first quarter. Consolidated operating profit has progressed ahead of the company's initial projections, while quarterly net profit more than doubled compared to the same period last year, bolstered by gains from the sale of investment securities.
However, citing declining customer traffic in the food business and uncertainties in the external environment, the company has maintained its initial full-year earnings and dividend forecasts. This report provides a comprehensive analysis of the latest financial results, covering overall performance, segment-specific details, changes in financial structure, and the full-year outlook.
1. Q1 Consolidated Financial Highlights and Growth Drivers
The consolidated results for Q1 FY2027 (April 1, 2026 – June 30, 2026) showed strong performance, with gross sales and all profit levels exceeding the same period last year.
| Item | Q1 FY25 (Prior Year) | Q1 FY26 (Current) | Change | Growth Rate | vs. Company Plan |
|---|---|---|---|---|---|
| Gross Sales | 273.29 billion JPY | 290.69 billion JPY | +17.40 billion JPY | +6.4% | - |
| Net Sales | 163.64 billion JPY | 164.54 billion JPY | +0.89 billion JPY | +0.5% | - |
| Gross Profit | 73.22 billion JPY | 76.27 billion JPY | +3.05 billion JPY | +4.2% | - |
| SG&A Expenses | 67.71 billion JPY | 68.99 billion JPY | +1.27 billion JPY | +1.9% | - |
| Operating Profit | 5.50 billion JPY | 7.27 billion JPY | +1.77 billion JPY | +32.2% | Above Plan |
| Ordinary Profit | 6.14 billion JPY | 8.06 billion JPY | +1.92 billion JPY | +31.4% | - |
| Quarterly Net Profit | 3.98 billion JPY | 10.26 billion JPY | +6.28 billion JPY | +157.9% | - |
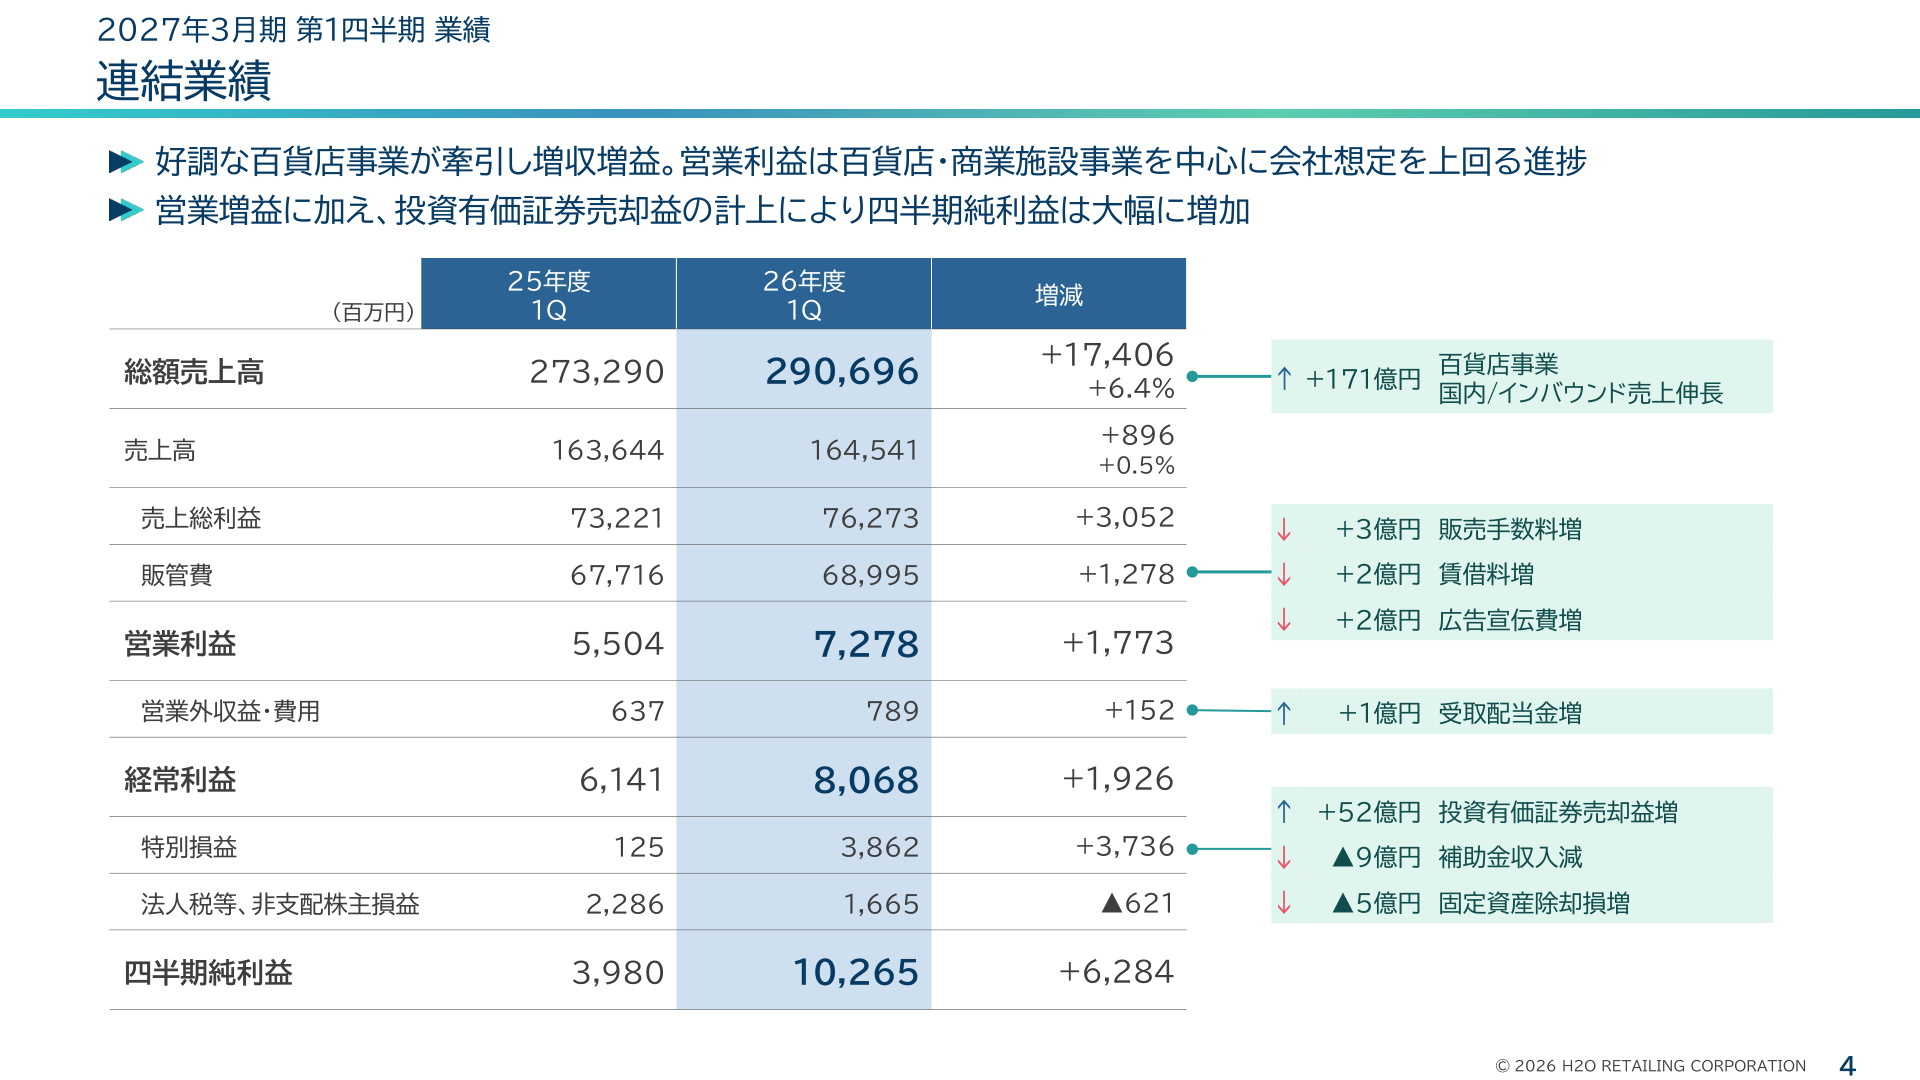
Slide Analysis: Structural Analysis of Consolidated Results
The slide above (P.4) provides a comprehensive overview of the current consolidated performance and its drivers:
- Gross profit growth outpaces SG&A increase : The increase in gross profit (+3.05 billion JPY) driven by higher gross sales (+17.4 billion JPY) more than absorbed the rise in SG&A expenses (+1.27 billion JPY), which included higher sales commissions (+0.3 billion JPY), rent (+0.2 billion JPY), and advertising costs (+0.2 billion JPY). This resulted in a significant 32.2% year-on-year increase in operating profit (+1.77 billion JPY) .
- Final profit boosted by extraordinary gains : The recording of 5.2 billion JPY in gains from the sale of investment securities contributed to a substantial rise in quarterly net profit to 10.26 billion JPY (+157.9% YoY). This reflects progress in initiatives to improve capital efficiency, such as the reduction of cross-shareholdings.
2. Segment Performance: Department Store Dominance and Food Business Resilience
Performance varied by segment, with department stores and commercial facilities maintaining strong momentum, while the food business saw a decline in profit.
| Segment | Gross Sales | YoY Change | Operating Profit | YoY Change | Key Drivers |
|---|---|---|---|---|---|
| Department Store | 156.42 billion JPY | +12.3% | 5.76 billion JPY | +2.30 billion JPY | Hankyu Main Store renovation, strong domestic/inbound demand |
| Food | 101.21 billion JPY | △3.6% | 1.74 billion JPY | △0.56 billion JPY | Lower traffic, reaction to prior year rice demand, rising labor costs |
| Commercial Facilities | 22.73 billion JPY | +19.3% | 1.83 billion JPY | +0.28 billion JPY | Strong performance at Ningbo Hankyu (China) |
| Other | 10.32 billion JPY | +3.9% | 7.99 billion JPY | △2.07 billion JPY | Decline in dividends from subsidiaries (eliminated in consolidation) |
① Department Store Segment: Record Highs in Domestic and Inbound Sales
The department store segment saw gross sales rise 12.3% YoY to 156.42 billion JPY, with operating profit surging 66.9% to 5.76 billion JPY.
- Domestic Sales : Driven by renovations at the Hankyu Main Store and Hanshin Umeda Main Store, total store sales increased 11% YoY, reaching a record high . Wealth effect from rising stock prices has kept demand for high-end items like jewelry, watches, and luxury brands extremely robust among domestic affluent customers.
- Inbound Sales : Benefiting from the weak yen and strengthened tax-free processing systems, sales reached approximately 30 billion JPY (+21.7% YoY) .
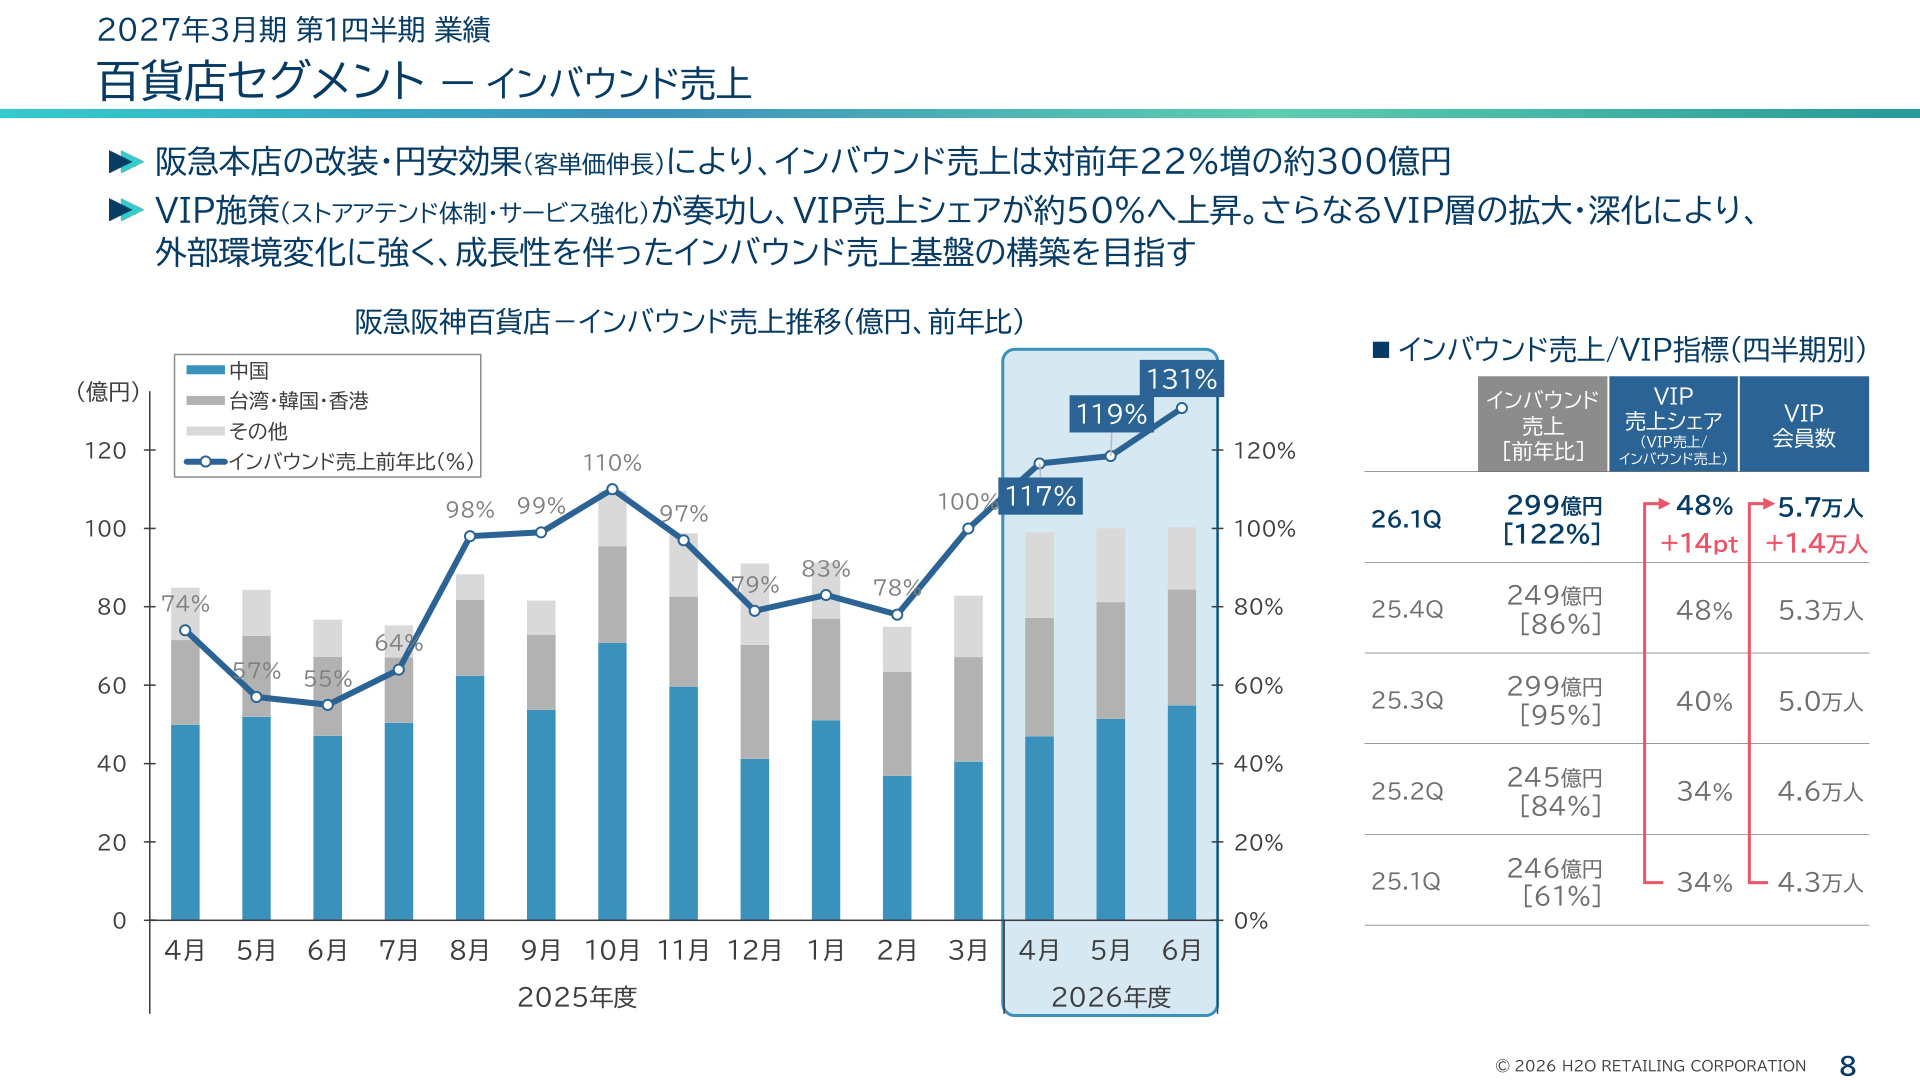
Slide Analysis: Inbound Sales and Deepening VIP Strategy
The slide above (P.8) illustrates the trend in inbound sales and the progress of the VIP customer strategy:
- VIP sales share jumps to 48% : By prioritizing "VIP initiatives" such as enhanced store attendant systems and exclusive services rather than just chasing visitor volume, the share of VIP customers in inbound sales surged to 48% (+14pt YoY) .
- Increase in VIP members : The number of VIP members grew from 43,000 in the same period last year to 57,000 (+14,000) . By organizing and retaining high-purchasing power customers, the company is building a highly profitable inbound business foundation resilient to external fluctuations.
② Food Segment: Improved Gross Margin Offset by Lower Traffic
The food segment reported gross sales of 101.21 billion JPY (-3.6% YoY) and operating profit of 1.74 billion JPY (-24.5% YoY).
- Background to profit decline : The decline was impacted by a reaction to the surge in rice demand in the previous year and lower customer traffic due to poor weather (existing store traffic △2.9%).
- Structural reform progress : Gross margin improved by +0.3pt YoY. The company is curbing labor costs (△0.21 billion JPY) through self-checkout adoption and improved productivity via store format conversions, actively promoting value-oriented (Marche) and price-oriented (Daily Smart) formats.
③ Commercial Facilities and Other Segments
- Commercial Facilities : "Ningbo Hankyu" in China continued to perform well, growing over 10% YoY due to high-end demand from local affluent customers, contributing to a segment operating profit of 1.83 billion JPY (+0.28 billion JPY YoY).
3. Changes in B/S and Improvement in Capital Efficiency
Consolidated total assets at the end of Q1 stood at 680.5 billion JPY, a decrease of 34.2 billion JPY from the end of the previous fiscal year.
- Asset Reduction : Fixed assets decreased by 21.9 billion JPY (investment securities △19.0 billion JPY) due to the sale of securities. Cash and deposits also decreased by 15.7 billion JPY.
- Net Assets and Equity Ratio : While net assets were 318.2 billion JPY (△7.2 billion JPY from the previous year-end), the compression of total assets led to an improvement in the equity ratio from 43% to 44% . The company is steadily advancing efficient asset management and strengthening its financial position.
4. Full-Year Earnings and Dividend Outlook
Despite the strong Q1 performance exceeding company expectations, the full-year earnings and annual dividend forecasts for FY2027 remain unchanged from the initial plan .
| Consolidated Full-Year Metrics | FY25 Actual | FY26 Forecast | YoY Change | Growth Rate |
|---|---|---|---|---|
| Gross Sales | 1,162.43 billion JPY | 1,245.00 billion JPY | +82.56 billion JPY | +7.1% |
| Net Sales | 680.21 billion JPY | 712.00 billion JPY | +31.78 billion JPY | +4.7% |
| Operating Profit | 32.38 billion JPY | 32.50 billion JPY | +0.11 billion JPY | +0.3% |
| Ordinary Profit | 34.50 billion JPY | 33.00 billion JPY | △1.50 billion JPY | △4.4% |
| Net Profit | 29.95 billion JPY | 23.00 billion JPY | △6.95 billion JPY | △23.2% |
| Dividend per Share | 46 JPY | 48 JPY | +2 JPY | - |
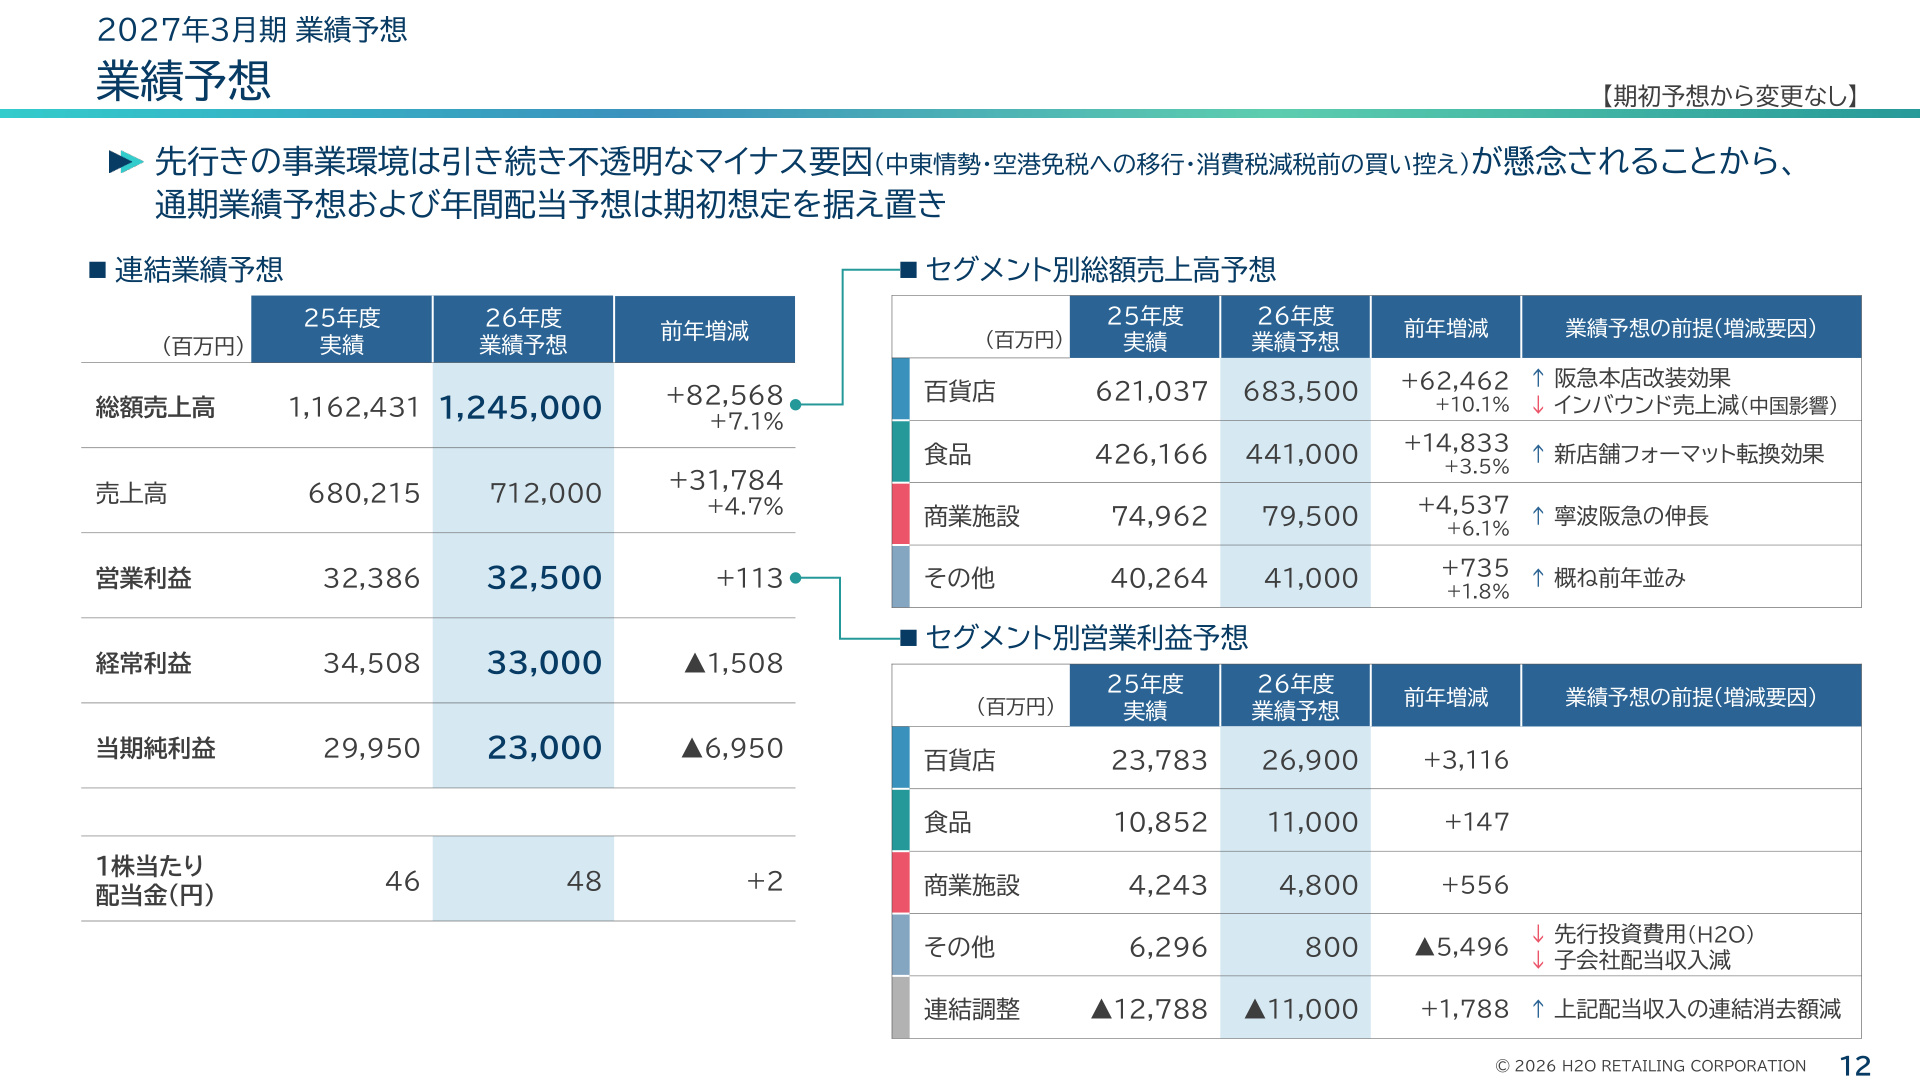
Slide Analysis: Rationale for Maintaining Forecasts and Segment Assumptions
The slide above (P.12) shows the full-year forecast and segment-specific plans for FY2027.
- Rationale for maintaining forecasts : Although Q1 was very strong, the company remains cautious due to multiple negative factors, including "heightened tensions in the Middle East," "impact of transitions to airport duty-free," and "concerns over consumer restraint due to potential future consumption tax discussions." The company is maintaining a cautious stance to monitor changes in the second half.
- Segment Outlook :
- Department Store : Expected to remain the primary driver with gross sales of 683.5 billion JPY (+10.1% YoY) and operating profit of 26.9 billion JPY (+3.11 billion JPY YoY).
- Food : Targeting a recovery through new store formats with gross sales of 441.0 billion JPY (+3.5% YoY) and operating profit of 11.0 billion JPY (+0.14 billion JPY YoY).
- Other : Operating profit is expected to be 0.8 billion JPY (△5.49 billion JPY YoY) due to upfront investment costs at the holding company and lower subsidiary dividends, though this is offset by consolidated adjustments (+1.78 billion JPY).
- Shareholder Return Policy : The annual dividend forecast is maintained at 48 JPY per share , a 2 JPY increase from the previous year, demonstrating a commitment to stable returns.
5. Conclusion and Key Points to Watch
H2O Retailing's Q1 FY2027 results were a strong start, exceeding expectations thanks to the overwhelming customer attraction and high-end sales power of the department store business, particularly the Hankyu Main Store, combined with the VIP inbound strategy .
Key points to watch moving forward :
- Maintaining Department Store Momentum : The sustainability of affluent demand and the impact of external factors, such as changes to tax-free systems, on inbound sales.
- Profitability Improvement in Food : The extent to which the shift to new store formats (value/price-oriented) and labor-saving measures like self-checkouts translate into recovery in customer traffic and profit margins.
- Potential Upward Revision of Full-Year Forecasts : Whether the company will revise its conservative full-year outlook if the department store business continues its strong performance into the second quarter and beyond.
These results confirm that the company's focus on "high value-added" offerings and "deepening customer relationships" is yielding tangible results.
This content is not intended as investment advice or a recommendation. Any opinions expressed are solely the personal views of each article.