


Joshin Q1 FY2026 Earnings Deep Dive: Drivers of Substantial Profit Growth and the Full Picture of the Upward Revision to First-Half Forecasts

StockClub
Published: Aug 04, 2026, 10:10 AM
Sentiment Analysis

Overview and Earnings Highlights
Joshin (Joshin Denki Co., Ltd.; Securities Code: 8173) delivered exceptionally strong results for the first quarter (April–June) of fiscal year 2026 (ending March 31, 2027), with both revenue and profit at all levels significantly exceeding the same period last year.
Q1 performance highlights are as follows:
- Revenue : 112.74 billion yen ( +13.0% YoY)
- Operating Profit : 3.164 billion yen ( +460.1% YoY)
- Ordinary Profit : 3.089 billion yen ( +541.8% YoY)
- Quarterly Net Profit : 2.356 billion yen ( +367.5% YoY)
Compared to the 564 million yen in operating profit recorded in the same period last year, the company achieved a massive surge to 3.164 billion yen, representing more than a 5.6-fold increase year-on-year . The primary drivers were a sharp rise in demand for core home appliances (particularly air conditioners), strong performance in the gaming and entertainment sectors, and a dramatic increase in gross profit resulting from improved store efficiency.
1. Trends by Store and E-commerce Channels and Improvements in Store Efficiency
Looking at revenue trends by channel, while growth was achieved in both brick-and-mortar sales and e-commerce (EC) , the growth in brick-and-mortar sales was the primary engine driving performance.
- Brick-and-Mortar Revenue : 92.897 billion yen ( +15.7% YoY, 82.4% of total revenue)
- E-commerce Revenue : 18.872 billion yen ( +4.8% YoY, 16.8% of total revenue)
The number of directly operated stores increased slightly from 215 to 219 . However, the most notable metric is revenue per store , which rose significantly from 370 million yen in the same period last year to 420 million yen this term. This indicates that the recovery in foot traffic and an increase in the sales ratio of high-ticket items have led to improved overall store sales efficiency.
2. Detailed Analysis of Operating Profit Factors
The structure behind the substantial Q1 operating profit growth (an increase of +2.6 billion yen YoY) is highly robust, with the increase in gross profit comfortably absorbing the rise in SG&A expenses.
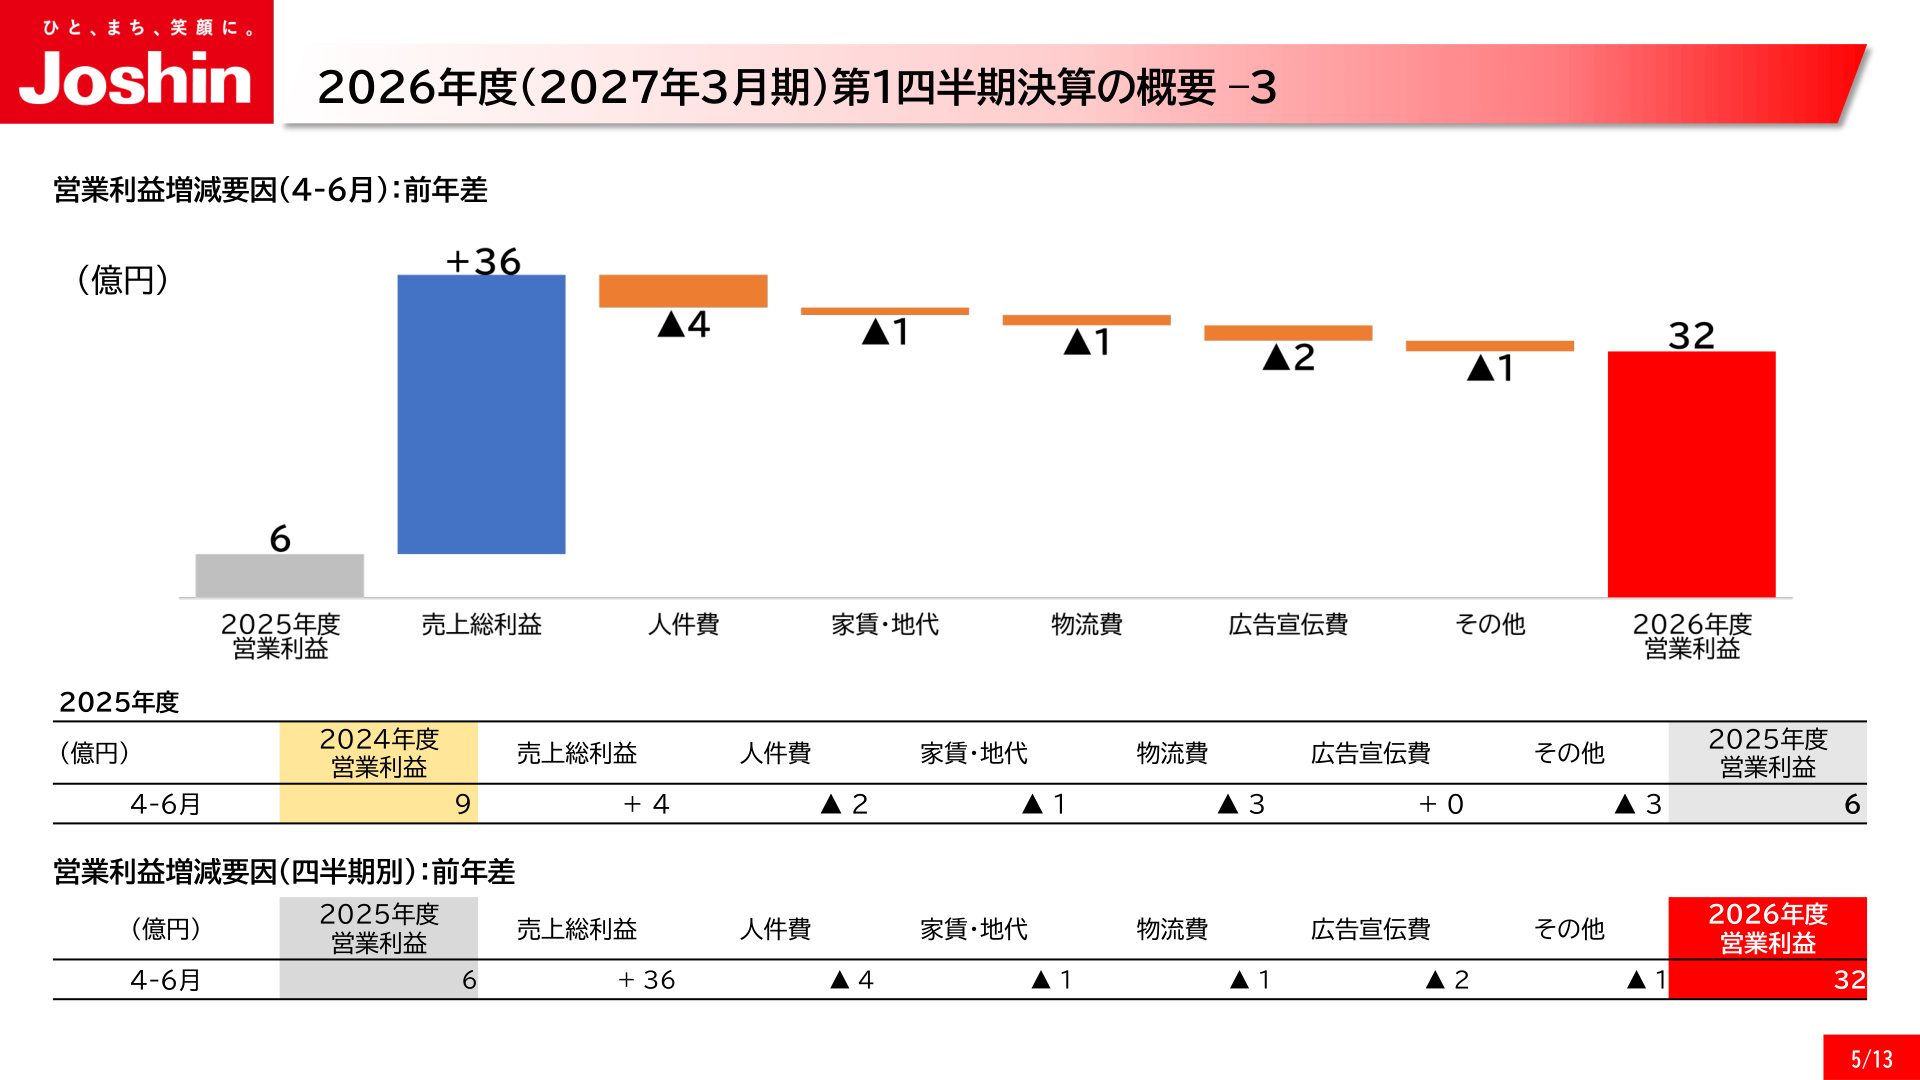
The slide above (Operating Profit Variance Analysis) clearly illustrates the internal structure of the profit surge in this quarter.
Specifically, it is composed of the following factors:
- Increase in Gross Profit : +3.6 billion yen (positive impact from revenue growth and improved gross margin)
- Increase in Personnel Expenses : -0.4 billion yen (10.865 billion yen, +4.0% YoY; due to base pay increases and staffing adjustments)
- Increase in Rent : -0.1 billion yen (3.565 billion yen, +2.8% YoY)
- Increase in Logistics Costs : -0.1 billion yen (3.216 billion yen, +4.2% YoY; due to higher delivery volumes and logistics costs)
- Increase in Advertising Expenses : -0.2 billion yen (2.053 billion yen, +10.6% YoY; costs associated with customer acquisition initiatives)
- Other Expenses : -0.1 billion yen
Although SG&A expenses increased by 3.9% YoY to 25.99 billion yen in line with revenue growth, the gross profit expanded by 3.6 billion yen due to revenue growth and disciplined margin management. Consequently, operating profit surged from 600 million yen in the same period last year to 3.2 billion yen (3,164 million yen) .
3. Revenue Trends by Product Category and Explosive Growth in Core Appliances
In terms of revenue trends by product category, the significant growth in air conditioners and the strong performance of entertainment and hobby-related items were particularly notable.
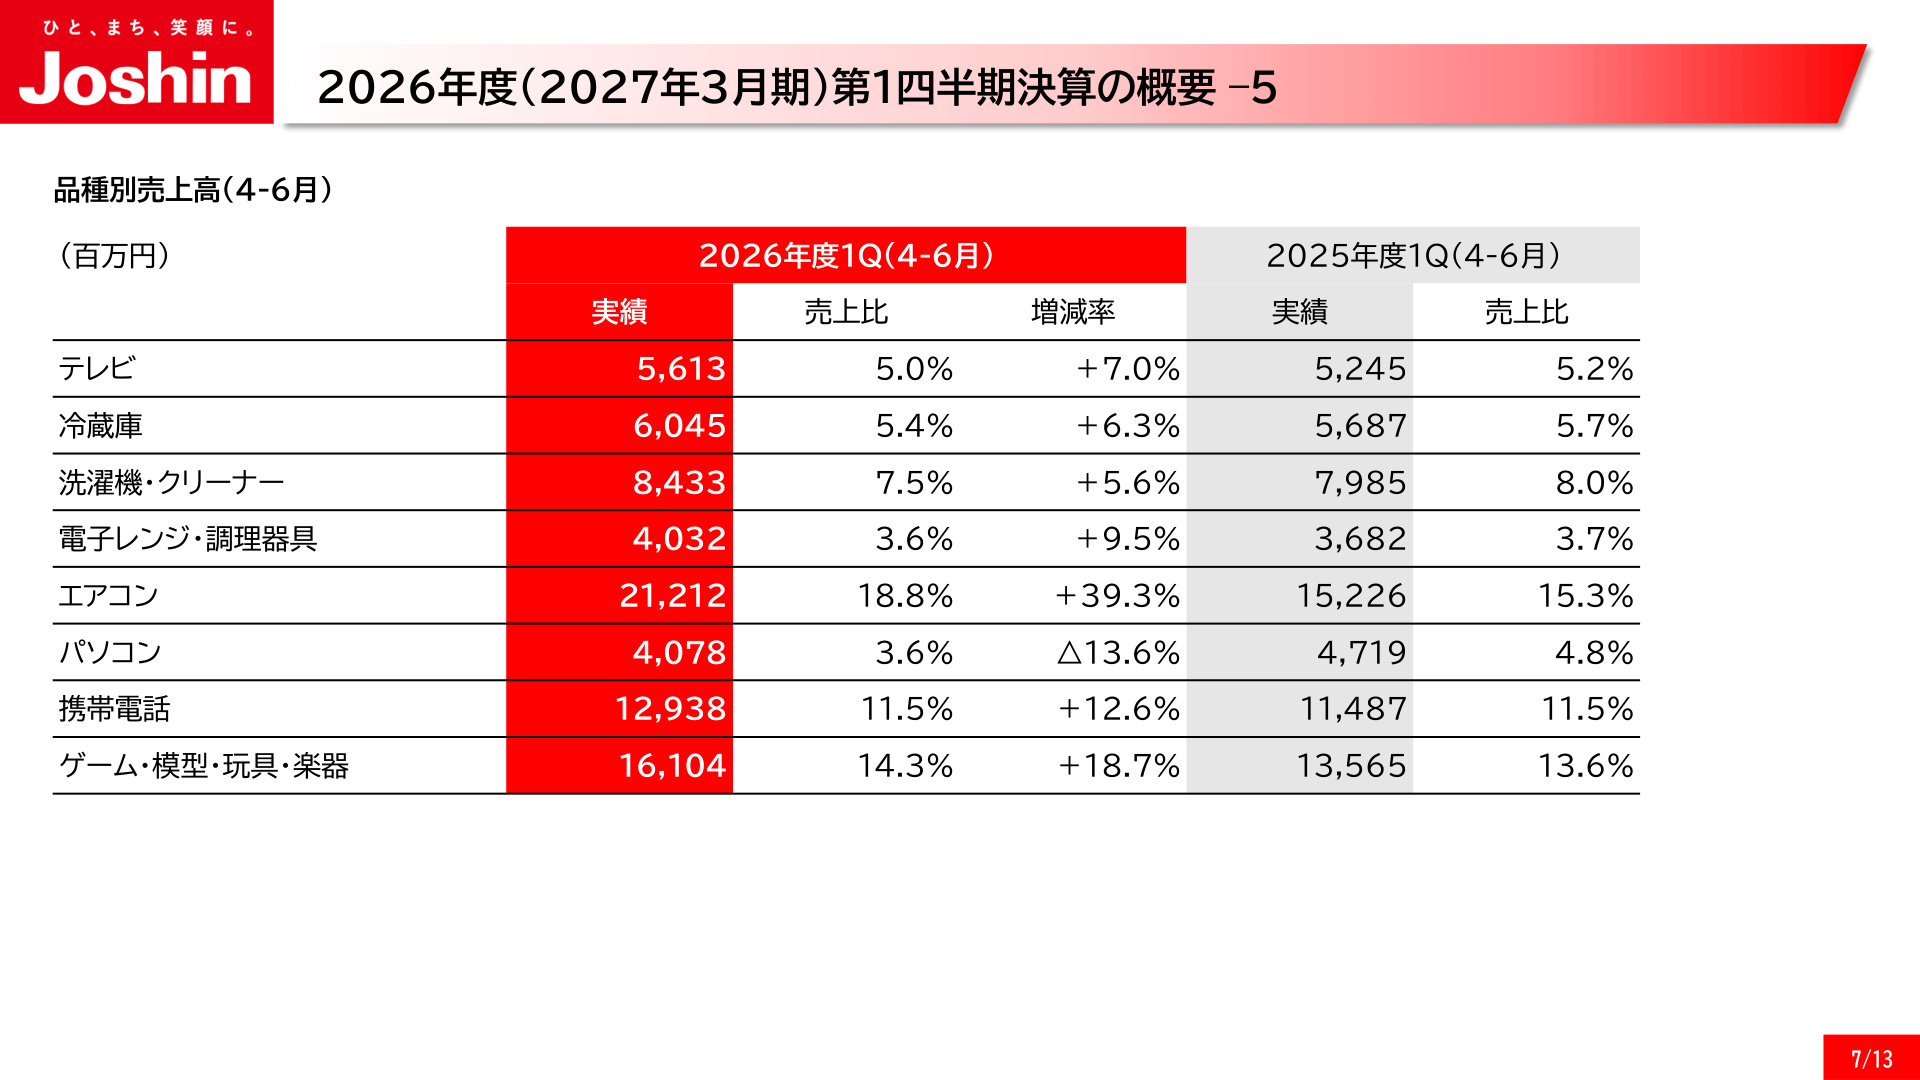
The growth potential of each category is visualized in the "Revenue by Product" data in the slide above. The trends for major categories are as follows:
- Air Conditioners : 21.212 billion yen ( +39.3% YoY)
- Driven by early heatwaves and rising temperatures, demand for replacements and high-functionality models concentrated here, making it the largest growth driver, accounting for 18.8% of total revenue.
- Games, Models, Toys, and Musical Instruments : 16.14 billion yen ( +18.7% YoY)
- Solid performance in hobby demand and the release of popular titles helped this category form a core pillar, accounting for 14.3% of revenue.
- Mobile Phones : 12.938 billion yen ( +12.6% YoY)
- Maintained steady growth, supported by demand for new models and various carrier initiatives.
- Microwaves and Cooking Appliances : 4.032 billion yen ( +9.5% YoY)
- Televisions : 5.613 billion yen ( +7.0% YoY)
- Refrigerators : 6.045 billion yen ( +6.3% YoY)
- Washing Machines and Cleaners : 8.433 billion yen ( +5.6% YoY)
- PCs : 4.078 billion yen ( -13.6% YoY)
- The only major category to see a year-on-year decline, though this had no impact on the overall growth trend due to dramatic gains in other categories.
In addition to the strength of home appliances (especially seasonal items), the entertainment sector—including Joshin's strength in the "Kids Land" (toys/hobbies) business—bolstered profit growth.
4. Upward Revision to First-Half FY2026 Earnings Forecast
Following the record-breaking progress in the first quarter (April–June), the company has significantly revised its consolidated earnings forecast for the first half of FY2026 (April–September) upward .
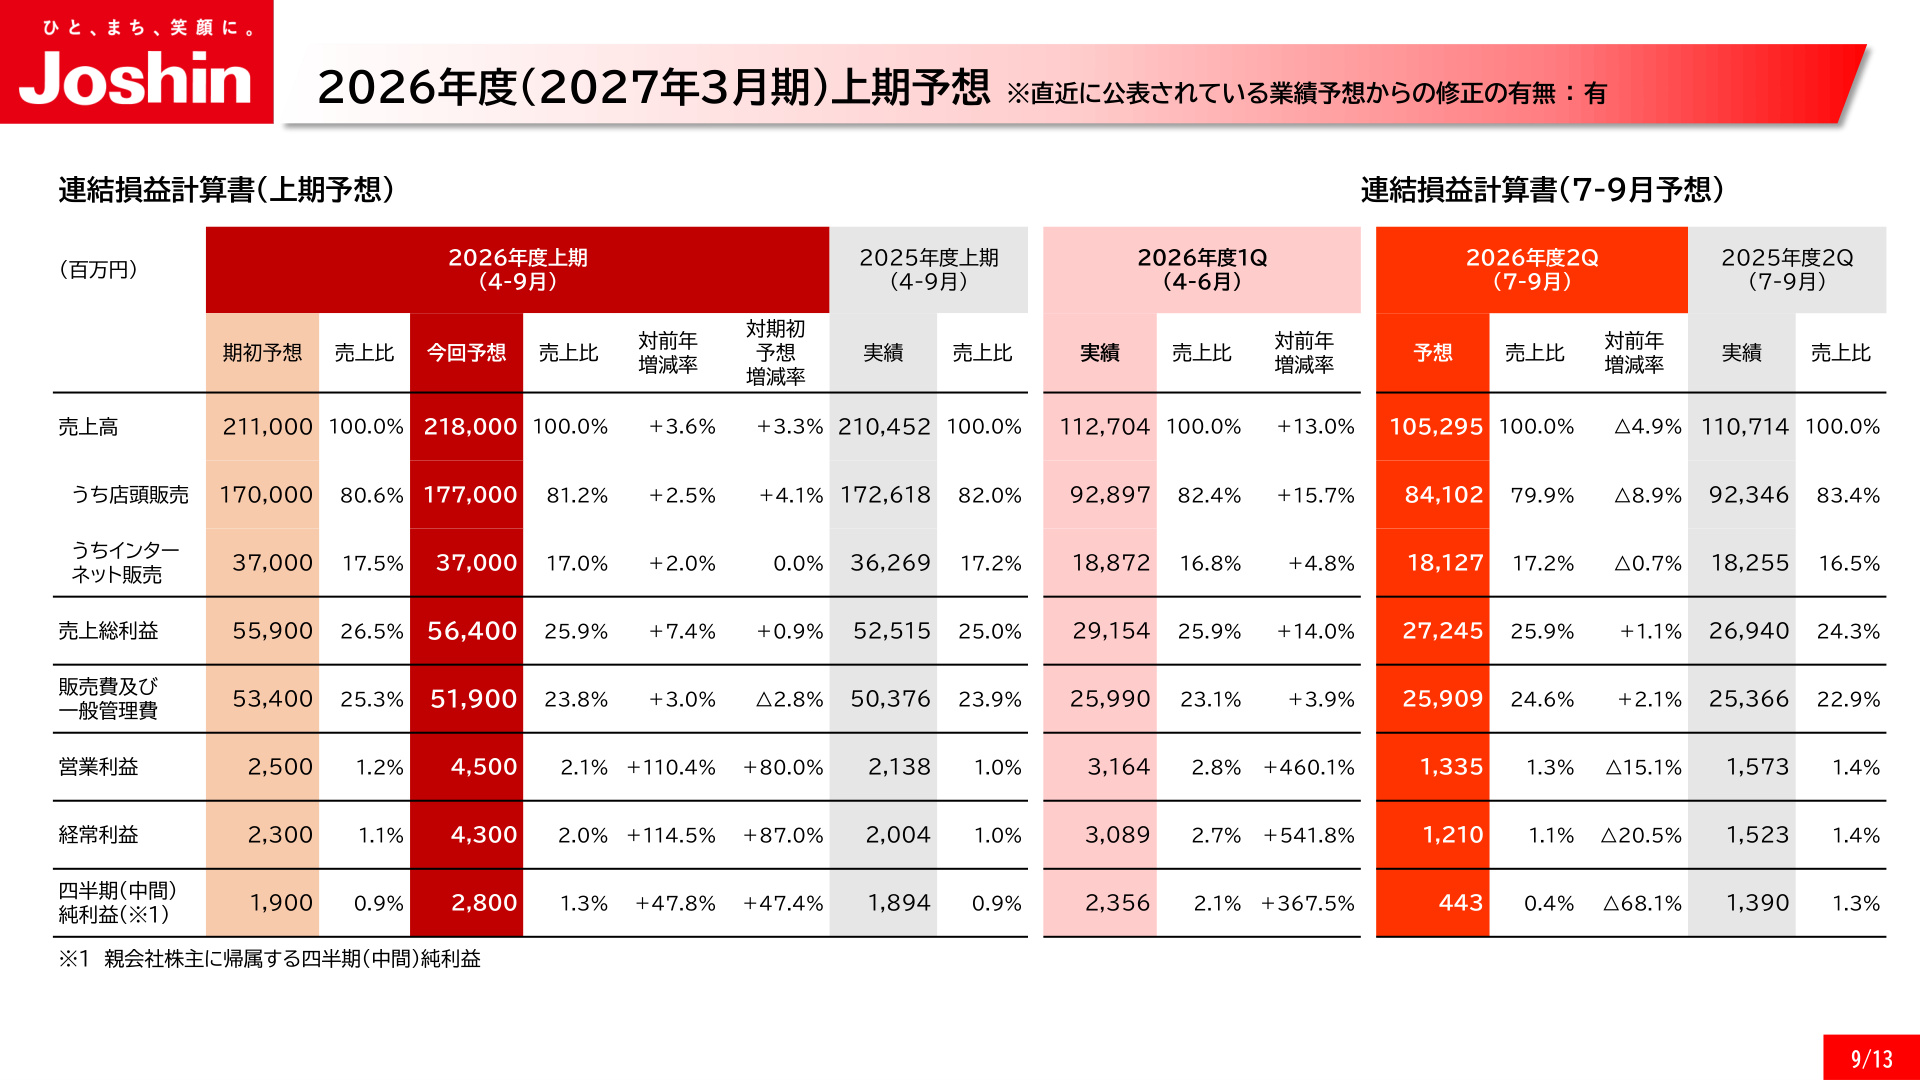
This slide provides critical data comparing the initial forecast with the revised forecast, as well as the outlook for the second quarter (July–September) alone.
【Revisions to H1 (April–September) Consolidated Earnings Forecast】
- Revenue : Previous forecast 211 billion yen → Revised forecast 218 billion yen (+3.3% vs. initial, +3.6% YoY)
- Operating Profit : Previous forecast 2.5 billion yen → Revised forecast 4.5 billion yen (+80.0% vs. initial, +110.4% YoY)
- Ordinary Profit : Previous forecast 2.3 billion yen → Revised forecast 4.3 billion yen (+87.0% vs. initial, +114.5% YoY)
- Interim Net Profit Attributable to Owners of Parent : Previous forecast 1.9 billion yen → Revised forecast 2.8 billion yen (+47.4% vs. initial, +47.8% YoY)
Having already generated 3.164 billion yen in operating profit by Q1, the progress toward the H1 target of 4.5 billion yen is at a very high level. While the forecast for Q2 (July–September) alone is conservative at 1.335 billion yen (-15.1% YoY), the company expects profit levels for the first half as a whole to significantly exceed initial projections .
5. Full-Year Earnings Forecast and Future Challenges
Meanwhile, the full-year earnings forecast for FY2026 (April–March) remains unchanged (maintained) at this time.
【Full-Year (April–March) Consolidated Earnings Forecast】
- Revenue : 438 billion yen (+0.3% YoY)
- Operating Profit : 6 billion yen (+10.7% YoY)
- Ordinary Profit : 5.5 billion yen (+7.6% YoY)
- Net Profit : 3.5 billion yen (+6.7% YoY)
While the H1 operating profit forecast was raised to 4.5 billion yen, the full-year forecast remains at 6 billion yen. This reflects a cautious stance regarding potential changes in consumer spending in the second half (October–March), the impact of rising electricity and commodity prices on demand, and uncertainty regarding winter heating demand. Whether the full-year forecast will be revised at the end of the first half will be a key point to watch.
6. Stock Market Valuation and Capital Efficiency (Approaching PBR 1.0x)
Driven by the rapid recovery in earnings and expectations for management reform, the company's valuation in the stock market has risen significantly.
- Stock Price Trend : Surged from 2,133 yen at the end of March 2025 to 3,930 yen at the end of June 2026 ( +84.2% increase). This performance is exceptionally strong compared to the Nikkei 225 (+96.7%) and TOPIX (+50.3%).
- PBR (Price-to-Book Ratio) Trend : Rose from 0.54x at the end of March 2025 to 0.99x at the end of June 2026, bringing it to the brink of the "1.0x PBR" threshold requested by the Tokyo Stock Exchange.
It is evident that the improvement in profitability through structural reform and store efficiency is directly linked to the market's re-evaluation of the company's PBR.
7. Governance Reform and New Executive Structure
Following the Annual General Meeting of Shareholders held on June 26, 2026, the company further strengthened its governance structure.
- Expansion of Outside Directors : Norihiro Itano and Michiko Funamoto were newly appointed as outside directors.
- Strengthening of Committee Structure : The company has tightened the structure where outside directors chair the Nomination and Compensation Committee and the Effectiveness Evaluation Committee, enhancing management transparency and objectivity.
Summary
Joshin's Q1 FY2026 earnings were driven by a synergy of capturing heatwave-related demand (centered on air conditioners), strong performance in the hobby and entertainment sectors, and a dramatic improvement in store sales efficiency (420 million yen in revenue per store), resulting in a powerful 5.6-fold year-on-year increase in operating profit . The subsequent upward revision to the first-half earnings forecast and the improvement in PBR to 0.99x symbolize the strength of the company's business foundation and the progress of its management improvements.
This content is not intended as investment advice or a recommendation. Any opinions expressed are solely the personal views of each article.