


Nagase & Co., Ltd. (8012) Q1 FY2026 Earnings Deep Dive: Record-Breaking Results Driven by Resilient Supply Chains, AI Semiconductors, and Life Sciences

StockClub
Published: Aug 04, 2026, 10:09 AM
Sentiment Analysis

Nagase & Co., Ltd. (8012) Q1 FY2026 Earnings Deep Dive
This report provides a multi-faceted analysis of the Q1 FY2026 earnings results for Nagase & Co., Ltd. (Ticker: 8012), a leading chemical trading and manufacturing firm, unraveling the company's overall performance and growth narrative.
1. Earnings Highlights: Record-Breaking Performance and Enhanced Profitability
Nagase & Co., Ltd. delivered an exceptionally strong start to FY2026, with record-highs achieved across revenue and all profit tiers .
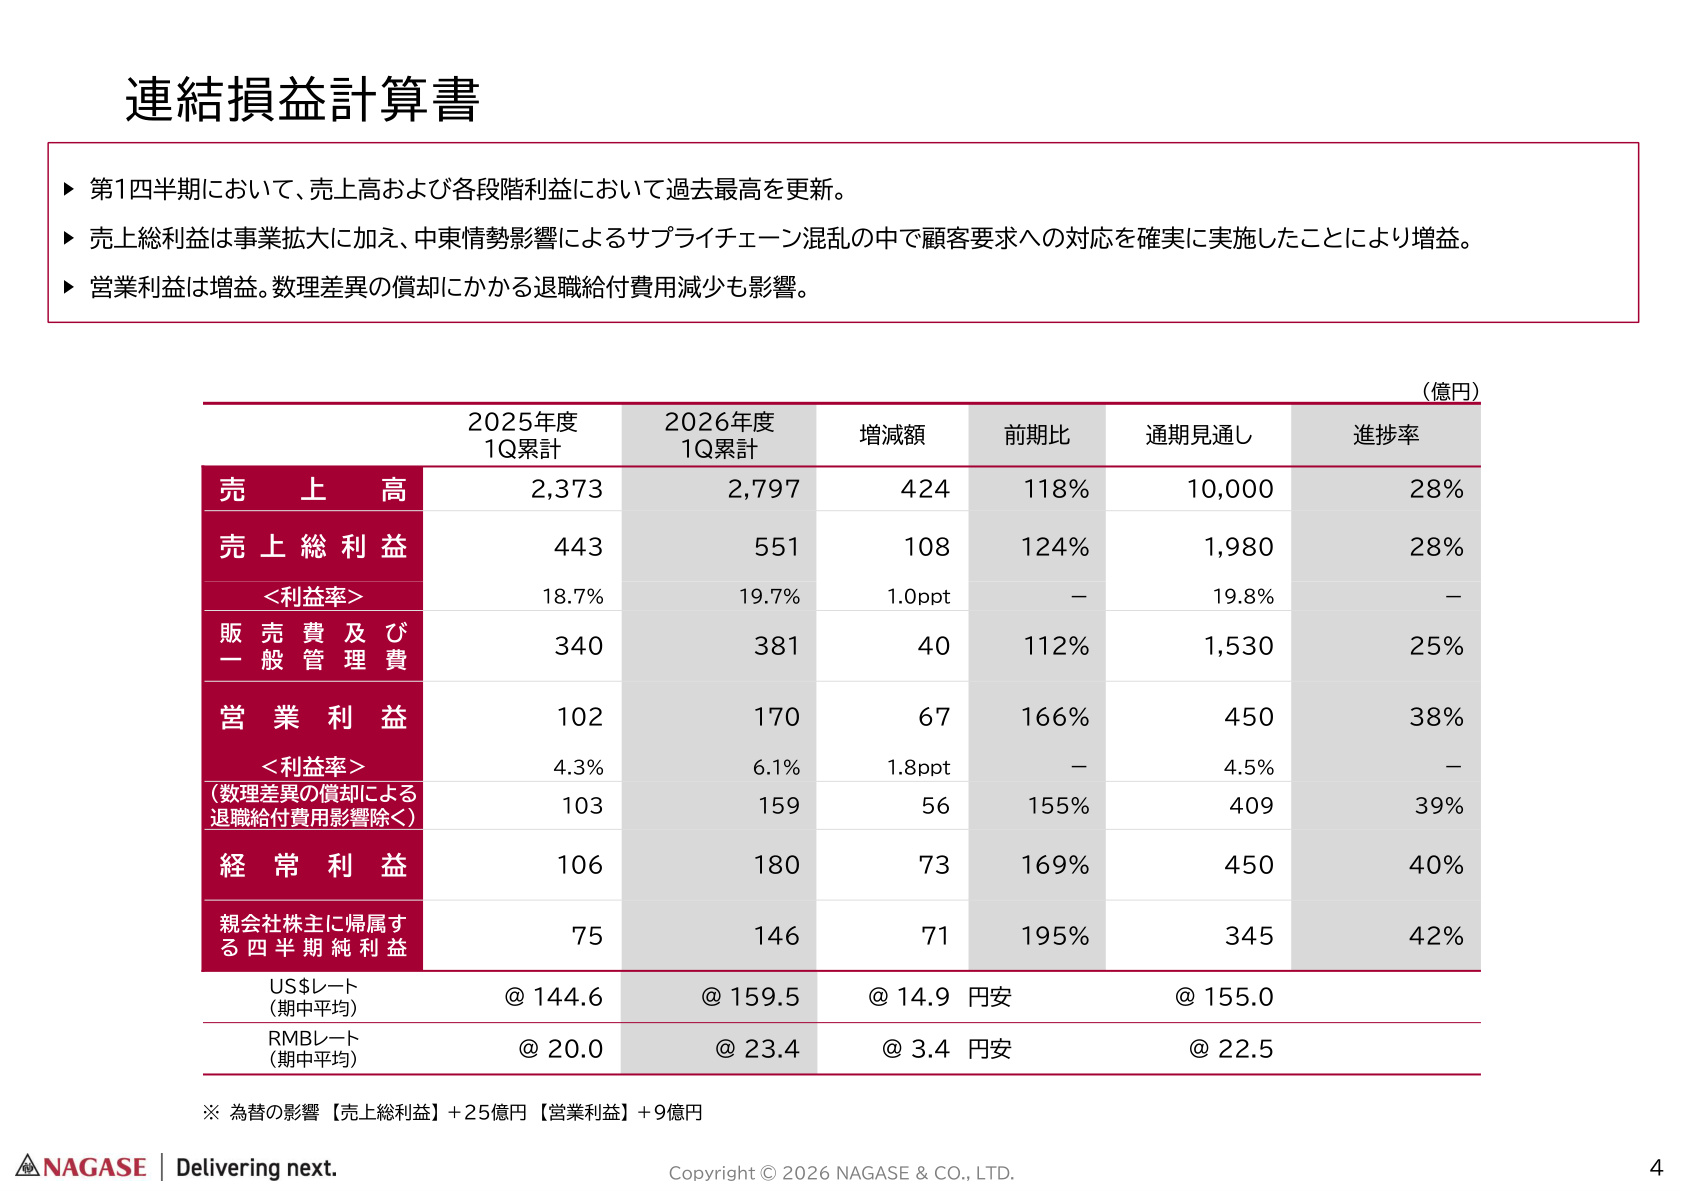
The Consolidated Statement of Income slide above is critical as it accurately reflects the company's robust performance trajectory for the period. Key figures and performance highlights include:
- Revenue : ¥279.7 billion (up ¥42.4 billion / +18% YoY)
- Gross Profit : ¥55.1 billion (up ¥10.8 billion / +24% YoY)
- Gross Profit Margin : 19.7% (up 1.0 ppt YoY)
- Operating Income : ¥17.0 billion (up ¥6.7 billion / +66% YoY)
- Operating Margin : 6.1% (up 1.8 ppt YoY)
- Ordinary Income : ¥18.0 billion (up ¥7.3 billion / +69% YoY)
- Net Income Attributable to Owners of the Parent : ¥14.6 billion (up ¥7.1 billion / +95% YoY)
Regarding progress against full-year forecasts , while revenue and gross profit reached 28% of the target, operating income hit 38% , ordinary income 40% , and net income 42% , indicating a very high rate of progress in profitability. While the weak yen (averaging US$1 = ¥159.5 and RMB = ¥23.4, contributing +¥2.5 billion to gross profit and +¥0.9 billion to operating income) and a reduction in retirement benefit expenses due to actuarial differences provided tailwinds, the primary driver of this significant profit growth was the dramatically enhanced earning power of the core trading business and manufacturing subsidiaries.
2. Macro Environment and Impact of Middle East Tensions
A notable aspect of this quarter was the company's response to market price surges and supply chain disruptions caused by Middle East tensions (e.g., the blockade of the Strait of Hormuz) .
In the face of naphtha shortages and rising raw material costs, the company fully leveraged its global network to secure alternative supplies and maintain stable deliveries to customers. By effectively capturing customer demand for risk mitigation (stockpiling), the company successfully increased its gross profit margin during the market upturn. Simultaneously, it maintained strict control over inventory levels in anticipation of potential future price declines, demonstrating flexible risk management capabilities in response to external environmental changes.
3. Segment Analysis: Profit Growth Across All Segments
A key feature of this period is that all major segments achieved year-on-year profit growth, without relying on any single segment.
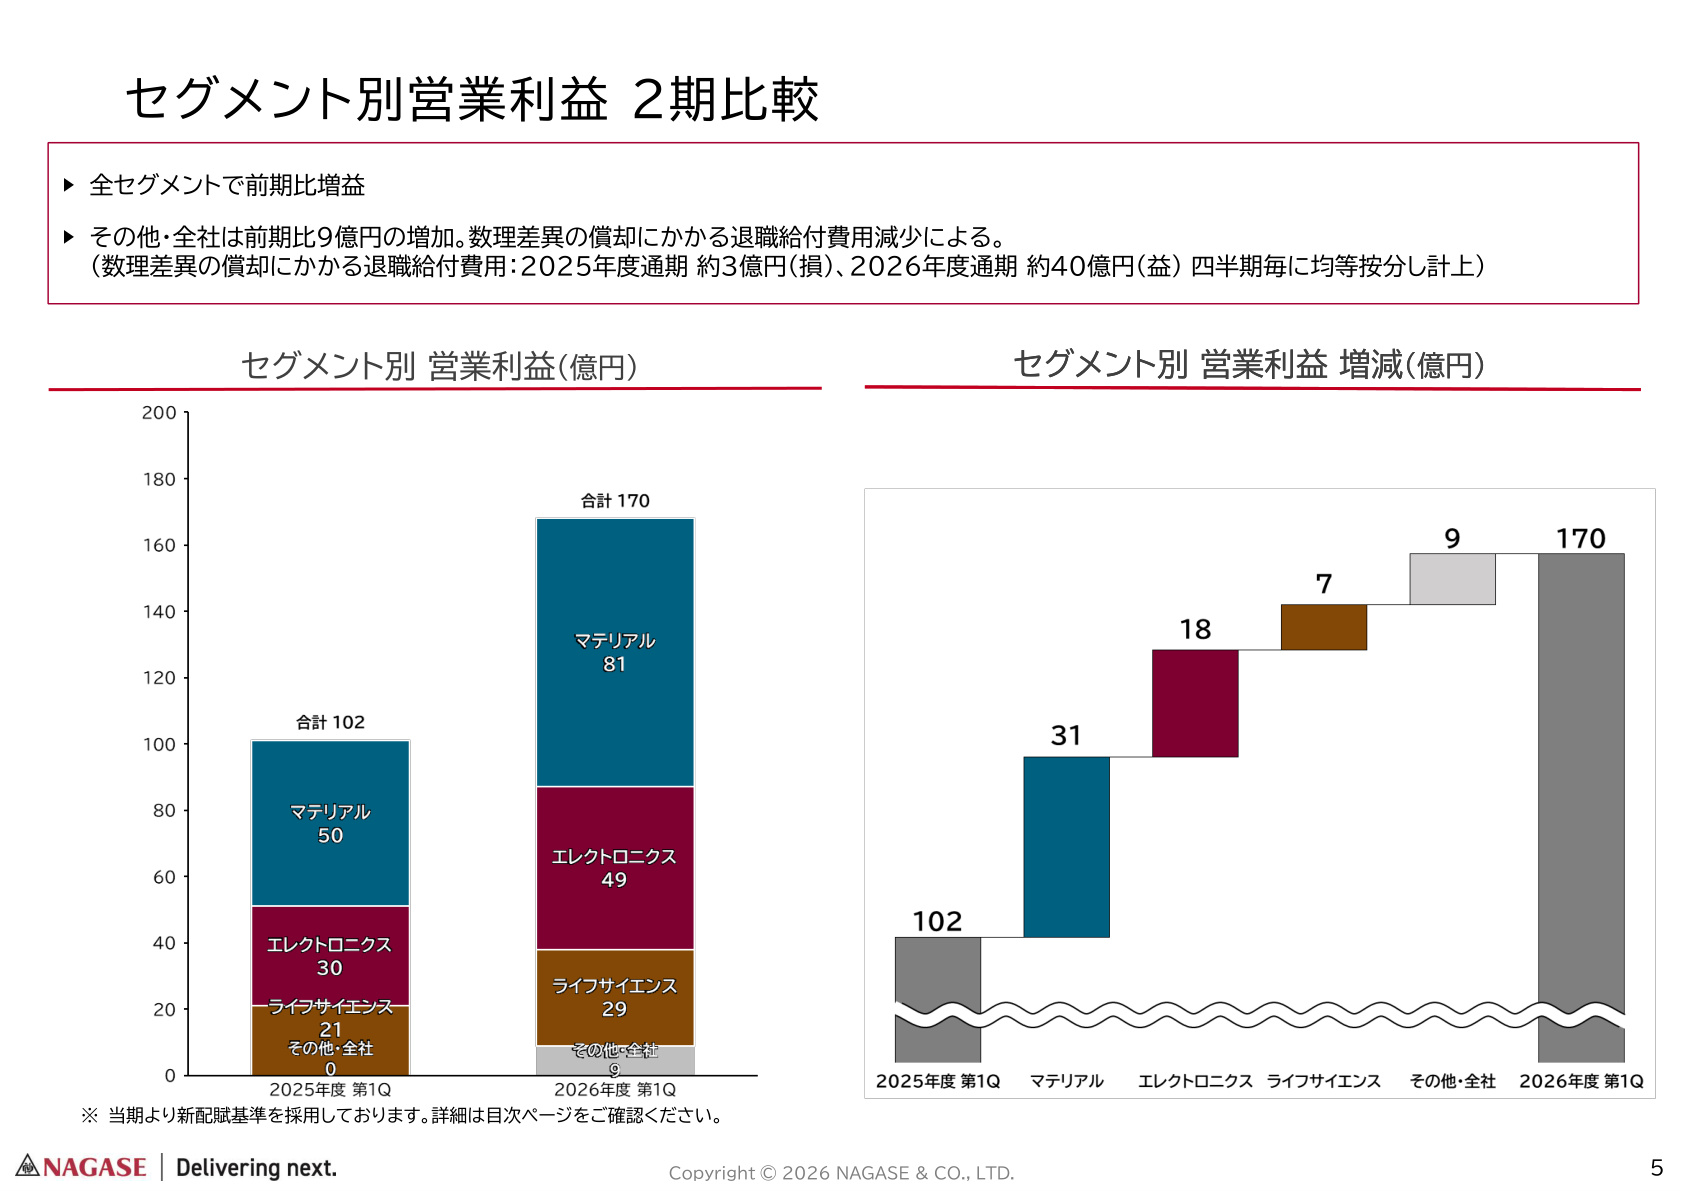
The Operating Income by Segment slide above is essential for clearly visualizing the sources of overall profit growth. The breakdown of the ¥17.0 billion in company-wide operating income (up ¥6.7 billion YoY) is as follows:
① Material Segment
- Revenue : ¥140.3 billion (up 18% YoY)
- Operating Income : ¥8.1 billion (up ¥3.1 billion / +63% YoY)
- Analysis : The segment secured high margins in the trading business amid market price increases driven by Middle East tensions. Beyond responding to customers through alternative procurement in the chemical business, the segment benefited from new adoptions of automotive resins and functional materials, as well as ongoing product mix improvements . Additionally, sales of industrial hoses and civil engineering pipes increased at the manufacturing subsidiary, Nagase Rutac.
② Electronics Segment
- Revenue : ¥49.1 billion (up 18% YoY)
- Operating Income : ¥4.9 billion (up ¥1.8 billion / +60% YoY)
- Analysis : While mobile device demand remained sluggish, this was strongly offset by demand for AI semiconductors . Sales of modified epoxy resins (e.g., LMC) , handled by the major manufacturing subsidiary Nagase ChemteX, performed better than expected. Furthermore, the expansion of Pac Tech Group's bumping contract services and increased sales of semiconductor materials in the Greater China region contributed to the results, with the operating margin improving to 10.0% (+2.6 ppt).
③ Life Sciences Segment
- Revenue : ¥90.2 billion (up 17% YoY)
- Operating Income : ¥2.9 billion (up ¥0.7 billion / +37% YoY)
- Analysis : The manufacturing business of the Prinova Group (Solutions and Nutrition businesses), primarily operating in the U.S., saw significant profit growth, driving the entire segment. Nagase Viita also offset rising raw material costs through increased sales of cosmetic ingredients. Although the trading business faced downward pressure from increased SG&A expenses such as logistics costs, the strong recovery in the manufacturing sector (operating income of ¥2.0 billion, up 206% YoY) provided powerful support for growth.
4. Financial Position and Cash Flow Structure
- Total Assets : ¥942.1 billion (up ¥70.5 billion from the end of the previous fiscal year)
- Total assets expanded due to increases in trade receivables (+¥32.6 billion) and inventories (+¥17.7 billion) associated with business expansion, as well as an increase in the fair value of investment securities (+¥12.0 billion) due to rising stock prices.
- Equity Ratio : 47.4% (down 1.4 ppt from the end of the previous fiscal year)
- Operating Cash Flow : -¥21.2 billion (down ¥21.9 billion YoY)
- While the company recorded ¥18.1 billion in quarterly profit before income taxes, the primary cause was a ¥30.6 billion increase in working capital due to the expansion of business scale.
- Free Cash Flow : -¥25.3 billion
- The company is flexibly raising funds through financial activities such as the issuance of commercial paper (+¥21.0 billion), and there are no issues regarding liquidity.
5. Full-Year Outlook and Future Focus
Nagase & Co., Ltd. has maintained its full-year earnings forecast for FY2026 at this time.
- Full-Year Revenue Forecast : ¥1,000 billion (up 3% YoY)
- Full-Year Operating Income Forecast : ¥45 billion (up 1% YoY)
- Full-Year Net Income Forecast : ¥34.5 billion (up 4% YoY)
While certain businesses, such as modified epoxy resins for AI semiconductors and Prinova's Solutions business, are showing progress exceeding expectations as of Q1, the company must carefully assess the long-term impact of Middle East tensions on market conditions and demand. The company plans to update its full-year forecast when announcing its Q2 results , after scrutinizing future market trends and customer demand.
6. Shareholder Return Policy: 17 Consecutive Years of Dividend Increases and Flexible Share Buybacks
Nagase & Co., Ltd. prioritizes shareholder returns as one of its most important management issues.
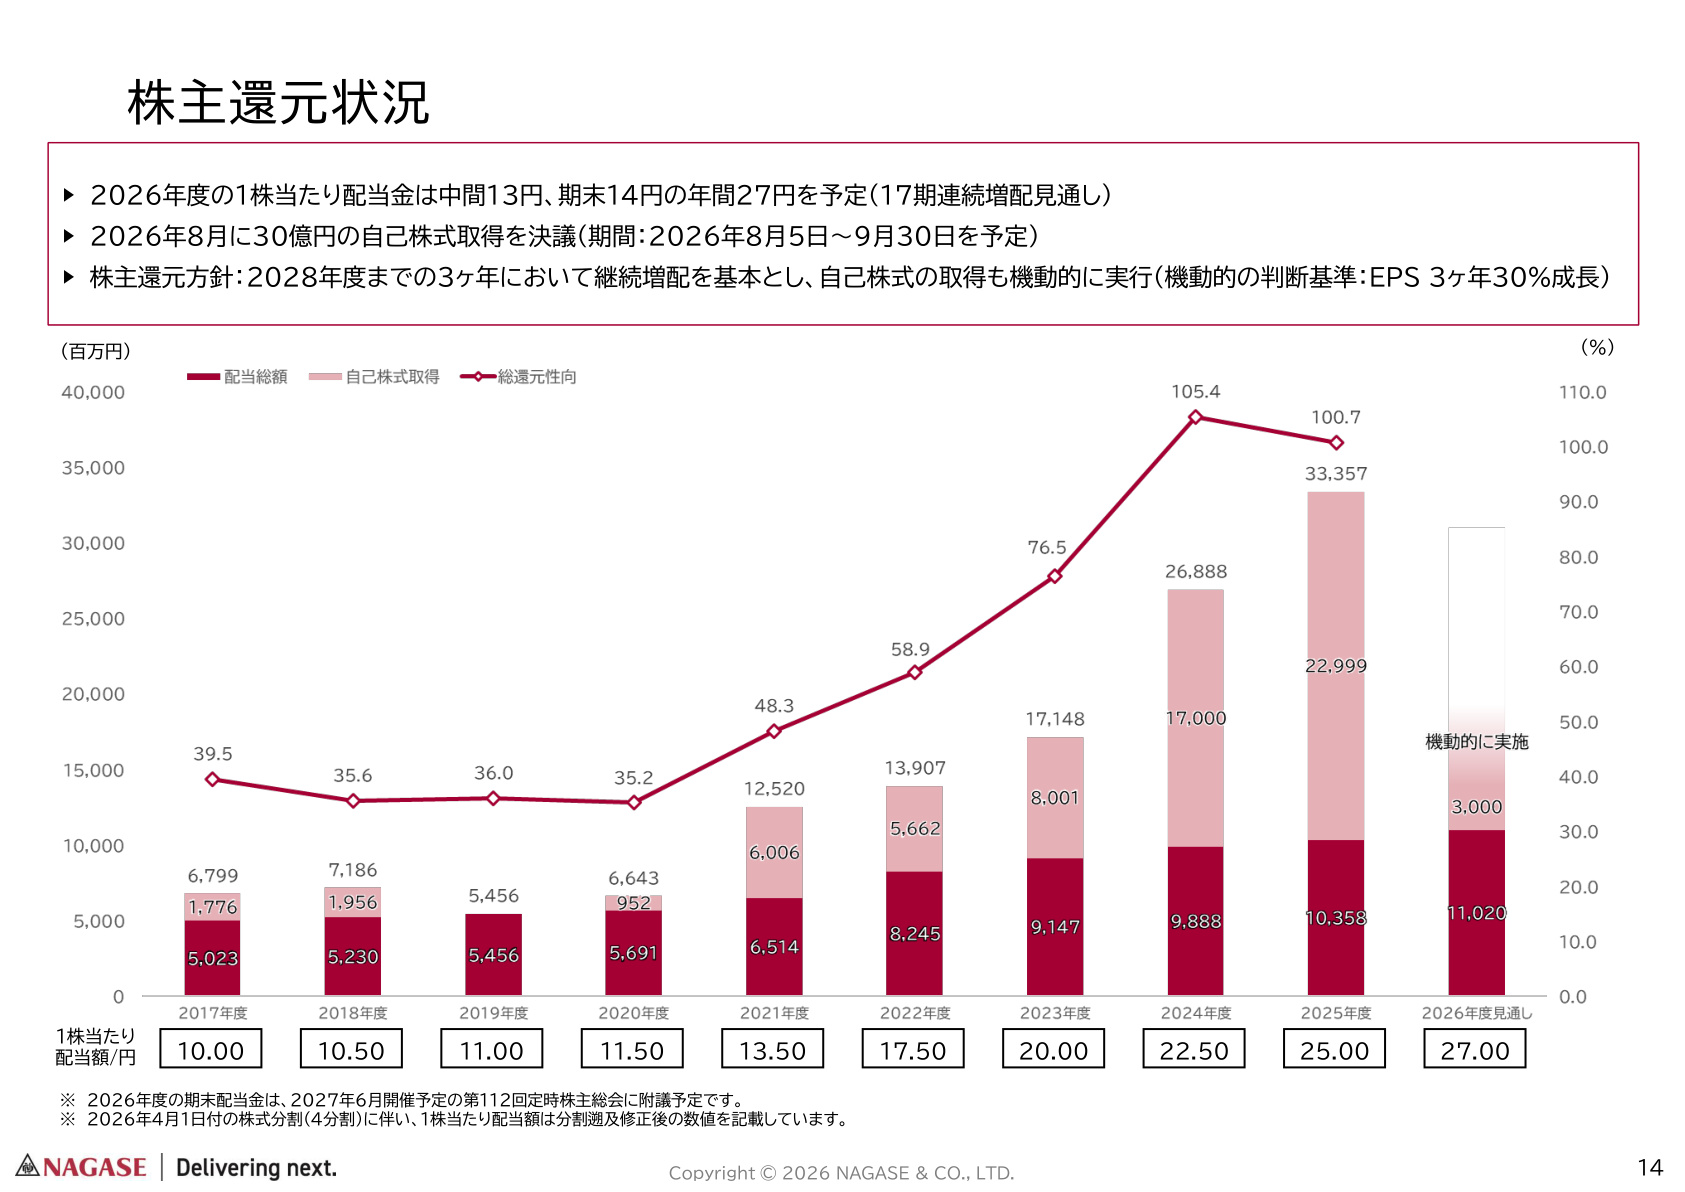
The Shareholder Returns slide above is essential for investors, as it demonstrates the company's long-term commitment to returns and the enhancement of shareholder value. Key points include:
- 17 Consecutive Years of Dividend Increases :
- The annual dividend per share for FY2026 is planned at ¥27 (¥13 interim, ¥14 year-end) (adjusted for the 1:4 stock split effective April 1, 2026). This marks the 17th consecutive year of dividend increases .
- Flexible Share Buybacks :
- In August 2026, the company resolved to repurchase up to ¥3 billion in shares (period: August 5, 2026 – September 30, 2026).
- Core Return Policy :
- The company has established an approach of "continuous dividend increases" as the baseline through FY2028, while flexibly executing share buybacks based on a "30% EPS growth over 3 years" criterion. The total return ratio has remained at a high level in recent years, reflecting a focus on capital efficiency.
7. Conclusion and Summary
Nagase & Co., Ltd.'s Q1 FY2026 earnings were of exceptionally high quality , achieving record-breaking results by leveraging its robust global network to turn an uncertain external environment—marked by geopolitical risks and supply chain turmoil—into an opportunity.
Notably, the results were not merely driven by market tailwinds; the company's hybrid "Manufacturing × Trading" model has matured into a solid earnings foundation, evidenced by the growth of high-value-added materials in the AI semiconductor field (e.g., Nagase ChemteX products) and the success of structural reforms in the Life Sciences division (e.g., Prinova) . Investors should continue to monitor the progress of the company's mid-to-long-term growth story alongside potential revisions to the full-year outlook from Q2 onwards.
This content is not intended as investment advice or a recommendation. Any opinions expressed are solely the personal views of each article.