


Tadano H1 FY2026 Earnings Deep Dive: Strong Profit Growth Driven by TIS Acquisition and Pricing Improvements

StockClub
Published: Aug 04, 2026, 10:01 AM
Sentiment Analysis
Tadano Ltd.'s consolidated financial results for the first half (January–June) of FY2026 were exceptionally strong, with both net sales and operating income significantly exceeding the same period last year. The primary drivers include the contribution of the new "Stationary LE" product category following the consolidation of TIS (Tadano Infrastructure Solutions) , the absence of M&A-related costs incurred in the previous fiscal year, as well as multiple profit-boosting factors such as improved selling prices and U.S. tariff refunds.
This report provides a comprehensive and detailed analysis of the earnings, focusing on 10 key topics derived from the financial materials, including performance highlights, factors behind operating income fluctuations, segment and regional market trends, financial structure, and the full-year outlook.
1. H1 FY2026 Earnings Highlights: Significant Growth in Sales and Profit
Performance for the January–June 2026 period recorded substantial growth compared to the same period last year.
- Net Sales : ¥182.581 billion (+10.8% YoY / +¥17.79 billion)
- Operating Income : ¥14.878 billion (+82.1% YoY / +¥6.707 billion)
- Ordinary Income : ¥13.515 billion (+135.4% YoY / +¥7.773 billion)
- Net Income Attributable to Owners of the Parent : ¥10.731 billion (+177.1% YoY / +¥6.858 billion)
- EBITDA : ¥19.988 billion (+54.3% YoY / +¥7.035 billion)
The increase in net sales was primarily driven by the consolidation of TIS , as discussed later. On the profit front, in addition to the effects of higher sales, the results were bolstered by extraordinary gains, including U.S. tariff refunds related to prior-year filings and the reversal of expenses related to factory restructuring in Europe, leading to a 2.8-fold increase in net income compared to the same period last year.
2. Analysis of Operating Income Fluctuations: Elimination of One-time Costs and Structural Improvements
The significant growth in operating income from ¥8.171 billion to ¥14.878 billion year-on-year is the result of a complex interplay between the elimination of one-time factors and structural improvements in operations.
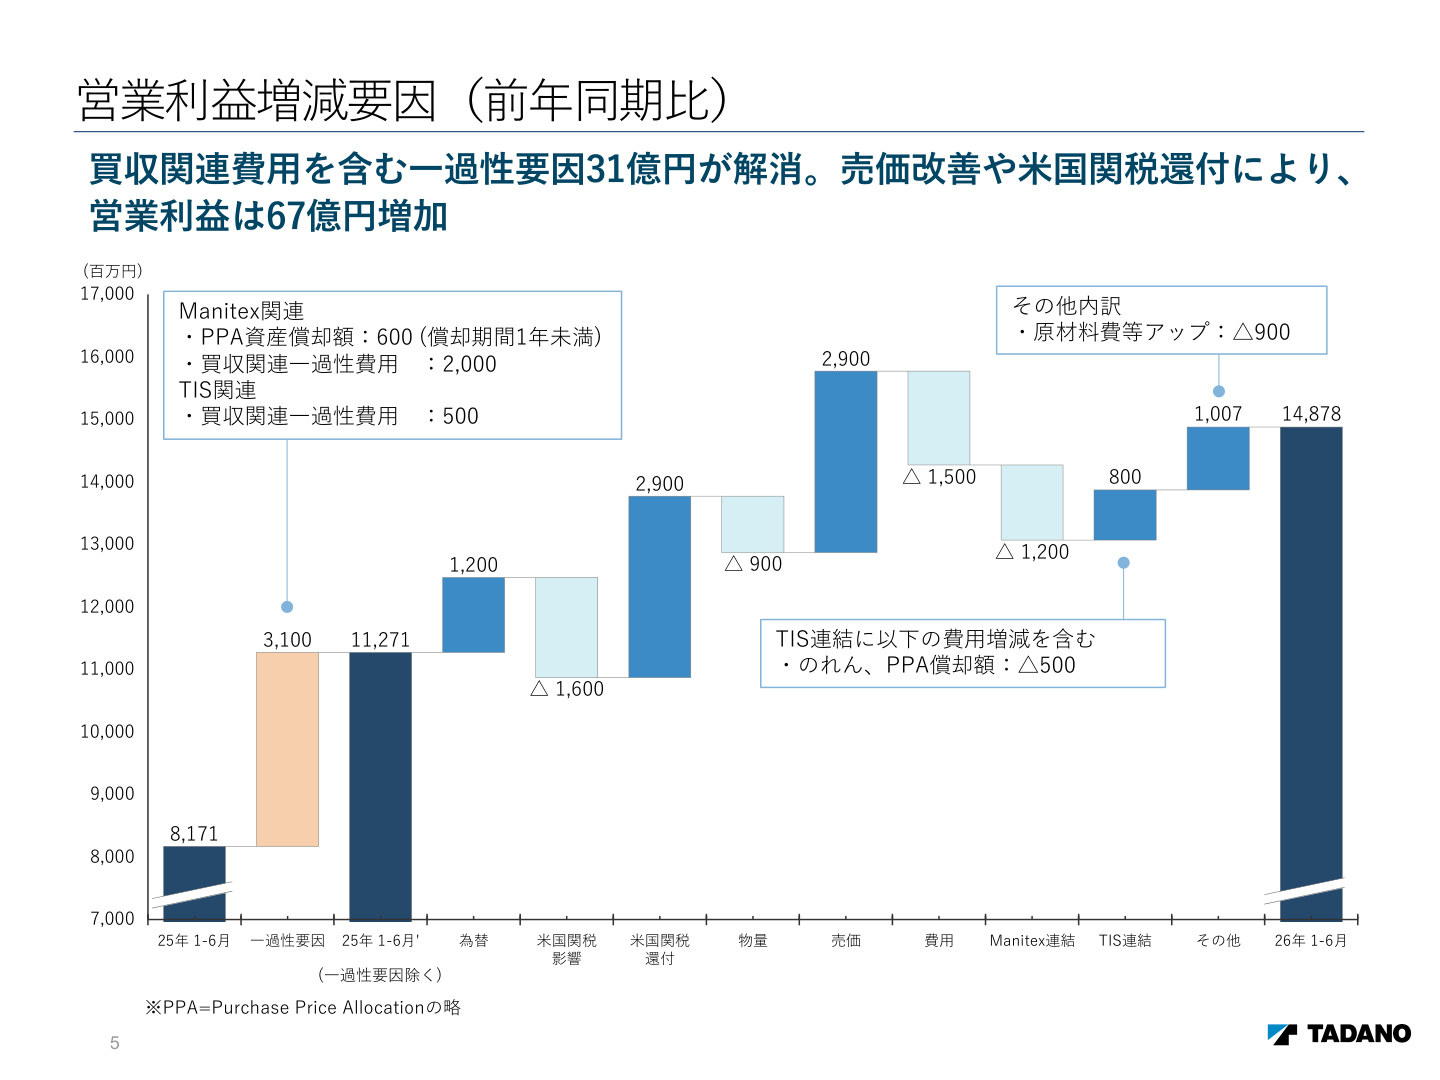
The slide above illustrates the factors behind the operating income fluctuations using a waterfall chart. Key points to note when interpreting this chart are as follows:
- Elimination of One-time Factors (+¥3.1 billion) : In the same period last year, one-time costs associated with the acquisitions of Manitex and TIS (¥2.5 billion in acquisition-related costs and ¥0.6 billion in PPA asset amortization) were incurred. The elimination of these costs in the current period serves as a base for the substantial profit improvement.
- Positive Impact of U.S. Tariff Refunds (+¥2.9 billion) : The receipt of tariff refunds directly boosted profits.
- Pricing Improvements (+¥2.9 billion) : Despite cost-push factors such as rising raw material costs (-¥0.9 billion) and company-wide expense increases (-¥1.5 billion), the pricing improvement effect (+¥2.9 billion) —driven by continuous price pass-throughs and price optimization—fully absorbed these pressures.
- Impact of Exchange Rates and Volume : While exchange rate fluctuations had a positive impact of +¥1.2 billion, changes in shipment volume (volume effect) acted as a negative factor of -¥0.9 billion.
Even excluding these one-time factors, it is evident that the underlying earning power has steadily improved from ¥11.271 billion to ¥14.878 billion .
3. Regional Sales Trends: Growth in Japan and Slowdown in the Middle East
Looking at sales trends by region, the impact of group consolidation and geopolitical risks is clearly visible.
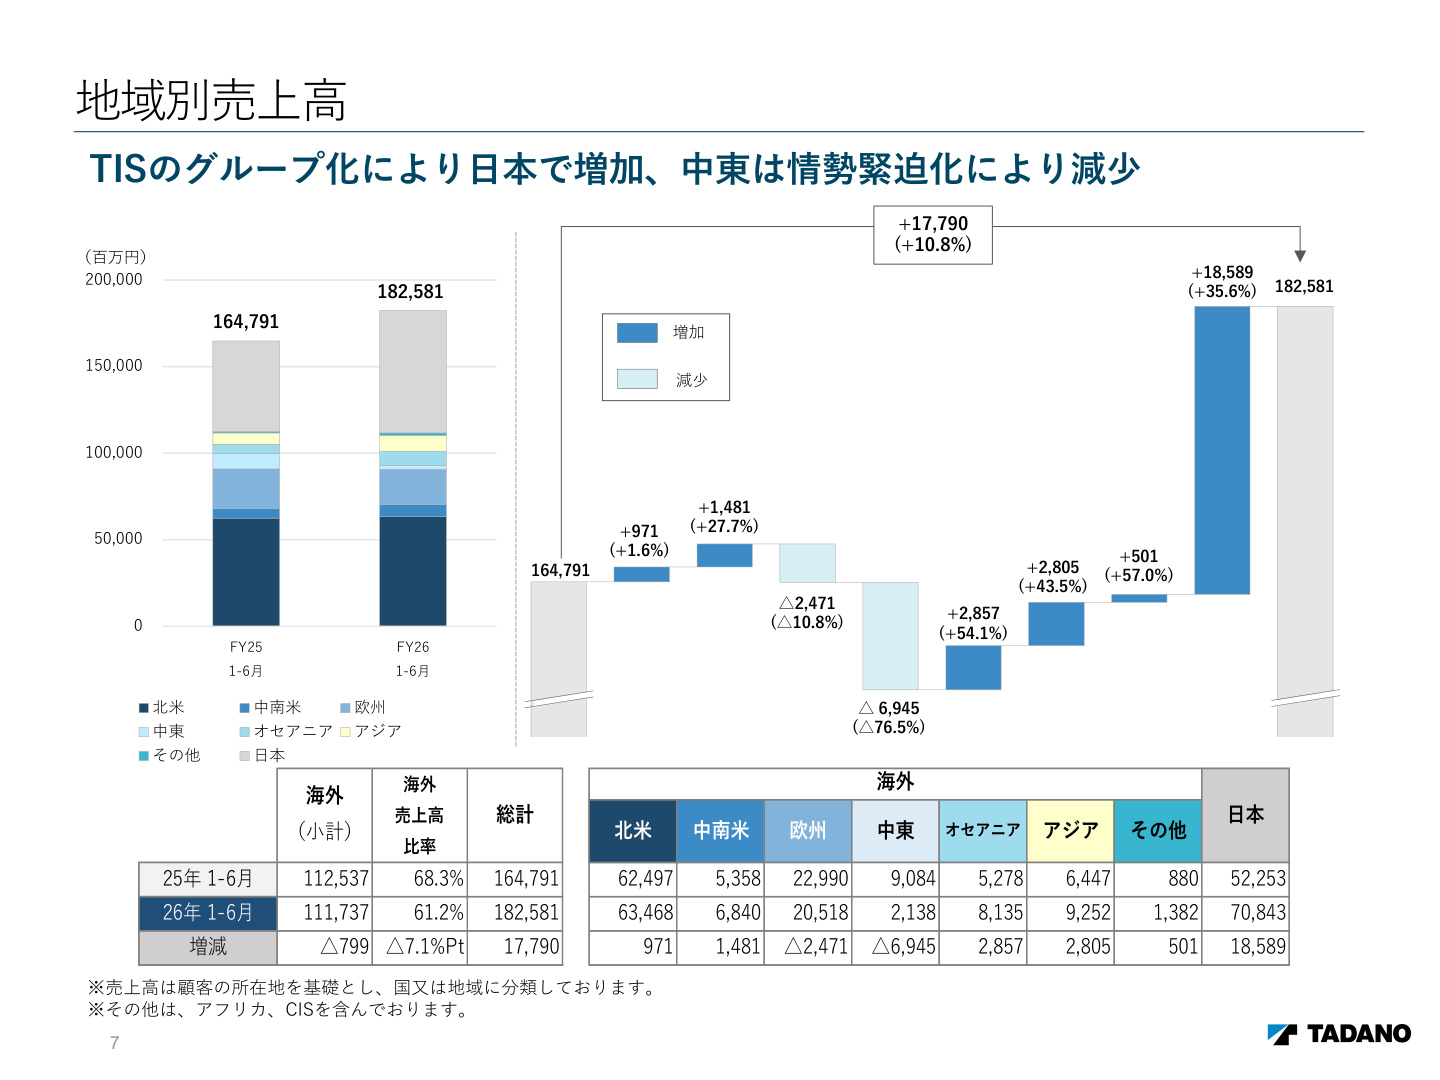
This slide reveals the demand environment and shifts in the sales mix across each region:
- Japan Market : Net sales of ¥70.843 billion (+35.6% YoY / +¥18.589 billion). The new consolidation of TIS added sales from "Stationary LE" (jib cranes, etc.), driving overwhelming growth. Demand for aerial work platforms remained solid among existing mobile products.
- North America Market : Net sales of ¥63.468 billion (+1.6% YoY / +¥0.971 billion). High sales levels were maintained, supported by capital investment demand, including for data centers.
- Middle East Market : Net sales of ¥2.138 billion (-76.5% YoY / -¥6.945 billion). Due to heightened tensions in the Middle East , shipments were delayed, and the absence of large-scale deals seen in the same period last year led to a significant decline in sales.
- Europe Market : Net sales of ¥20.518 billion (-10.8% YoY / -¥2.471 billion). Although market demand shows signs of recovery, the competitive and order environment remains challenging, particularly in major countries.
- Oceania & Asia Markets : Oceania grew by ¥8.135 billion (+54.1%) and Asia by ¥9.252 billion (+43.5%) , both showing strong growth.
The overseas sales ratio fell from 68.3% in the same period last year to 61.2% . This is not due to a slowdown in overseas markets, but rather a structural change caused by the significant boost from the TIS consolidation in Japan.
4. Detailed Analysis by Product Segment
(1) Construction Cranes (RT/AT)
- Net Sales : ¥102.7 billion (-0.4% YoY / -¥0.4 billion)
- Trends : Despite the impact of chronic operator shortages and rising material costs in Japan, demand remained solid due to the execution of large-scale construction projects. North America also remained steady due to data center investments. However, overall performance remained flat due to shipment delays in the Middle East and sluggish growth in Europe.
(2) Truck-Mounted Cranes (Manitex, etc.)
- Net Sales : ¥19.7 billion (+2.0% YoY / +¥0.4 billion)
- Trends : While demand in Japan declined due to the transition to new truck chassis models and rising vehicle prices, overseas sales of Manitex products (boom trucks for North America) and PM Oil&Steel products (knuckle boom cranes for Europe) grew, offsetting the domestic decline.
(3) Aerial Work Platforms (TUL, etc.)
- Net Sales : ¥15.8 billion (+11.3% YoY / +¥1.6 billion)
- Trends : In addition to steady demand and sales to rental companies and the telecommunications industry in Japan, the strengthening of overseas sales structures led to the acquisition of new customers for TUL (Tadano Utility) products in North America and Europe.
(4) Stationary LE (New Segment)
- Net Sales : ¥15.19 billion (Zero in the same period last year)
- Trends : TIS (formerly the transport system business of IHI Transport Machinery), which joined the group in July 2025, contributed to sales as Stationary LE (jib cranes, etc.), accelerating the diversification of the product portfolio.
5. Order Backlog and Demand Trends: Maintaining a High Level of Backlog
Trends in orders and backlogs for core construction cranes (Rough Terrain: RT, All Terrain: AT) are essential indicators for forecasting future performance.
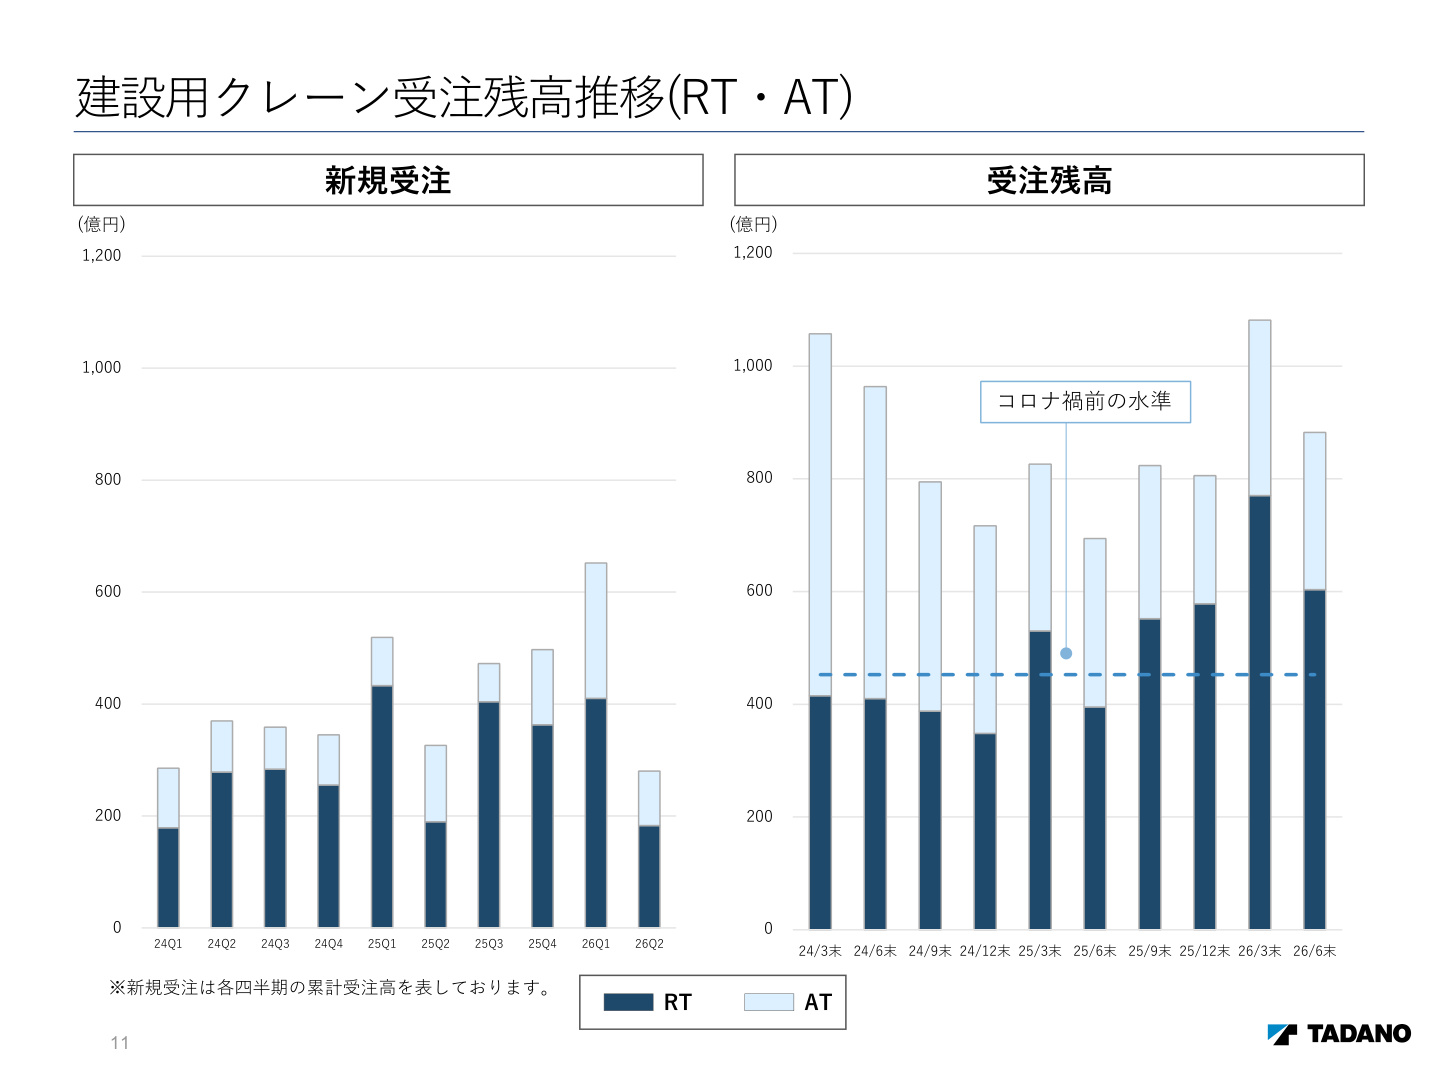
The slide above shows the trends in new orders and order backlogs for construction cranes.
- Order Backlog Trend : While the backlog has settled slightly from the extremely high level of over ¥110 billion in the previous quarter (end of March 2026), it remains at a scale of approximately ¥90 billion as of the end of June 2026 . Compared to the " pre-COVID level " (approx. ¥45 billion) indicated by the dotted line on the graph, it is nearly double, indicating a still-abundant backlog.
- Composition by Model : In recent years, the backlog for RT (Rough Terrain Cranes) has accumulated significantly, supporting global demand.
- Market Demand Outlook : Global demand for the January–June 2026 period is projected at 8,240 units (+4.4% YoY). While Asia (+37.2%) and Europe (+7.9%) are driving growth, the Middle East (-19.5%) and North America (-5.1%) are seeing a period of adjustment.
6. Financial Position and Free Cash Flow (FCF) Analysis
The balance sheet (B/S) and cash flow (C/F) statements confirm changes in working capital and financial health.
- Increase in Inventories : Total assets were ¥451.815 billion (-¥6.784 billion from the end of the previous fiscal year). While the collection of trade receivables progressed (-¥13.191 billion), inventories increased to ¥171.886 billion (+¥15.17 billion from the end of the previous fiscal year) due to the shift of sales for North America and the Middle East to the second half. Consequently, the inventory turnover period has lengthened from 223.2 days to 246.0 days.
- Reduction of Interest-Bearing Debt : Interest-bearing debt decreased to ¥136.355 billion (-¥9.661 billion from the end of the previous fiscal year). The net D/E ratio is 0.30x (0.31x at the end of the previous fiscal year), maintaining a sound financial structure.
- Free Cash Flow (FCF) : Operating cash flow turned significantly positive to ¥7.628 billion (compared to -¥5.825 billion in the same period last year) due to the expansion of pre-tax income. After deducting investment cash flows such as capital expenditures (-¥7.149 billion), FCF secured a cash inflow of ¥4.76 billion (+¥3.655 billion YoY).
7. Full-Year Earnings Forecast and Dividend Plan: Forecasts Maintained, FX Assumptions Revised
Tadano has maintained its initial full-year consolidated earnings forecast for the fiscal year ending December 2026.
- Net Sales Forecast : ¥400 billion (+14.5% YoY)
- Operating Income Forecast : ¥25 billion (+34.7% YoY)
- Ordinary Income Forecast : ¥22 billion (+45.7% YoY)
- Net Income Attributable to Owners of the Parent Forecast : ¥14 billion (-23.5% YoY)
- Annual Dividend Forecast : ¥34.0 per share (Interim ¥17.0, Year-end ¥17.0, Payout ratio 30.7%)
Background for Maintaining Forecasts and Revision of Assumptions : Although there were profit-boosting factors in the first half, such as U.S. tariff refunds and the depreciation of the yen, the company has maintained its full-year forecast with a cautious stance, considering the uncertainty caused by heightened tensions in the Middle East and the risk of shipment delays.
Regarding the assumed exchange rates from July onwards, the rates have been revised to reflect current market conditions, moving from the previous assumptions (¥152/USD, ¥180/EUR) to ¥158.0/USD and ¥184.0/EUR .
8. Summary and Comprehensive Analysis
Tadano's H1 FY2026 results demonstrate that the integration effects of past M&As (Manitex, TUL, TIS) are now fully reflected in the figures. Combined with pricing improvements to counter rising costs and the elimination of one-time expenses, the company has achieved significant profit growth.
Despite external concerns such as geopolitical risks in the Middle East, logistics delays, and demand adjustments in certain regions, the high level of order backlog (well above pre-COVID levels), the expansion of the business foundation through the newly established Stationary LE segment , and improved cash flow generation capabilities provide a solid foundation for the second half.
This content is not intended as investment advice or a recommendation. Any opinions expressed are solely the personal views of each article.