


Detailed Analysis of Sumitomo Osaka Cement's Q1 FY2026 Financial Results and Full-Year Outlook

StockClub
Published: Aug 04, 2026, 09:59 AM
Sentiment Analysis
This report provides a comprehensive summary of the Q1 FY2026 (fiscal year ending March 31, 2027) financial results for Sumitomo Osaka Cement Co., Ltd. (announced on August 4, 2026), covering performance highlights, segment-specific status, full-year outlook, and mid-to-long-term growth strategies and investor engagement initiatives.
1. Q1 FY2026 Financial Highlights: Significant Operating Profit Growth Driven by Cement Business Recovery
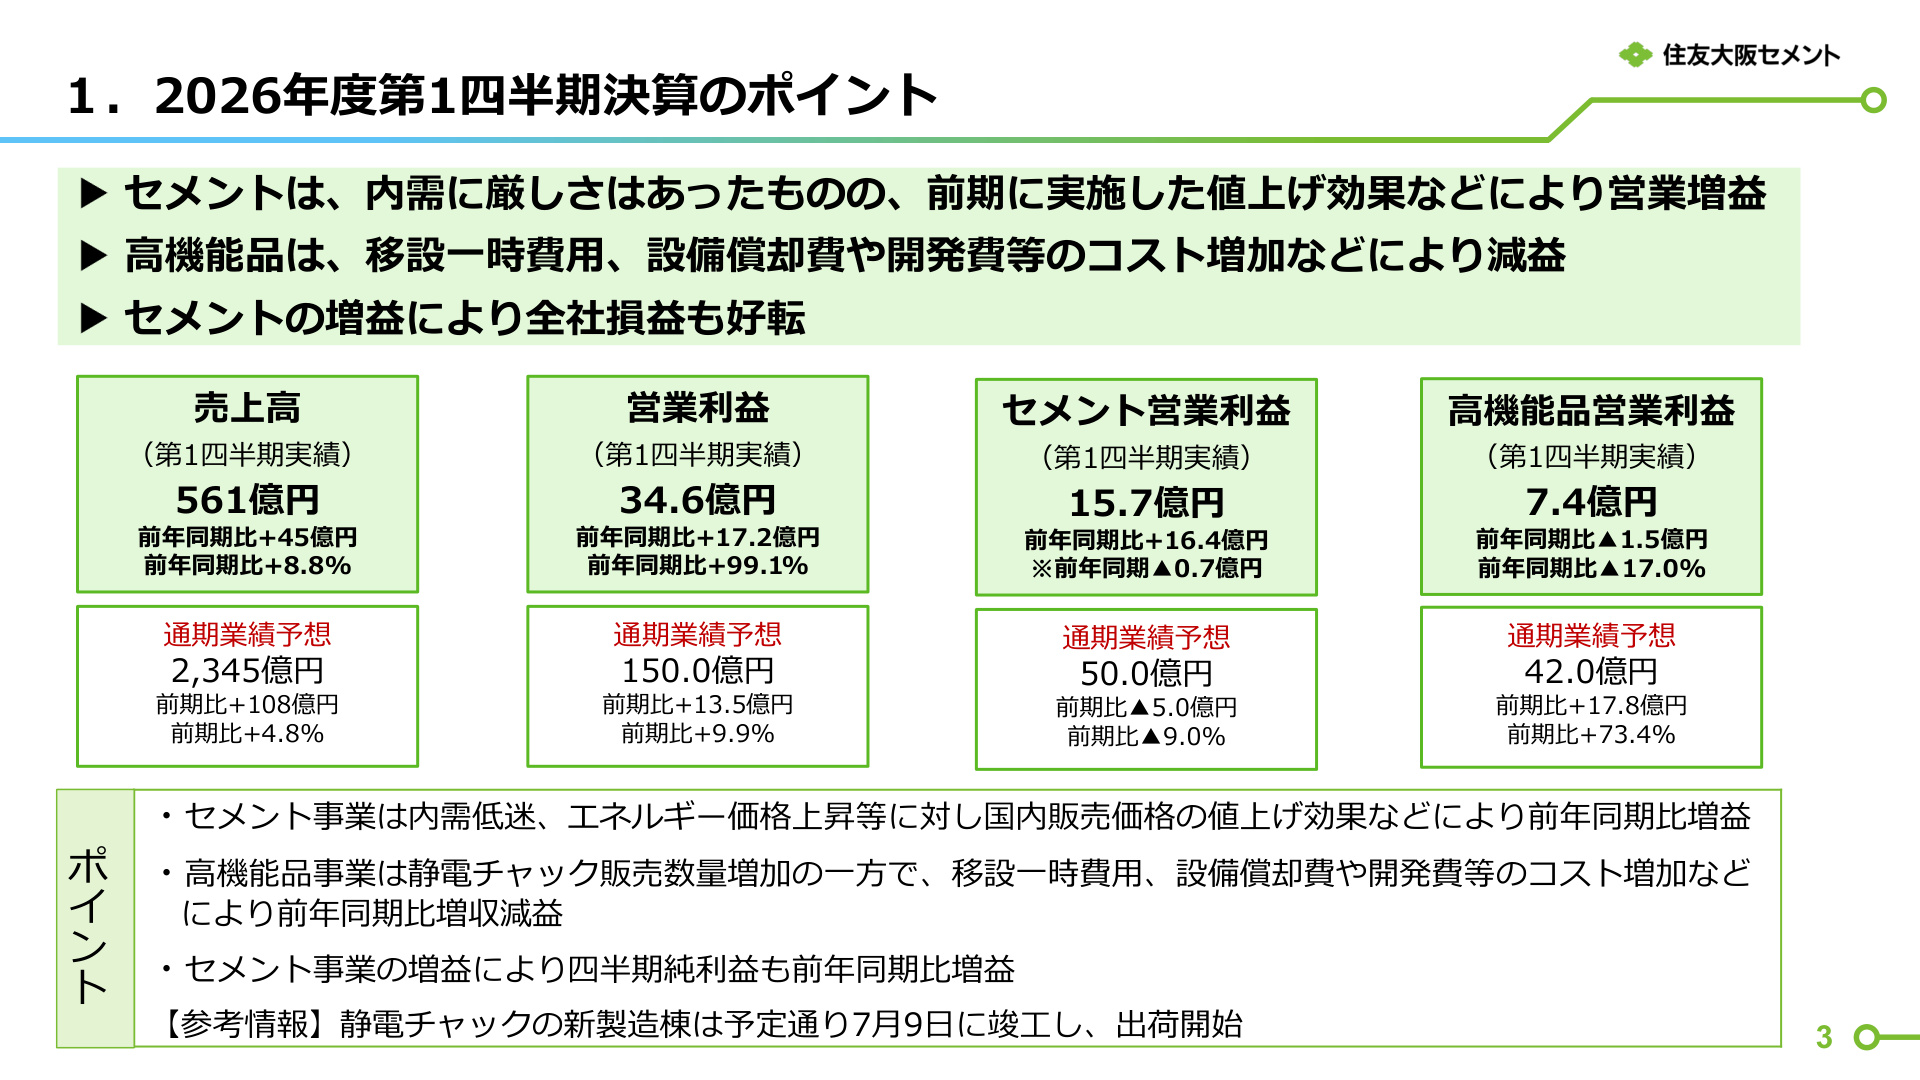
In the first quarter of FY2026, the company achieved strong growth in both revenue and profit. Consolidated net sales reached ¥56.1 billion (+¥4.5 billion, +8.8% YoY) , and operating profit rose to ¥3.46 billion (+¥1.72 billion, +99.1% YoY) . Ordinary profit reached ¥3.59 billion (+¥1.67 billion, +87.0% YoY) , and quarterly net profit stood at ¥2.20 billion (+¥0.72 billion, +48.3% YoY) .
Commentary and Significance of the Slide
This slide serves as a vital overview, allowing stakeholders to grasp the overall Q1 performance and key metrics at a glance. It clearly illustrates how the "profit growth in the cement business improved overall company earnings." Despite the challenging environment of stagnant domestic demand, the cement business saw a dramatic turnaround in operating profit—from a loss of ¥0.07 billion in the same period last year to a profit of ¥1.57 billion —largely due to the impact of domestic price hikes implemented in the previous fiscal year . Conversely, the High-Performance Products business, positioned as a growth driver, saw a decline in profit (¥0.74 billion, -17.0% YoY) due to increased costs, including relocation expenses, equipment depreciation, and R&D expenditures , despite an increase in sales volume for electrostatic chucks.
2. Trends in Domestic Cement Demand and Sales Volume
Domestic cement demand remains sluggish due to factors such as rising construction material costs and labor shortages. The full-year forecast for domestic cement demand in FY2026 is expected to continue its downward trend at 30.00 million tons (compared to 30.53 million tons in the previous year), with Q1 results coming in at 7.21 million tons .
- Domestic Sales Volume (Full-Year Forecast) : 6.789 million tons (Previous year: 6.971 million tons; Q1: 1.671 million tons)
- Export Volume (Full-Year Forecast) : 1.600 million tons (Previous year: 1.375 million tons; Q1: 0.378 million tons)
In response to declining domestic demand, the company is pushing forward with initiatives to maintain and improve profitability through expanded exports and the firm establishment of price revisions.
3. Profit Structure and Variance Analysis of the Cement Business
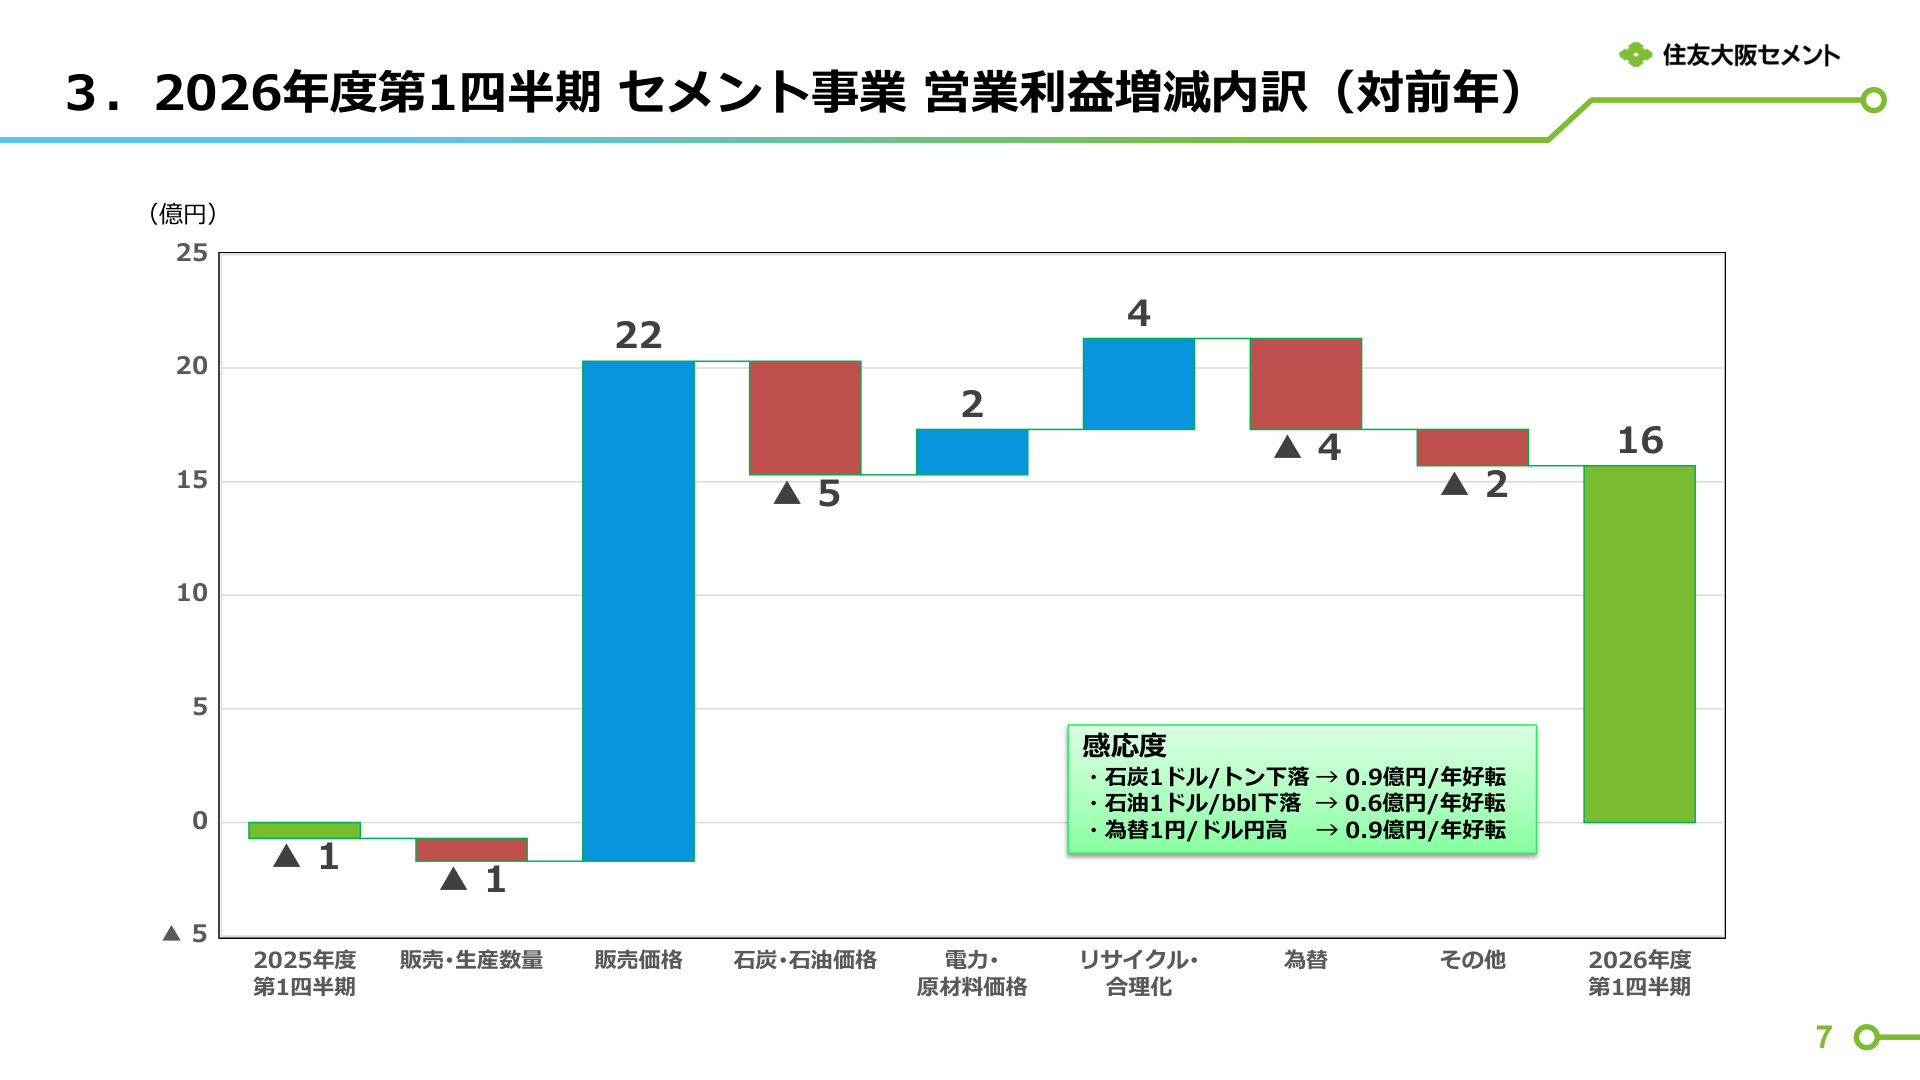
A detailed breakdown of the operating profit variance in the cement business for Q1 (+¥1.64 billion YoY) highlights the key drivers of earnings improvement.
Commentary and Significance of the Slide
The slide above uses a waterfall chart to decompose the factors behind the operating profit fluctuations in the cement business. The primary driver of earnings improvement was the impact of price revisions (+¥2.2 billion) , which successfully absorbed negative factors such as rising raw material and fuel costs.
Specific breakdown of factors:
- Sales/Production Volume : -¥0.1 billion (minor negative impact due to sluggish demand)
- Sales Price : +¥2.2 billion (solid penetration of price hikes)
- Coal/Oil Prices : -¥0.5 billion (increased fuel cost burden)
- Electricity/Raw Material Prices : +¥0.2 billion (cost-cutting efforts, etc.)
- Recycling/Rationalization : +¥0.4 billion (profitability from increased waste acceptance)
- Foreign Exchange Impact : -¥0.4 billion (increased procurement costs due to yen depreciation)
- Other : -¥0.2 billion
Regarding sensitivity to raw material and fuel prices (annual impact), the structure is such that a $1/t drop in coal prices yields +¥0.09 billion , a $1/bbl drop in oil prices yields +¥0.06 billion , and a ¥1/dollar appreciation yields +¥0.09 billion in profit improvement.
4. Q1 Performance by Segment and Investment Phase of High-Performance Products
Q1 performance by segment is as follows:
- Cement Business : Net sales of ¥39.5 billion (+7.7%), operating profit of ¥1.57 billion (turnaround from a loss of ¥0.07 billion). Price revisions contributed significantly.
- Mineral Products Business : Net sales of ¥4.6 billion (+11.0%), operating profit of ¥0.76 billion (+37.5%). Growth driven by price hikes.
- Construction Materials Business : Net sales of ¥4.9 billion (+4.3%), operating profit of -¥0.02 billion (improved from -¥0.06 billion). Contributed by increased sales of concrete secondary products.
- High-Performance Products Business : Net sales of ¥6.2 billion (+18.5%), operating profit of ¥0.74 billion (-17.0%).
- New Materials (Electrostatic Chucks, etc.) : Net sales of ¥5.4 billion (+17.3%), operating profit of ¥0.64 billion (-28.9%). While sales grew due to demand for electrostatic chucks, profit declined due to depreciation, one-time expenses, and R&D costs associated with the operation of the new manufacturing building.
- Optoelectronics : Net sales of ¥0.8 billion (+26.7%), operating profit of ¥0.1 billion (turnaround from a loss of ¥0.01 billion).
The profit decline in the High-Performance Products business is largely structural and temporary due to upfront investments. The new manufacturing building for electrostatic chucks was completed and began shipping on July 9 as scheduled , with expectations for expanded production capacity and earnings contributions from the second half of the fiscal year.
5. FY2026 Full-Year Earnings Forecast: Initial Projections Maintained
Due to lingering uncertainties regarding foreign exchange and energy prices, the company has maintained its initial forecast (announced on May 13) . Progress in Q1 has been favorable, and efforts are underway to ensure steady achievement and potential upside.
- Net Sales : ¥234.5 billion (+4.8% YoY)
- Operating Profit : ¥15.0 billion (+9.9% YoY)
- Ordinary Profit : ¥14.5 billion (+0.7% YoY)
- Net Profit Attributable to Owners of Parent : ¥10.0 billion (-10.8% YoY)
- Dividend per Share : ¥60 (Interim) / ¥20 (Year-end: based on 1:3 stock split)
Full-Year Variance Breakdown and Growth Scenario for High-Performance Products
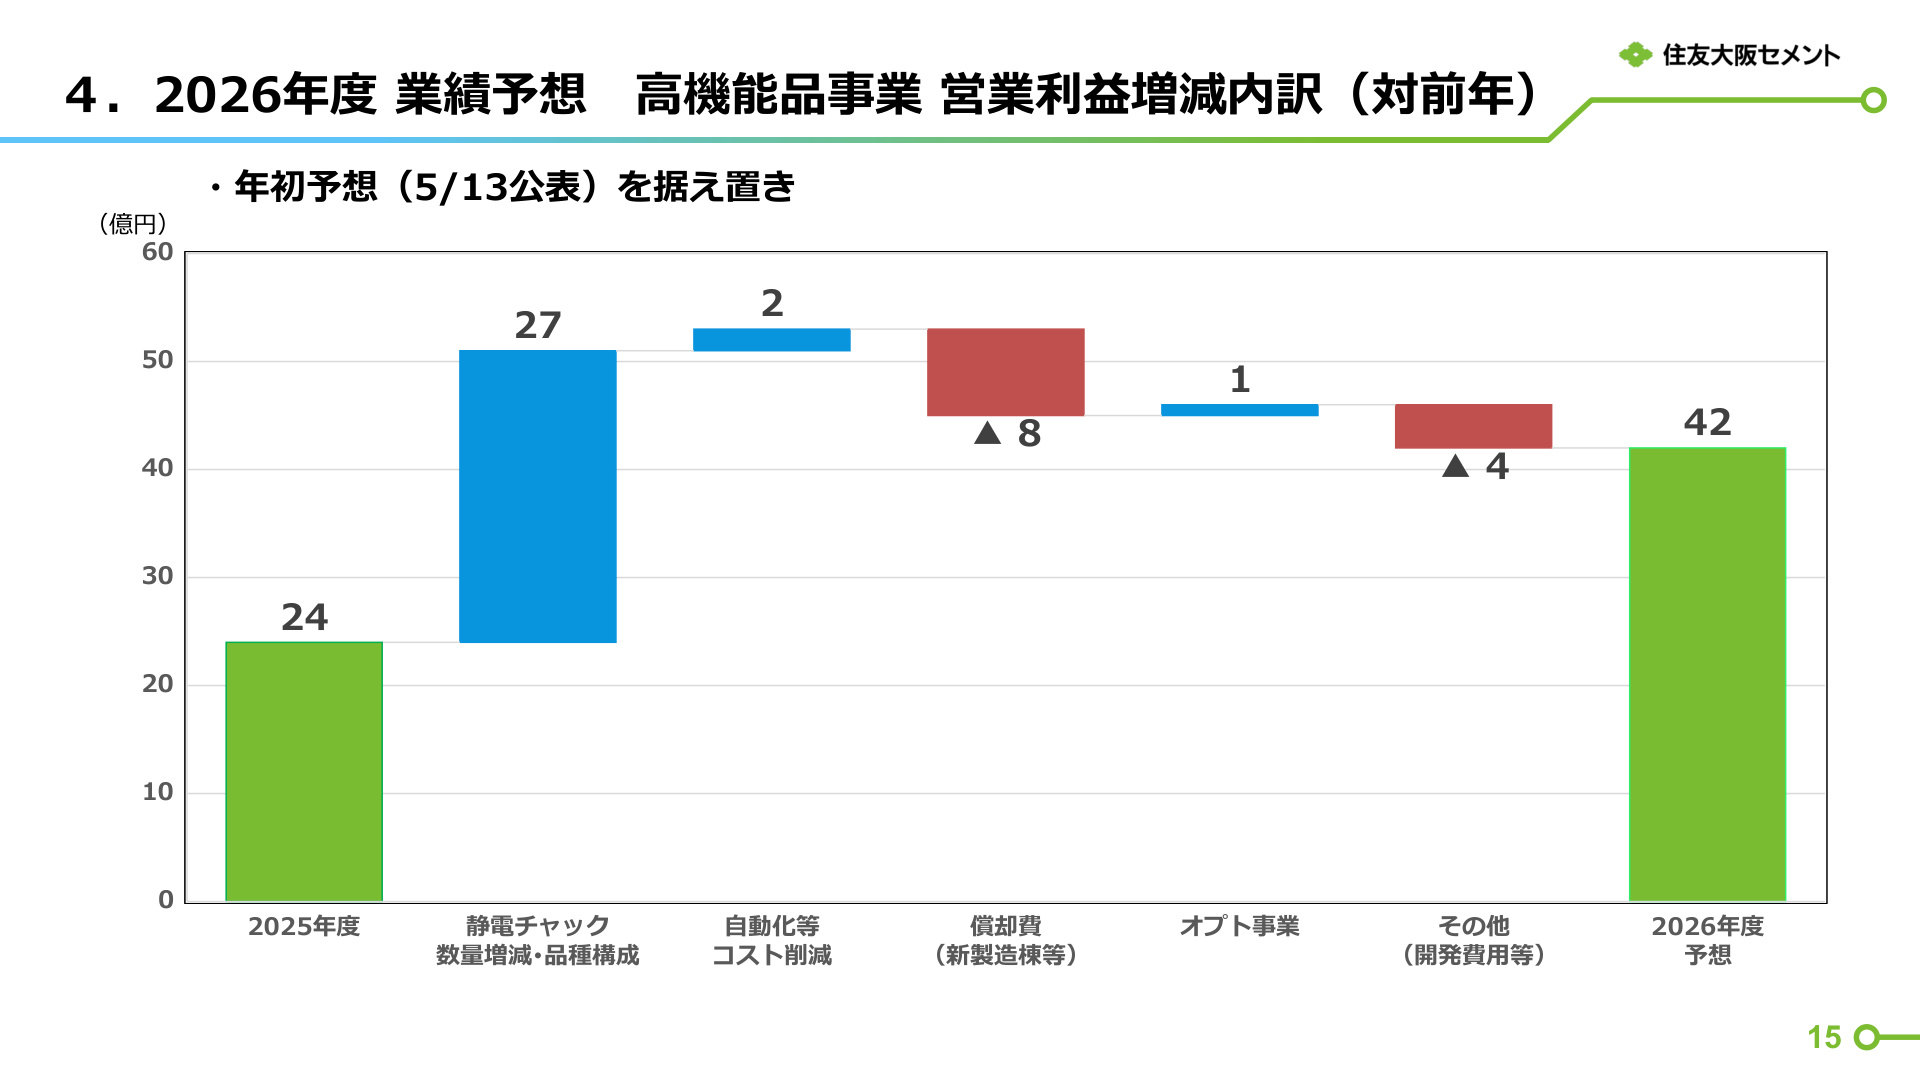
The High-Performance Products business is projected to see significant expansion, with net sales of ¥28.3 billion (+36.0% YoY) and operating profit of ¥4.2 billion (+73.4% YoY) .
Commentary and Significance of the Slide
This slide outlines the growth story for the focus area of High-Performance Products, projecting a significant profit increase from ¥2.4 billion in the previous year to ¥4.2 billion (+¥1.8 billion) . Growth will be driven by increased volume and improved product mix of electrostatic chucks (+¥2.7 billion) amid the recovery of the semiconductor market, alongside cost reductions through automation (+¥0.2 billion) . The plan is to achieve high growth by fully absorbing cost increases such as depreciation (-¥0.8 billion) and R&D expenses (-¥0.4 billion) associated with the new manufacturing building.
6. Financial Position, Management Metrics, and Shareholder Return Policy
Capital Efficiency and Target Metrics
Comparison of targets for the Mid-Term Management Plan (FY2028) and the full-year forecast:
- ROE (Return on Equity) : FY2026 forecast 5.0% (Mid-term target: 9.0% or higher)
- ROIC (Return on Invested Capital) : FY2026 forecast 3.5% (Mid-term target: 6.0% or higher)
- Total Return Ratio : FY2026 forecast 38% (3-year average target: 50% or higher )
Stock Split and Dividend Policy
A 1-for-3 stock split is scheduled to take effect on October 1, 2026. Accordingly, the minimum annual dividend (previously ¥120) has been adjusted to ¥40 post-split to ensure no substantive change. This demonstrates a clear commitment to stable returns despite earnings volatility.
7. Strengthening Governance, Sustainability, and Engagement
Based on dialogue with investors, the company is advancing the following structural reforms and disclosure enhancements:
- Introduction of ROIC by Business : Setting hurdle rates for each business to manage profitability and facilitate understanding of portfolio transformation.
- Enhanced Disclosure for High-Performance Products : Publishing detailed analyses of operating profit variance to visualize growth potential.
- Sustainability (SOCN2050 Version 2.0) : Revised the roadmap toward carbon neutrality in May 2026. Promoting decarbonization management by expanding the scope of interim reduction targets and establishing new FY2035 targets (combining innovation and transition measures).
Conclusion
In Q1 FY2026, Sumitomo Osaka Cement’s performance was strongly driven by earnings improvements in the cement business resulting from price revisions. Moving forward, the full-scale contribution of the High-Performance Products business (electrostatic chucks) , following the operation of the new manufacturing building, will strengthen the growth foundation for mid-to-long-term business portfolio transformation and improvements in ROE/ROIC.
This content is not intended as investment advice or a recommendation. Any opinions expressed are solely the personal views of each article.