


Tosoh Corporation Q1 FY2026 Earnings Analysis: Strategic Segment Realignment, Diversified Revenue Structure, and Shareholder Returns

StockClub
Published: Aug 04, 2026, 09:56 AM
Sentiment Analysis
Tosoh Corporation Q1 FY2026 Earnings Deep-Dive Report
Tosoh Corporation’s financial results for the first quarter of fiscal year 2026 (April 1, 2025 – June 30, 2025) demonstrate significant growth in both revenue and profit . This performance was driven by rising overseas market conditions due to heightened tensions in the Middle East, surging naphtha prices, and the continued depreciation of the Japanese yen. Furthermore, starting this fiscal year, the company has implemented a restructuring of its business segments to clarify its growth strategy and business portfolio, effectively reorganizing its revenue pillars from basic materials to high-performance and advanced materials.
This report provides a comprehensive analysis of the key data and business developments presented in the earnings materials, detailing performance trends, segment-specific results, full-year forecasts, financial structure, and shareholder return policies.
1. Earnings Overview and Highlights
Consolidated results for Q1 FY2026 significantly outperformed the same period last year across all major performance indicators.
- Net Sales : ¥274.2 billion (+¥29.0 billion / +11.8% YoY)
- Operating Income : ¥31.2 billion (+¥15.1 billion / +93.8% YoY)
- Ordinary Income : ¥34.3 billion (+¥20.2 billion / +143.3% YoY)
- Net Income Attributable to Owners of the Parent : ¥19.5 billion (+¥12.9 billion / +195.5% YoY)
Profit expansion was driven by the pass-through of rising naphtha prices (which surged from ¥66,300/KL in the same period last year to ¥118,500/KL ) into product prices, alongside a substantial improvement in inventory valuation differences . Additionally, the yen’s depreciation—averaging 1 USD = ¥159.6 (+¥15.0 YoY) and 1 EUR = ¥185.4 (+¥21.6 YoY)—contributed to higher sales prices and boosted the performance of exports and overseas subsidiaries.
2. Business Portfolio Restructuring: Introduction of New Segments
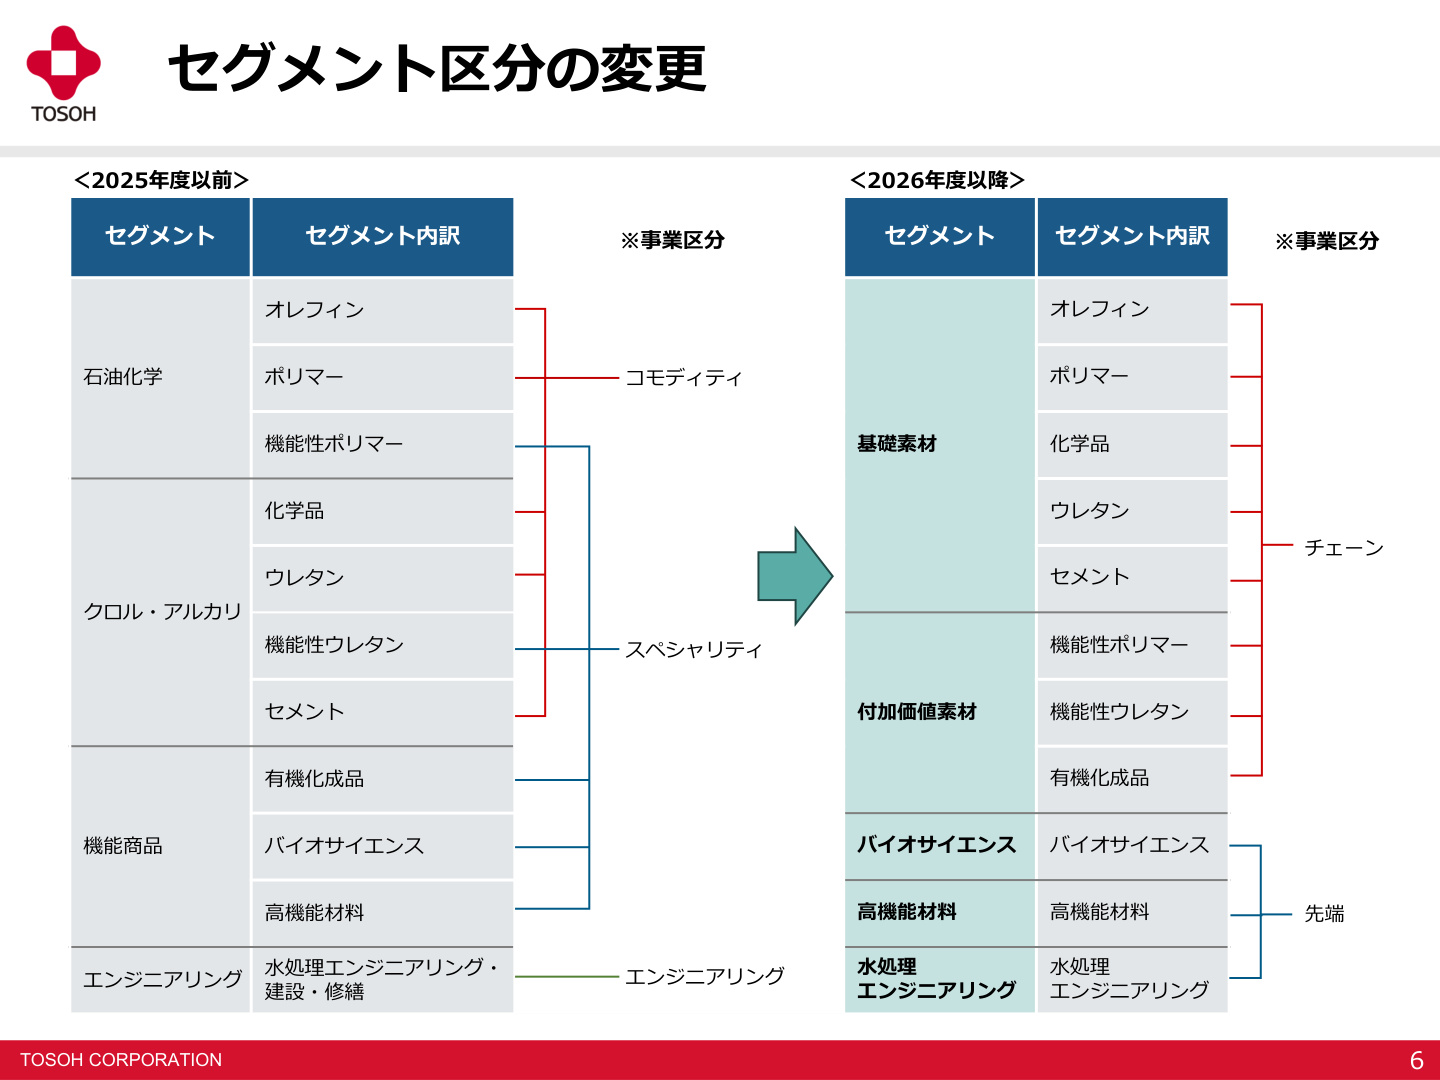
From FY2026, Tosoh has reorganized its business from the previous four segments—Petrochemicals, Chlor-Alkali, Specialty Chemicals, and Engineering—into a new system centered on "Chain Businesses" and "Advanced Businesses."
[Significance and Background of the Slide]
This slide is critical as it illustrates the overall structure of Tosoh’s business portfolio reform . It clearly shifts from the traditional siloed divisional classification to a management policy of "strengthening commodities (Chain Businesses)" and "increasing high-value-added specialty areas (Advanced Businesses)."
- Chain Businesses : Comprised of "Basic Materials" (olefins, polymers, chemicals, urethanes, cement) and "Value-Added Materials" (functional polymers, functional urethanes, organic chemicals), leveraging the strengths of an integrated supply chain as a comprehensive chemical manufacturer.
- Advanced Businesses : Comprised of "Bioscience," "High-Performance Materials" (high-silica zeolites, quartz glass, zirconia, etc.), and "Water Treatment Engineering," targeting high-growth markets such as semiconductors and healthcare.
This restructuring allows investors to more precisely grasp the performance contributions of "market-sensitive material businesses" versus "high-profit, high-growth advanced businesses."
3. Q1 FY2026 Segment Performance Analysis
Trends in sales and operating income based on the new segment classification are as follows:
[Significance and Background of the Slide]
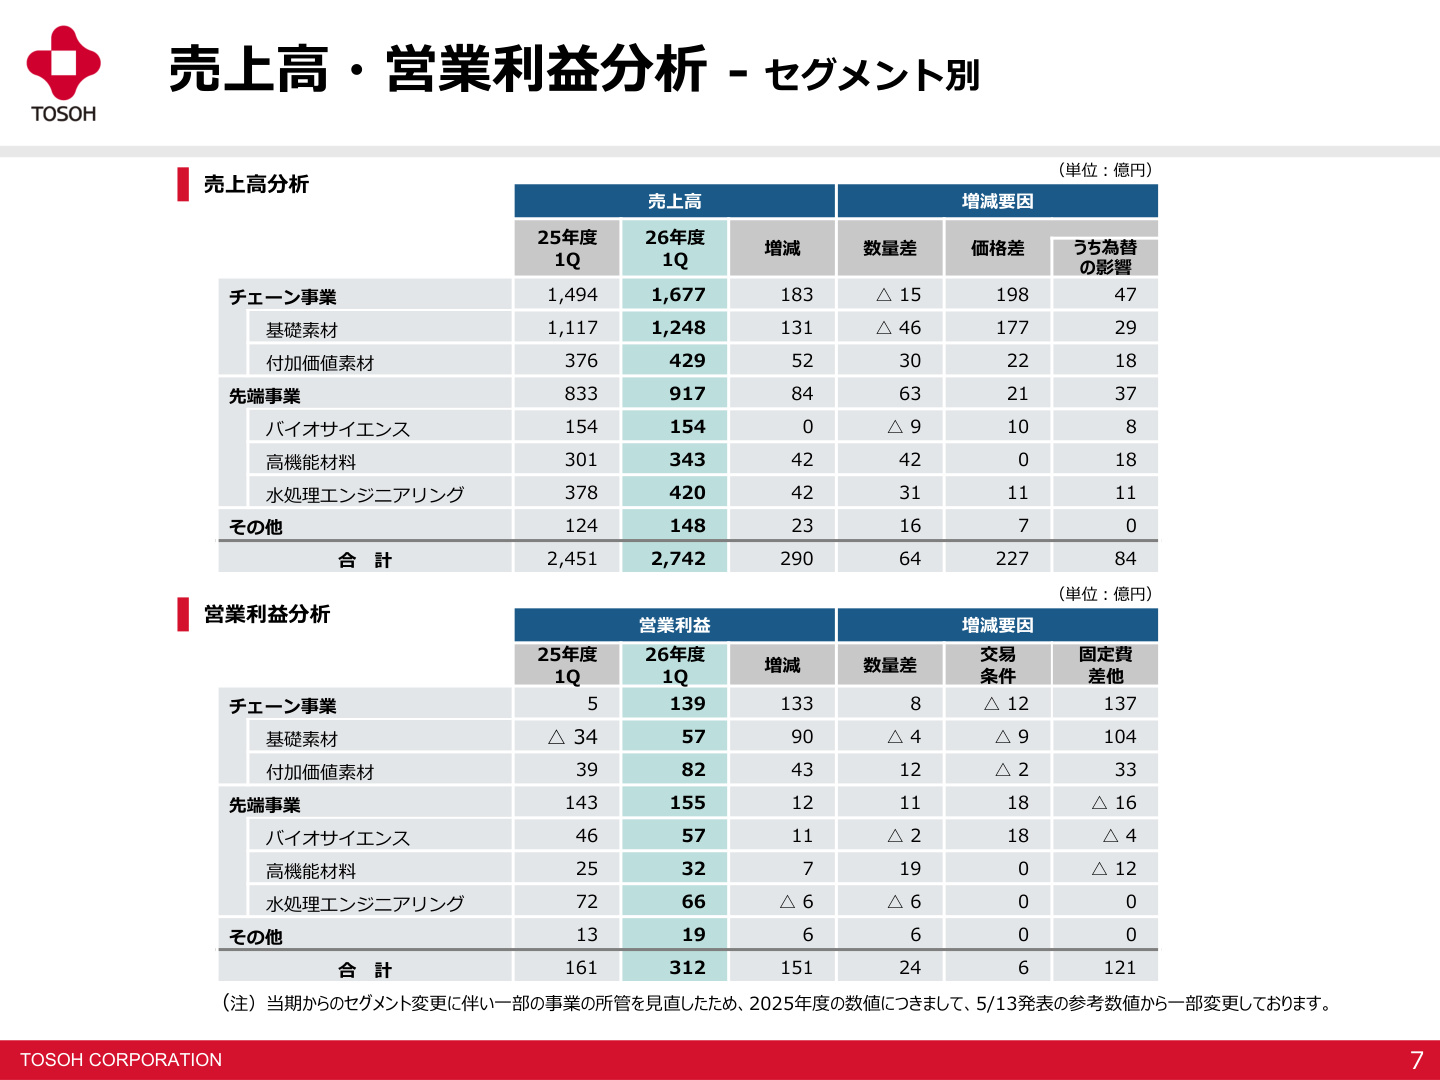
This slide provides core data breaking down the factors behind the Q1 profit increase (Operating Income +¥15.1 billion) , categorized by "volume variance," "price/terms of trade," and "fixed costs/other." It highlights that the primary driver of the company-wide profit doubling was the significant positive impact of fixed costs/other (including improved inventory valuation) in the Chain Businesses (+¥13.7 billion) , while also showing the steady contribution of volume growth and improved terms of trade in the Advanced Businesses.
(1) Chain Businesses
- Net Sales : ¥167.7 billion (+¥18.3 billion YoY)
- Operating Income : ¥13.9 billion (+¥13.3 billion YoY)
- Basic Materials : Sales of ¥124.8 billion (+¥13.1 billion), Operating Income of ¥5.7 billion (recovering from a ¥3.4 billion loss in the same period last year). Despite lower shipments due to periodic maintenance at the Yokkaichi ethylene plant, the segment benefited from market price increases due to Middle East tensions and a dramatic improvement in inventory valuation (+¥10.4 billion profit boost).
- Value-Added Materials : Sales of ¥42.9 billion (+¥5.2 billion), Operating Income of ¥8.2 billion (+¥4.3 billion). Strong overseas demand for chloroprene rubber, HDI-based curing agents, and ethylene amines, combined with improvements in volume (+¥1.2 billion) and fixed costs/valuation (+¥3.3 billion), led to a significant profit increase.
(2) Advanced Businesses
- Net Sales : ¥91.7 billion (+¥8.4 billion YoY)
- Operating Income : ¥15.5 billion (+¥1.2 billion YoY)
- Bioscience : Sales of ¥15.4 billion (flat), Operating Income of ¥5.7 billion (+¥1.1 billion). Despite lower shipments of liquid chromatography packing materials in Europe, increased shipments of domestic in-vitro diagnostic reagents and European automated hemoglobin analysis reagents, along with favorable exchange rates and product mix, secured profit growth.
- High-Performance Materials : Sales of ¥34.3 billion (+¥4.2 billion), Operating Income of ¥3.2 billion (+¥0.7 billion). Driven by robust AI demand , shipments of quartz glass for semiconductors, high-silica zeolites for automotive/environmental applications, and zirconia for dental/decorative use increased, with volume variance (+¥1.9 billion) driving profit.
- Water Treatment Engineering : Sales of ¥42.0 billion (+¥4.2 billion), Operating Income of ¥6.6 billion (-¥0.6 billion). While sales expanded due to steady progress on large-scale semiconductor-related projects in Taiwan and the U.S. and equipment-holding services, profit saw a slight decline due to the absence of high-margin plant projects from the previous year and increased personnel/IT investment costs.
4. Financial Position and Cash Flow
(1) Consolidated Balance Sheet (B/S)
Total assets as of June 30, 2025, reached ¥1,468.9 billion , an increase of ¥60.0 billion from March 31, 2025.
- Assets : Current assets increased, including cash and deposits (+¥11.7 billion), trade receivables (+¥14.3 billion), and inventories (+¥11.2 billion). Tangible and intangible fixed assets also rose by ¥11.5 billion.
- Liabilities/Net Assets : Interest-bearing debt increased to ¥288.8 billion (+¥53.7 billion), resulting in an equity ratio of 57.3% (-4.7 percentage points from the end of the previous fiscal year), maintaining a sound financial level.
(2) Cash Flow (C/F)
- Operating Cash Flow : ¥0.4 billion inflow (vs. ¥36.5 billion inflow in the same period last year). Although quarterly profit before taxes doubled to ¥33.2 billion, cash inflow was temporarily pressured by inventory increases due to rising naphtha prices, higher trade receivables, and increased corporate tax payments.
- Investing Cash Flow : ¥20.0 billion outflow (vs. ¥25.7 billion outflow last year), reflecting continued investment primarily in tangible fixed assets.
- Financing Cash Flow : ¥31.6 billion inflow (vs. ¥3.5 billion outflow last year), due to fundraising through borrowings (+¥50.0 billion). As a result, the balance of cash and cash equivalents at the end of the period was ¥190.2 billion (+¥13.6 billion from the start of the period), maintaining sufficient liquidity.
5. FY2026 Full-Year Forecast and Growth Outlook
Tosoh anticipates increased revenue and profit for the full fiscal year 2026:
- Net Sales : ¥1,170.0 billion (+¥150.1 billion / +14.7% YoY)
- Operating Income : ¥105.0 billion (+¥9.5 billion / +9.9% YoY)
- Ordinary Income : ¥107.0 billion (+¥0.2 billion / +0.2% YoY)
- Net Income Attributable to Owners of the Parent : ¥59.0 billion (+¥17.4 billion / +41.8% YoY)
Assumptions include an average exchange rate of 1 USD = ¥159.9 and domestic naphtha at ¥90,625/KL (high at ¥104,250/KL in the first half, settling to ¥77,000/KL in the second half).
Key Points for Segment Forecasts
- Chain Businesses (Operating Income Forecast: ¥24.5 billion) : While Basic Materials (-¥2.7 billion) face concerns over deteriorating terms of trade due to high raw material costs, Value-Added Materials (¥27.2 billion) are expected to offset this through steady shipments and improved valuation.
- Advanced Businesses (Operating Income Forecast: ¥76.1 billion) : All three fields—Bioscience (¥21.8 billion), High-Performance Materials (¥13.7 billion), and Water Treatment Engineering (¥40.5 billion)—are projected to see YoY profit growth. Specifically, the recovery of quartz glass due to semiconductor demand and the steady progress of large overseas water treatment projects will solidify overall profits.
6. Shareholder Return Policy and Capital Strategy
Tosoh has established a clear return policy aimed at enhancing shareholder value and optimizing capital efficiency.
[Significance and Background of the Slide]
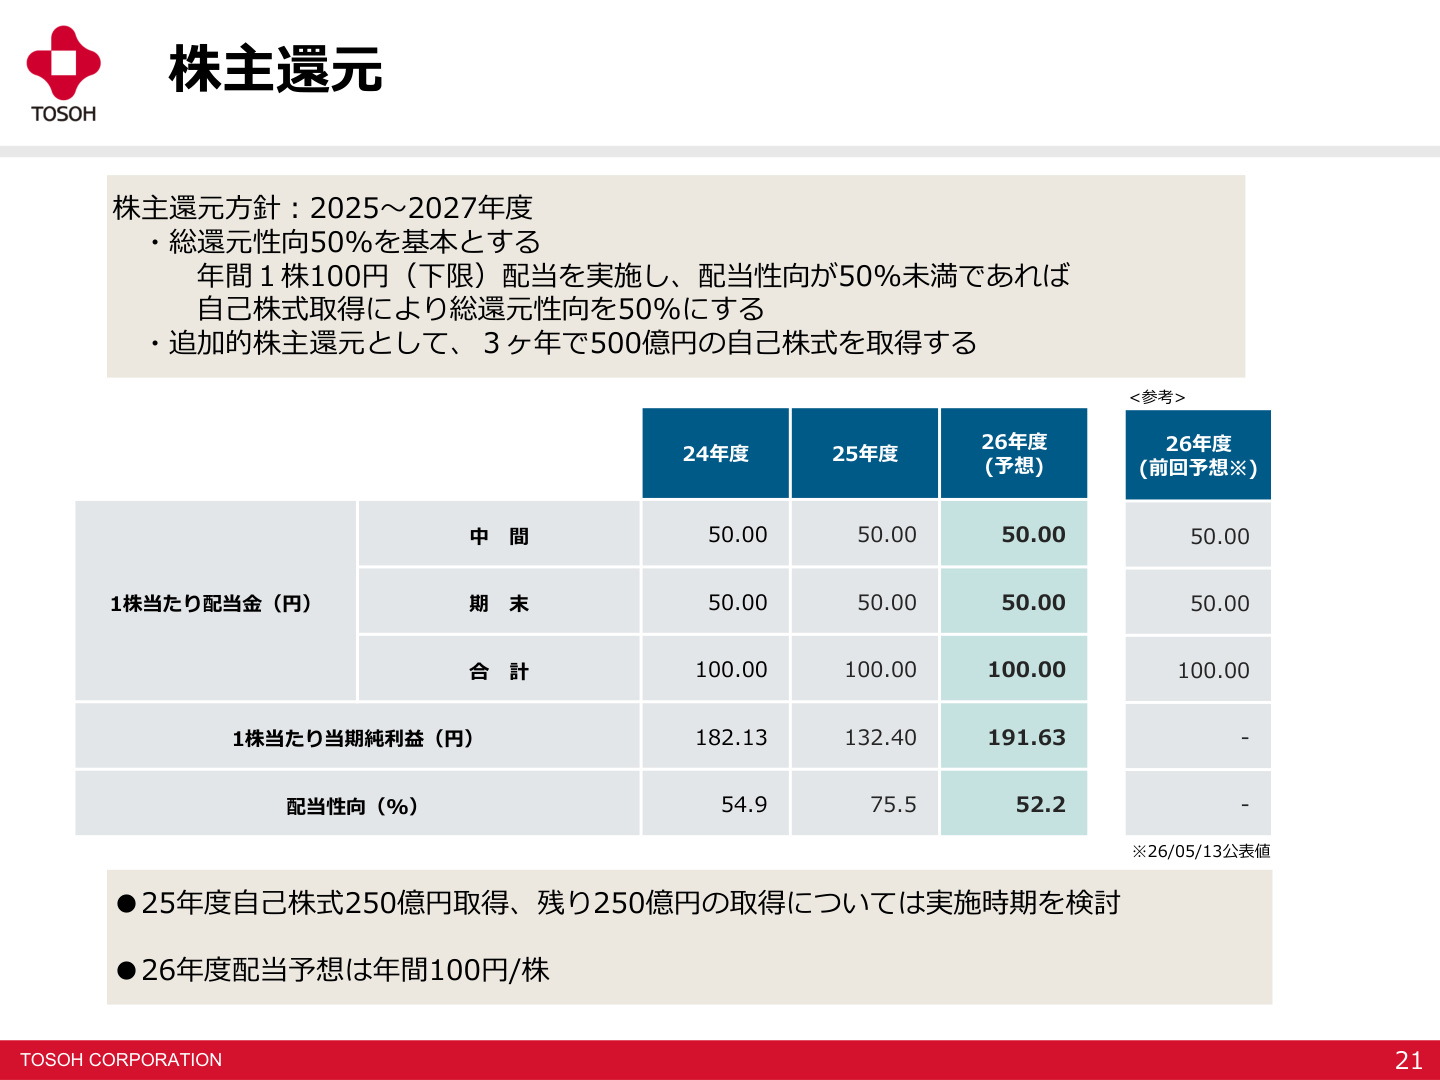
This slide clearly demonstrates Tosoh’s mid-to-long-term shareholder return stance. For the 2025–2027 period, the company has committed to a "total payout ratio of 50%," a "minimum annual dividend of ¥100 per share," and "additional share buybacks of ¥50 billion over three years."
The slide indicates a planned annual dividend of ¥100 (¥50 interim/¥50 year-end) for FY2026, with a payout ratio of 52.2% as EPS recovers to ¥191.63. Having already completed ¥25 billion in buybacks in FY2025, the company is currently considering the timing for the remaining ¥25 billion, signaling a strong commitment to shareholder returns.
7. Conclusion
Tosoh’s Q1 FY2026 results demonstrate high profitability by flexibly responding to external changes such as Middle East risks and market fluctuations, supported by improved inventory valuation and steady expansion in Advanced Businesses .
Through the new segment restructuring, the company is clearly shifting its business structure to control the volatility of the market-sensitive Basic Materials/Chain Businesses while expanding Advanced Businesses targeting high-growth markets like semiconductors, healthcare, and water treatment (which account for approximately 72% of the full-year operating income forecast). Backed by a solid balance sheet and an active share buyback/stable dividend policy, the market will be closely watching the investment outcomes and the acceleration of global expansion in the advanced materials sector.
This content is not intended as investment advice or a recommendation. Any opinions expressed are solely the personal views of each article.