


Soda Nikka Q1 FY2027 Earnings Deep Dive: Analysis of Significant Profit Growth and Segment Performance

StockClub
Published: Aug 03, 2026, 11:49 AM
Sentiment Analysis

1. Earnings Summary: Corporate Highlights and Growth Drivers
Soda Nikka Co., Ltd. achieved significant year-on-year growth in both revenue and profit across all stages for the first quarter of the fiscal year ending March 31, 2027.
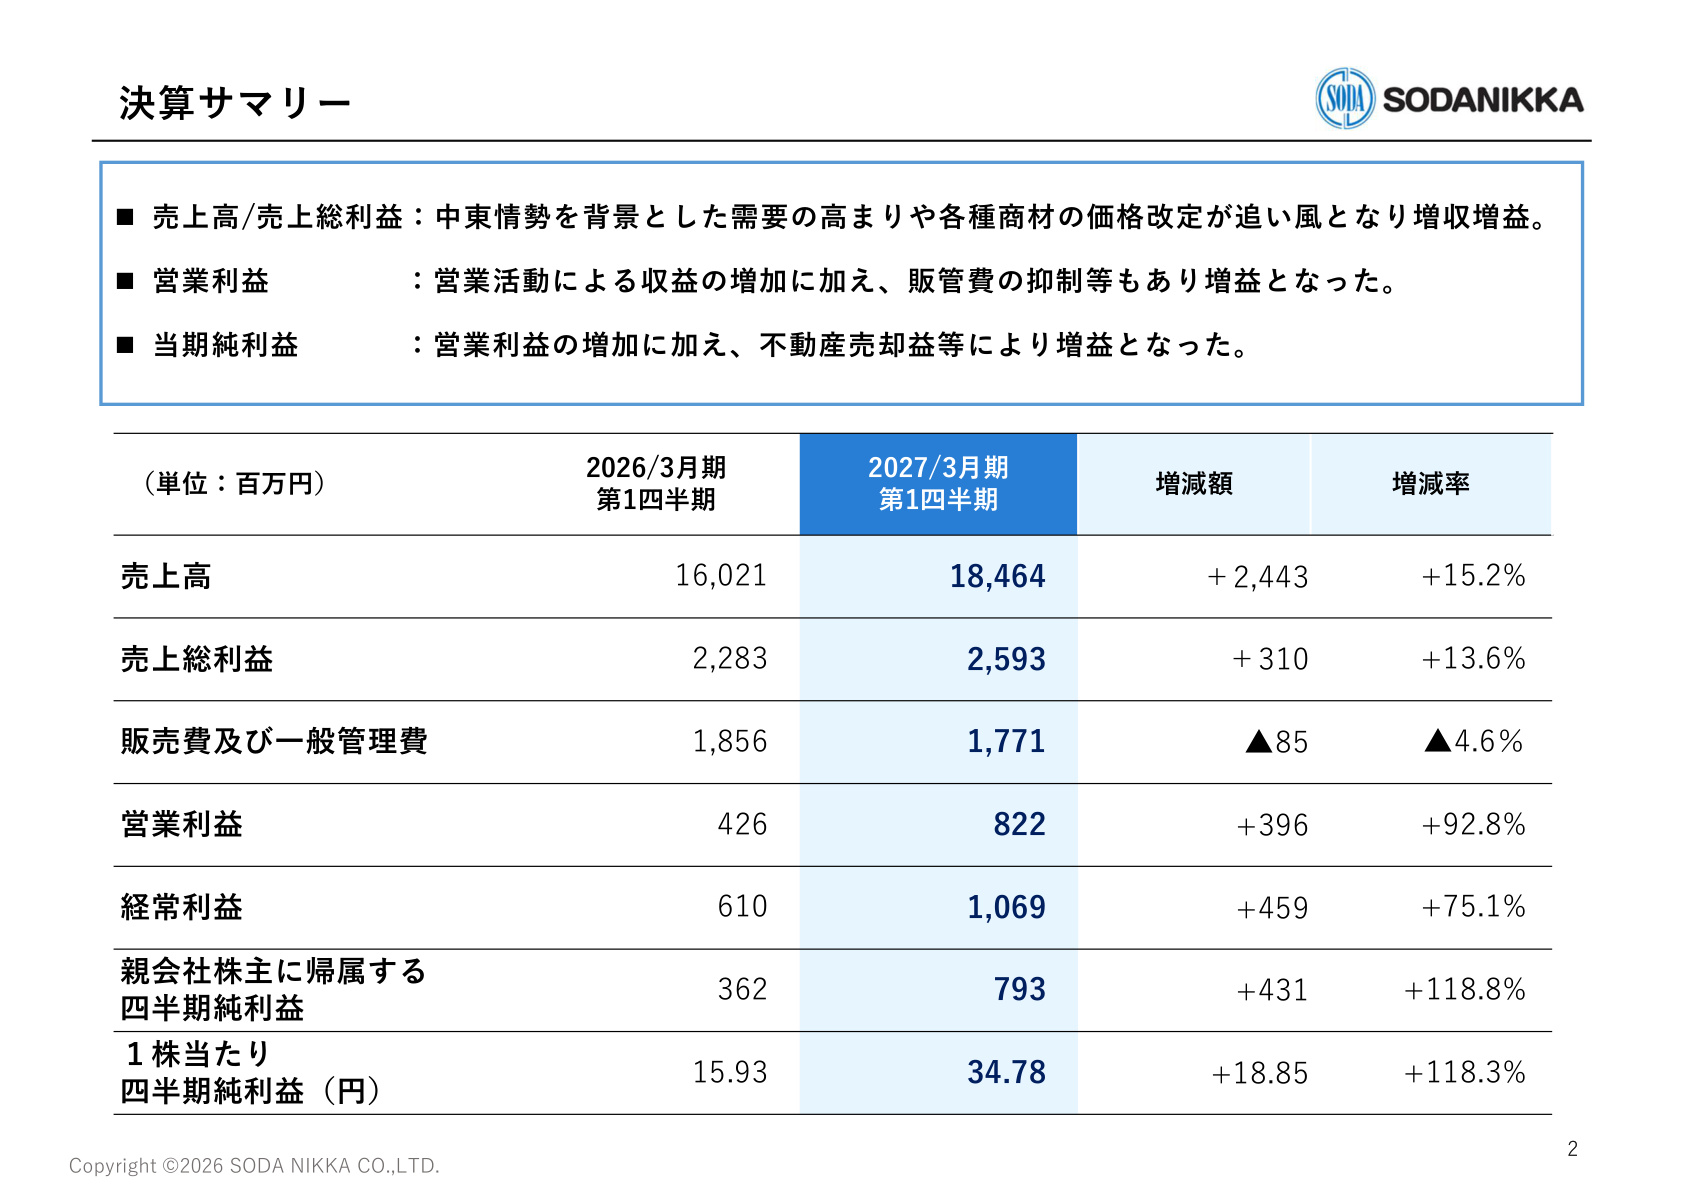
[Significance of Slide 1 and Data Context] The slide above provides the most critical data for grasping the overall performance in Q1 FY2027. Net sales reached ¥18.464 billion (up 15.2% YoY) , and gross profit grew to ¥2.593 billion (up 13.6% YoY) . Of particular note is the structural improvement in profit margins. While gross profit increased in tandem with sales expansion, Selling, General and Administrative (SG&A) expenses were contained at ¥1.771 billion (down 4.6% YoY) . Driven by this "double effect" of higher gross profit and lower SG&A expenses, operating profit surged to ¥822 million (up 92.8% YoY) , nearly doubling compared to the same period last year.
Furthermore, ordinary profit also saw a substantial increase, reaching ¥1.069 billion (up 75.1% YoY) . Quarterly net profit attributable to owners of the parent reached ¥793 million (up 118.8% YoY) —more than double the previous year's level—supported by the robust expansion in operating profit as well as extraordinary income from real estate sales . Earnings per share (EPS) rose sharply to ¥34.78 (compared to ¥15.93 in the same period last year). Key drivers included increased demand stemming from Middle East geopolitical tensions , the successful implementation of price revisions across various product lines, and effective cost control measures through company-wide operational efficiency improvements.
2. In-depth Segment Analysis
The company's strong performance was not dependent on a single business but rather the result of solid or rapid growth across all major business divisions. Below is a detailed analysis by segment.
(1) Chemicals Business: Stable Growth and Margin Expansion
The Chemicals business is the core segment, accounting for the majority of the company's sales and profits. In Q1, net sales were ¥11.722 billion (up 10.3% YoY) , and segment profit was ¥1.025 billion (up 21.0% YoY) . The segment profit margin improved by 0.7 percentage points to 8.7% from 8.0% in the same period last year, confirming enhanced profitability.
Trends by product category are as follows:
- Soda-related Chemicals : While transaction volume for caustic soda declined due to lower sales volume, hydrochloric acid performed exceptionally well in the electronics industry , strongly driving overall transactions.
- Other Inorganic Chemicals : Driven by rising demand for environmental protection and water treatment, shipments of aluminum compounds for water treatment increased , and demand for activated carbon for exhaust gas and wastewater treatment contributed to expanded trade.
- Organic Chemicals : Success in securing spot orders for surfactants and new project wins for polymer flocculants contributed to the sales increase.
(2) Functional Materials Business: Rapid Expansion with 87.9% YoY Operating Profit Growth
The Functional Materials business demonstrated the most remarkable growth this quarter.
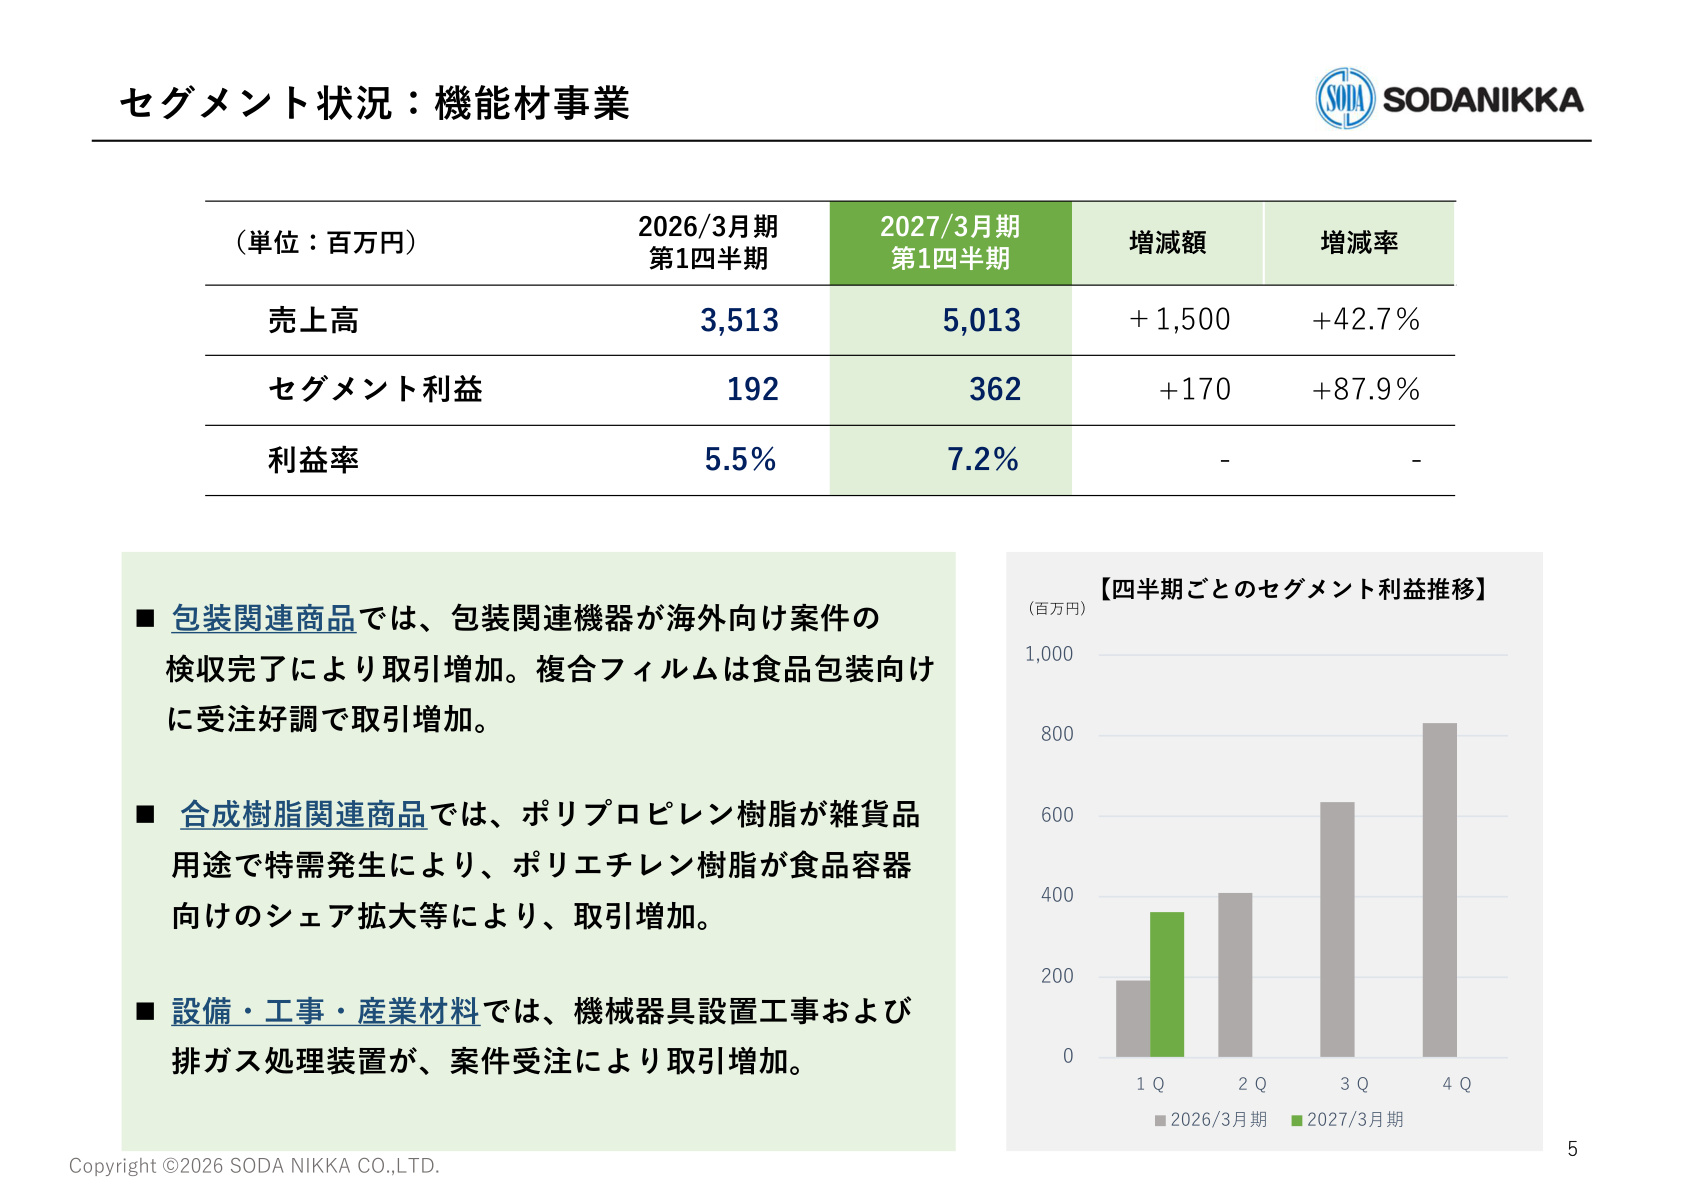
[Significance of Slide 4 and Data Context] The slide above provides a detailed breakdown of the Functional Materials business, which served as the primary growth engine this quarter. Net sales for this segment were ¥5.013 billion (up 42.7% YoY) , and segment profit reached ¥3.62 billion (up 87.9% YoY) , marking an exceptionally high growth rate. The segment profit margin also saw a significant improvement of 1.7 percentage points, rising from 5.5% to 7.2% .
This rapid expansion was driven by the following specific factors:
- Packaging-related Products : The completion of inspections for large-scale overseas packaging equipment projects contributed significantly to sales. Additionally, orders for composite films remained strong, particularly for food packaging applications.
- Synthetic Resin-related Products : Polypropylene resin saw special demand for miscellaneous goods, while polyethylene resin expanded its market share in food container applications, significantly boosting sales.
- Equipment, Construction, and Industrial Materials : Orders for machinery installation and exhaust gas treatment equipment progressed steadily, contributing to revenue growth.
Beyond mere market recovery, the successful acquisition of customers (market share expansion) and the reliable delivery and inspection of large-scale projects were the catalysts for this dramatic performance growth.
(3) Other Businesses: Revenue Decline but Significant Margin Improvement
Although net sales in the Other Businesses segment decreased slightly to ¥1.728 billion (down 8.1% YoY) , segment profit expanded more than threefold to ¥82 million (up 213.4% YoY) . The profit margin improved dramatically from 1.4% in the same period last year to 4.7% . Increased transactions at domestic consolidated subsidiaries and strong sales at overseas subsidiaries contributed significantly to this profit improvement.
3. Financial Position and Balance Sheet Changes
As of the end of Q1 FY2027, the consolidated balance sheet shows solid expansion in both assets and net assets.
- Assets : Total assets reached ¥79.737 billion , an increase of ¥1.911 billion from the end of the previous fiscal year. Current assets decreased to ¥50.675 billion (down ¥1.621 billion) due to a reduction in cash and deposits and accounts receivable, while non-current assets increased significantly to ¥29.062 billion (up ¥3.533 billion). The primary driver for this increase in non-current assets was investments and other assets (¥22.073 billion, up ¥3.583 billion) , resulting from the rise in the market value of securities held by the company.
- Liabilities : Total liabilities were ¥43.263 billion (down ¥788 million) . The main factor was a decrease of ¥1.991 billion in current liabilities, driven by a reduction in short-term borrowings (down ¥993 million) and other current liabilities.
- Net Assets : Total net assets reached ¥36.473 billion (up ¥2.699 billion) . In addition to the accumulation of retained earnings, the increase in valuation difference on available-for-sale securities (up ¥2.413 billion) , driven by higher unrealized gains on securities, strongly boosted total net assets. A sound and robust financial position is being maintained, including an improved equity ratio.
4. Full-Year Forecast and Progress Evaluation
Despite the strong Q1 performance, the company maintains a cautious outlook for its full-year earnings forecast.
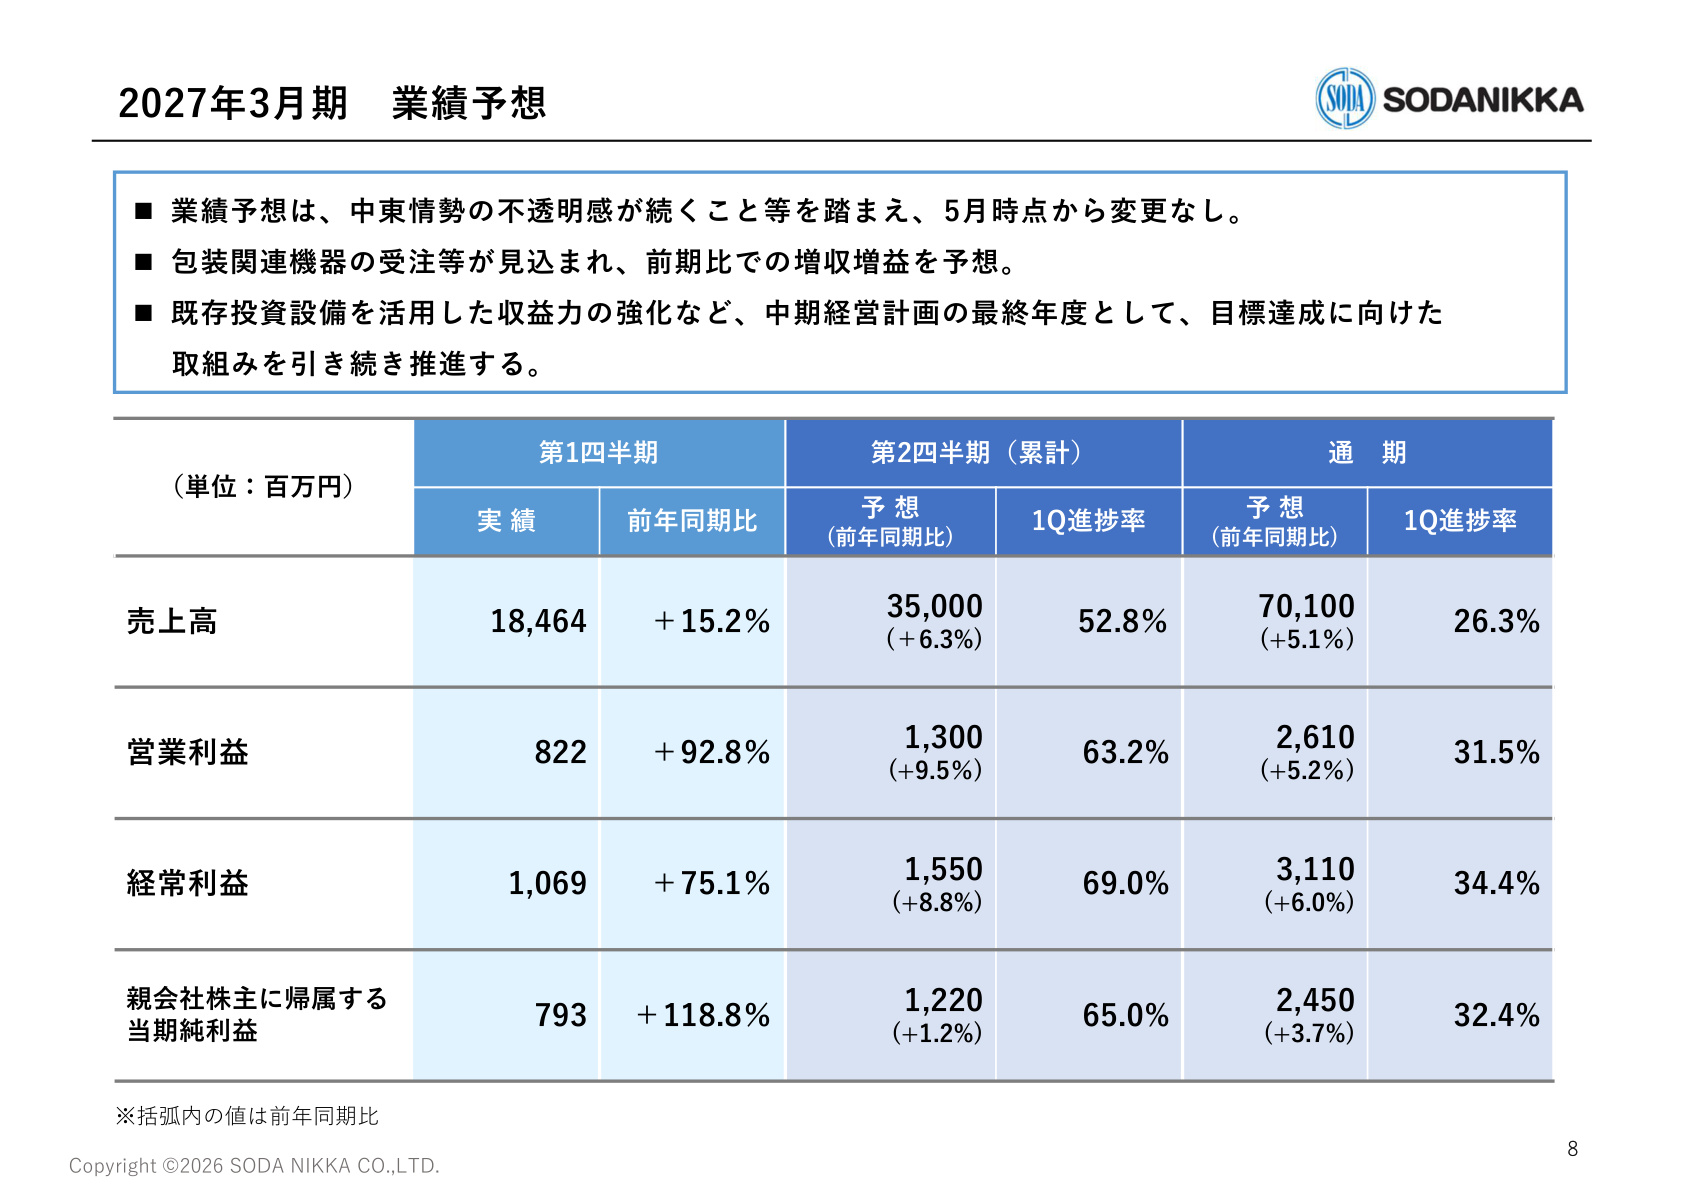
[Significance of Slide 7 and Data Context] The slide above presents key data regarding the full-year and H1 cumulative earnings forecasts for FY2027, along with the progress rate against Q1 results.
Progress against the full-year plan is as follows:
- Net Sales : ¥18.464 billion against a full-year forecast of ¥70.1 billion ( 26.3% progress )
- Operating Profit : ¥822 million against a full-year forecast of ¥2.61 billion ( 31.5% progress )
- Ordinary Profit : ¥1.069 billion against a full-year forecast of ¥3.11 billion ( 34.4% progress )
- Net Profit Attributable to Owners of Parent : ¥793 million against a full-year forecast of ¥2.45 billion ( 32.4% progress )
While 25% is generally considered the benchmark for Q1 progress, the company has significantly exceeded this in both sales and profit, with profit metrics (31.5% for operating profit and 34.4% for ordinary profit) showing a very high pace of progress . The company has also reached 63.2% of its H1 operating profit forecast (¥1.3 billion).
Management has kept the full-year forecast announced in May unchanged, citing factors such as "continued uncertainty regarding the situation in the Middle East," but it is clear that the company has made an extremely strong start in the first quarter.
5. Shareholder Returns and Mid-term Management Plan "Go forward STAGE3"
The company is currently in the final year of its mid-term management plan, " Go forward STAGE3 " (FY2024–FY2027).
Shareholder Return Policy and Dividend Forecast
As part of its shareholder return policy during the mid-term management plan, the company aims to standardize a dividend payout ratio of 40% or higher .
- FY2027 Dividend Forecast : The company plans an annual dividend of ¥44.0 per share (interim ¥22.0, year-end ¥22.0), with a projected payout ratio of 41.0%.
- This maintains the same level of returns as the previous fiscal year (FY2026, ¥44.0 ordinary dividend), demonstrating a commitment to stable returns in line with earnings growth.
Initiatives for the Final Year of the Mid-term Management Plan
As the final year of "Go forward STAGE3," the company is actively pursuing initiatives such as strengthening profitability by utilizing existing investment assets and securing orders for packaging-related equipment. Looking at the performance trend over the past few years, net profit attributable to owners of the parent has grown steadily from ¥1.367 billion in FY2022, with a target of ¥2.45 billion for this fiscal year, which would mark a record high.
Summary and Conclusion
Soda Nikka's Q1 FY2027 earnings report reflects a company that has further strengthened both its management efficiency and financial foundation . This is evidenced by solid sales growth, the breakthrough in the Functional Materials business, company-wide reductions in SG&A expenses, and a strengthened balance sheet due to the appreciation of securities. We will continue to monitor the execution of strategies across all business segments as the company works toward achieving its mid-term management plan goals.
This content is not intended as investment advice or a recommendation. Any opinions expressed are solely the personal views of each article.