


Sumitomo Bakelite Q1 FY2027 Earnings Deep Dive: Broad Revenue and Profit Growth Driven by Semiconductor/AI Demand and Yen Depreciation

StockClub
Published: Aug 03, 2026, 11:32 AM
Sentiment Analysis
Sumitomo Bakelite Co., Ltd. (Securities Code: 4203) has announced its financial results for the first quarter of the fiscal year ending March 31, 2027 (FY2026). This report provides a comprehensive analysis of the company's performance highlights, segment trends, profit variance analysis, full-year forecasts, and shareholder return policies, based on the disclosed earnings presentation materials.
1. Q1 FY2027 Consolidated Financial Highlights
In the first quarter, Sumitomo Bakelite achieved significant growth in both revenue and profit , with all key financial metrics substantially exceeding those of the same period last year.
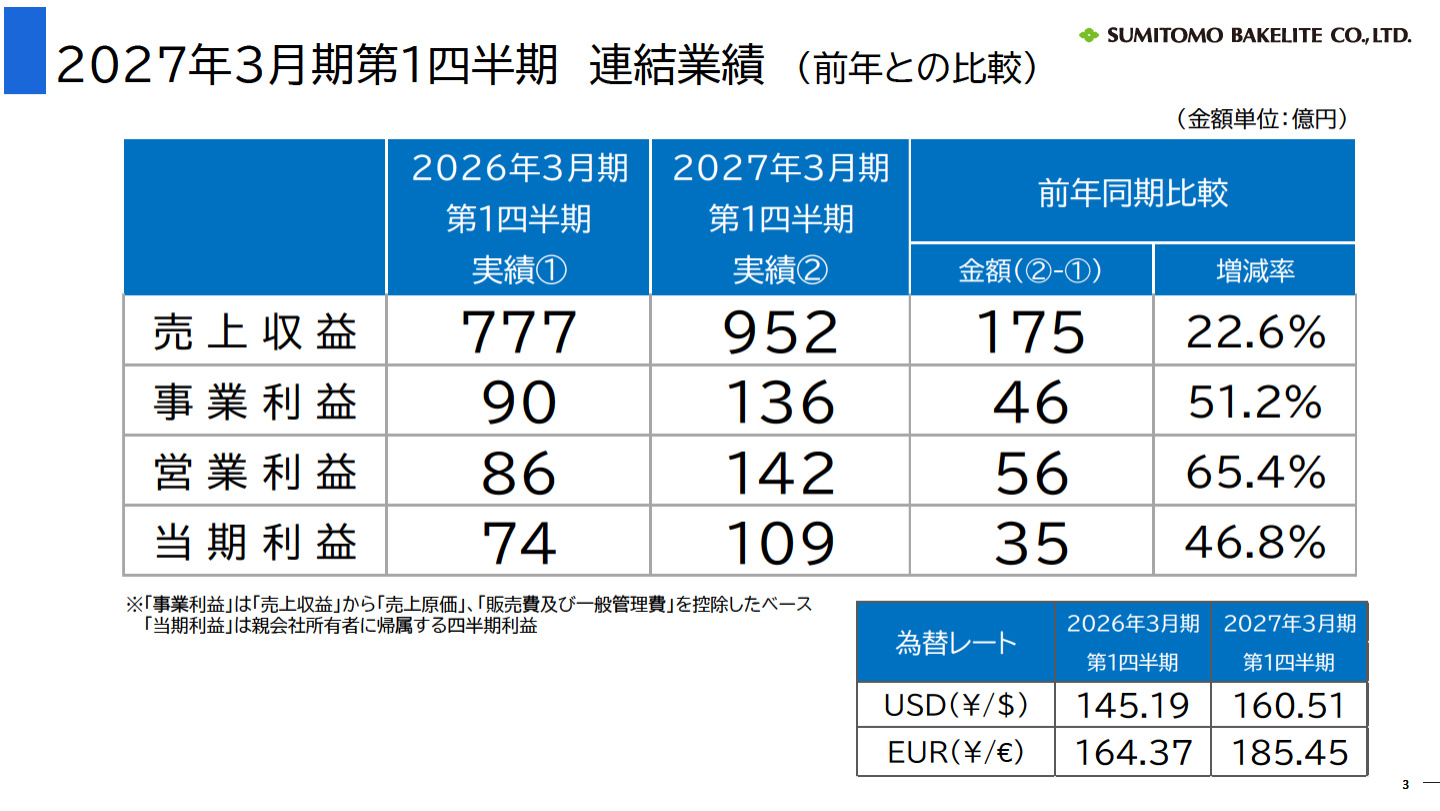
The slide above illustrates the key financial figures comparing Q1 performance with the same period last year. This slide is critical as it clearly quantifies the success of the company's strategic product expansion, effective price pass-throughs, and the favorable impact of foreign exchange rates.
- Revenue : ¥95.2 billion (+22.6% YoY / +¥17.5 billion)
- Business Profit : ¥13.6 billion (+51.2% YoY / +¥4.6 billion)
- Operating Profit : ¥14.2 billion (+65.4% YoY / +¥5.6 billion)
- Profit for the Period : ¥10.9 billion (+46.8% YoY / +¥3.5 billion)
- Applied Exchange Rates : USD/JPY = ¥160.51 (vs. ¥145.19 in Q1 last year), EUR/JPY = ¥185.45 (vs. ¥164.37 in Q1 last year)
With revenue increasing by over 20% and business and operating profits surging by 50% to over 60% year-on-year, the company has seen an exceptionally strong start. The significant depreciation of the yen against both the US dollar and the euro bolstered performance, while increased sales volumes across business units and successful price adjustments contributed to improved profit margins.
2. Analysis of Revenue and Business Profit Variance
To understand the drivers behind this quarter's substantial profit growth, we break down the factors affecting both revenue and business profit.
Revenue Variance (YoY +¥17.5 billion)
The ¥17.5 billion increase in revenue is broken down as follows:
- Volume Variance : +¥6.3 billion (Positive across all segments, with semiconductor-related materials contributing significantly at +¥4.3 billion)
- Price Pass-through : +¥5.1 billion (Implementation of appropriate price revisions in response to rising raw material costs)
- Exchange Rate Impact : +¥6.2 billion (Positive translation effect due to the weaker yen)
Driven by strong sales volume in core semiconductor-related materials, combined with price adjustments and currency tailwinds, all segments recorded revenue growth compared to the previous year.
Business Profit Variance (YoY +¥4.6 billion)
The factors contributing to the increase in business profit are analyzed below.
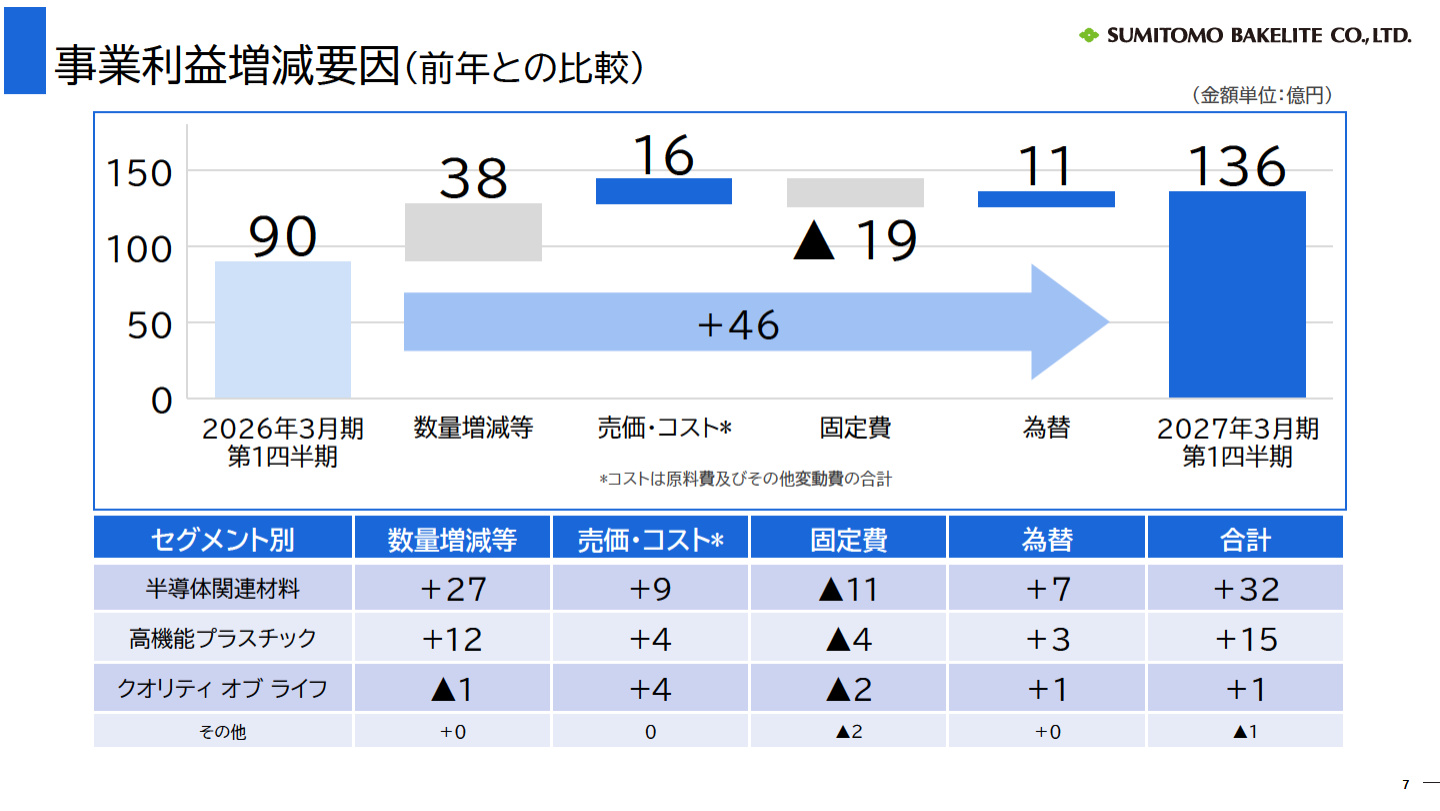
The slide above visualizes the ¥4.6 billion year-on-year increase in business profit using a waterfall chart. This is a vital slide for understanding the structural reasons behind the profit growth.
- Volume Variance, etc. : +¥3.8 billion (Significant gains of +¥2.7 billion in semiconductor-related materials and +¥1.2 billion in high-performance plastics)
- Price/Cost Improvements : +¥1.6 billion (Price adjustments sufficiently absorbed increases in raw material and other variable costs)
- Exchange Rate Impact : +¥1.1 billion (Positive impact on operating profit due to the weaker yen)
- Increase in Fixed Costs : -¥1.9 billion (Rise in fixed costs associated with business expansion)
Although fixed costs increased by ¥1.9 billion due to new product rollouts and business scale expansion, this was far outweighed by volume-driven profit growth (+¥3.8 billion) , price/cost improvements (+¥1.6 billion) , and currency effects (+¥1.1 billion) , ultimately resulting in substantial business profit growth.
3. Segment Performance Analysis
Detailed trends for the company's three main segments in Q1 are as follows:
① Semiconductor-Related Materials Segment
- Revenue : ¥34.2 billion (+40.2% YoY)
- Business Profit : ¥8.0 billion (+66.7% YoY)
- Trend Analysis : Strong demand for materials for AI servers due to the rapid expansion of generative AI, along with increased demand for encapsulation resins for power semiconductors , drove overall performance. Furthermore, sustained demand growth in China, the full-scale recovery of automotive applications in Southeast Asia, and strong sales of the company's three focus mobility strategy products contributed to the results.
② High-Performance Plastics Segment
- Revenue : ¥31.9 billion (+22.7% YoY)
- Business Profit : ¥3.2 billion (+88.2% YoY)
- Trend Analysis : Sales grew steadily, particularly in the Asian region. Additionally, the recovery in demand for aircraft interior materials , which had been stagnant since the pandemic, progressed, leading to a higher ratio of high-value-added product shipments and nearly doubling the business profit compared to the same period last year.
③ Quality of Life (QOL) Segment
- Revenue : ¥28.9 billion (+6.6% YoY)
- Business Profit : ¥3.8 billion (+2.7% YoY)
- Trend Analysis : The segment performed solidly, primarily in film and sheet products , capturing customer demand for increased production and inventory stockpiling. While not experiencing rapid growth, it maintains a stable profit base.
4. FY2027 Full-Year Forecast and Progress
The company has decided to maintain its full-year earnings forecast, which was announced on May 11, 2026.
- Full-Year Revenue Forecast : ¥337.0 billion (+5.4% YoY)
- Full-Year Business Profit Forecast : ¥38.0 billion (+10.2% YoY)
- Full-Year Operating Profit Forecast : ¥37.5 billion (+5.7% YoY)
- Full-Year Profit for the Period Forecast : ¥28.5 billion (+1.7% YoY)
- Full-Year Assumed Exchange Rate : USD/JPY = ¥155.00
The progress rate of business profit at the end of Q1 (¥13.6 billion) against the full-year plan (¥38.0 billion) is approximately 35.8% , indicating a pace of progress faster than anticipated. However, given global economic uncertainties and exchange rate volatility, the company has prudently kept its full-year forecast unchanged at this time.
5. Shareholder Return Policy and Dividend Increase Plan
Sumitomo Bakelite has clearly articulated its commitment to shareholder returns based on a policy of "stable and continuous profit distribution."
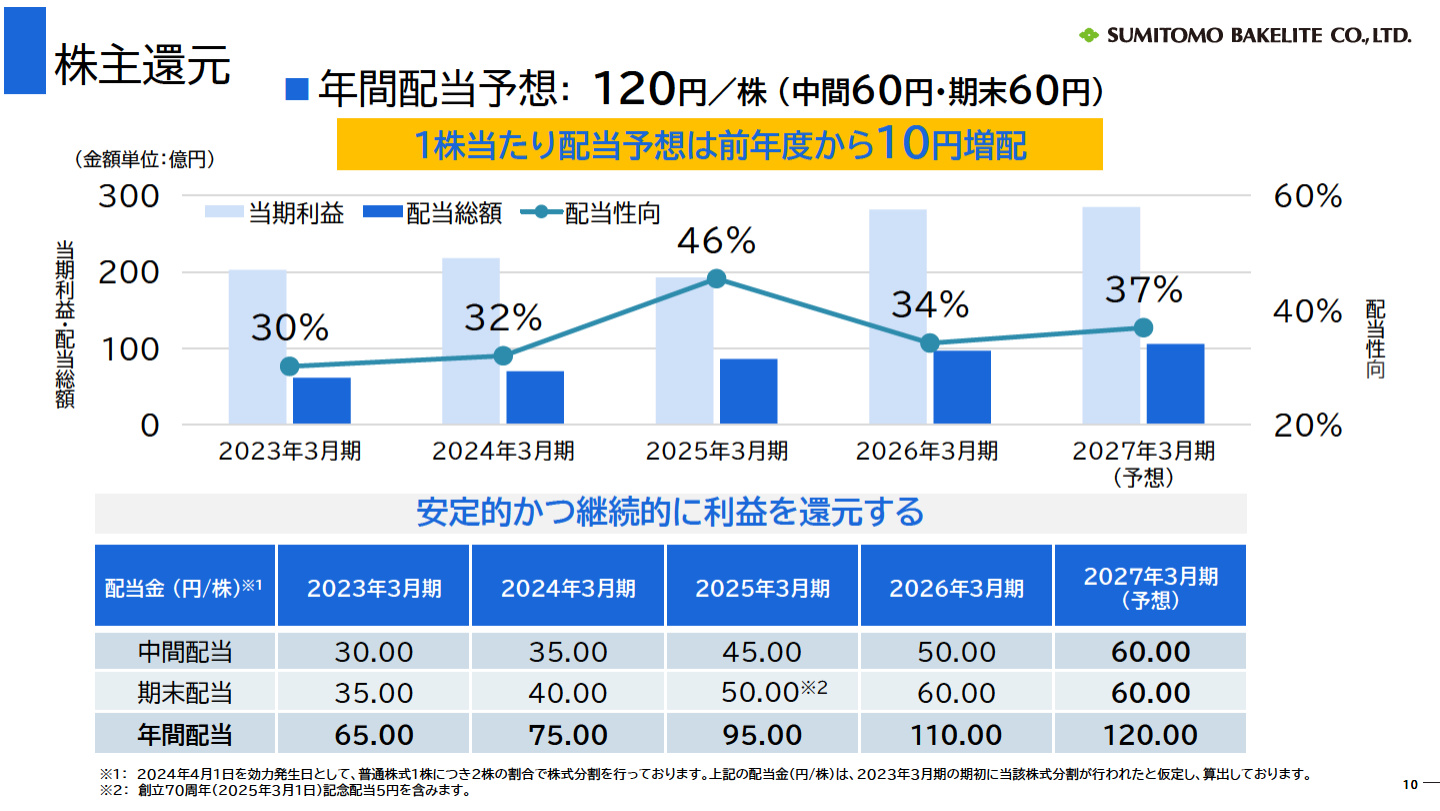
The slide above shows the annual trend of dividends per share and the payout ratio. This is the most important data for understanding how the company returns the fruits of its growth to shareholders.
- FY2027 Annual Dividend Forecast : ¥120/share (¥10 increase YoY)
- Interim Dividend : ¥60/share (Previous: ¥50)
- Year-end Dividend : ¥60/share (Previous: ¥60)
- Expected Payout Ratio : 37%
The company has continued a gradual and robust streak of dividend increases , moving from ¥65 in FY2023 to ¥75 (FY2024), ¥95 (FY2025), and ¥110 (FY2026), with plans to further increase the annual dividend to ¥120 in FY2027. The company intends to maintain a high payout ratio in the 35–40% range in line with earnings growth. (*Note: Historical figures have been adjusted to reflect the 1-for-2 stock split effective April 1, 2024.)
Conclusion
Sumitomo Bakelite's Q1 FY2027 results mark an exceptionally strong start, driven by a combination of robust demand in AI servers and power semiconductors , successful price pass-throughs , and yen depreciation . Moving forward, while maintaining the high pace of progress against the full-year forecast, the demand trends for advanced semiconductor materials and mobility materials in the second half will be key factors for further upside potential.
This content is not intended as investment advice or a recommendation. Any opinions expressed are solely the personal views of each article.