

[Tokyo Metro (9023)] Q1 FY2027 Earnings Deep Dive: Growth Story Driven by Passenger Recovery and Non-Railway Expansion, and the Full Picture of Management Challenges
![[Tokyo Metro (9023)] Q1 FY2027 Earnings Deep Dive: Growth Story Driven by Passenger Recovery and Non-Railway Expansion, and the Full Picture of Management Challenges](https://news-images.stock-club.net/market_news/images/9023/140120260731505203/slide_eyecatch_en_5fad0b57.webp)
Sentiment Analysis
This report provides an in-depth analysis of the earnings highlights, segment-specific trends, and mid-to-long-term growth strategies of Tokyo Metro Co., Ltd. (Securities Code: 9023, hereinafter "Tokyo Metro"), based on the financial results for the first quarter of the fiscal year ending March 31, 2027 (April 1, 2026 – June 30, 2026).
By reading this report, you will gain a comprehensive understanding of the overall financial picture and the structural growth story of the company.
1. Earnings Overview: Revenue Growth from Passenger Recovery Offset by Costs and One-off Factors
In the first quarter of FY2027, Tokyo Metro achieved solid top-line growth with operating revenue of 109.049 billion yen (+2.8% YoY) . However, operating profit was 27.782 billion yen (-3.9% YoY) , ordinary profit was 24.722 billion yen (-4.9% YoY) , and net profit attributable to owners of the parent was 16.811 billion yen (-24.7% YoY) .
Key highlights of the results are as follows:
- Revenue Growth : Driven by an increase in core passenger transportation revenue, alongside growth in the real estate and life/business service segments.
- Increase in Operating Expenses : Operating expenses rose to 81.267 billion yen (+5.3% YoY) due to higher labor costs, rising material prices, and the timing of maintenance expenses (including a shift toward more even distribution compared to the previous heavy Q4 weighting).
- Reasons for Net Profit Decline : The primary factor was the reactionary decline following a one-off gain from the revision of the retirement benefit plan (approx. 6.4 billion yen) recorded in the same period last year.
- Full-Year Forecast and Dividend Policy : The full-year consolidated earnings forecast (operating revenue of 437.2 billion yen, operating profit of 81.4 billion yen, and net profit of 50 billion yen) and the annual dividend forecast of 44 yen per share (22 yen at year-end) remain unchanged, with progress generally on track.
2. Analysis of Consolidated Operating Profit Fluctuations
The 1.1 billion yen decline in operating profit, from 28.8 billion yen in the same period last year to 27.7 billion yen, is the result of a complex interplay between revenue growth and rising costs.
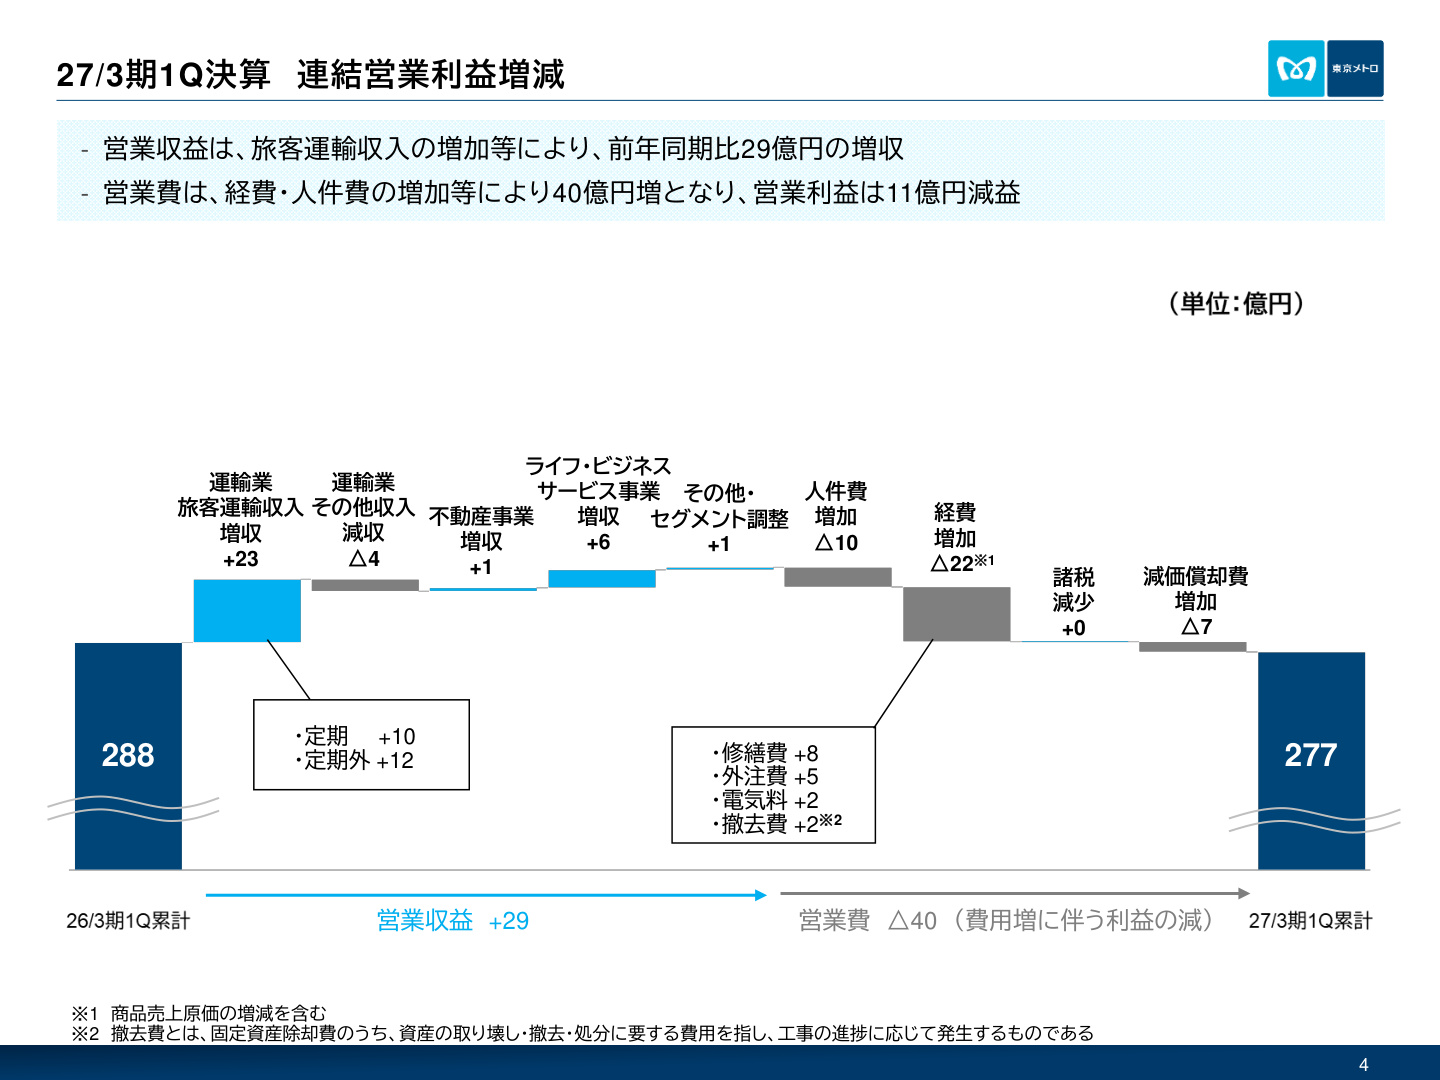
[Slide Commentary: Structure of Consolidated Operating Profit Changes] The waterfall chart above is a critical document visualizing the transition of operating profit in Q1. A breakdown of the changes shows that operating revenue contributed a total of +2.9 billion yen . Specifically, passenger transportation revenue increased by +2.3 billion yen (commuter passes +1.0 billion yen, non-commuter +1.2 billion yen) due to the return of passenger flow and inbound demand. Additionally, the real estate business contributed +0.1 billion yen , and the life/business service business added +0.6 billion yen .
Conversely, this was offset by +4.0 billion yen in operating expenses (profit reduction due to cost increases) . The main components include increased labor costs (-1.0 billion yen) due to base pay raises and staffing adjustments, increased expenses (-2.2 billion yen) primarily in maintenance (-0.8 billion yen) and outsourcing (-0.5 billion yen) for equipment inspections, and increased depreciation (-0.7 billion yen) associated with capital investment. While the cost of responding to inflation and safety investments temporarily outweighed the revenue growth from core operations, this represents planned expenditure to ensure the safety and stable operation of infrastructure in the medium term.
3. Segment-Specific Trends
① Transportation Business: Stabilization of Passenger Flow and Trends by Area/Time
Transportation business operating revenue was 99.304 billion yen (+1.9% YoY) , and operating profit was 23.541 billion yen (-7.1% YoY) .
- Breakdown of Passenger Transportation Revenue : Totaled 91.037 billion yen (+2.6% YoY). Commuter revenue was 35.298 billion yen (+3.1% YoY) , and non-commuter revenue was 55.738 billion yen (+2.3% YoY) , both showing expansion.
- Growth in Passenger Volume : Total passenger volume reached 671.47 million (+2.6% YoY) . Commuter users were 355.43 million (+3.2% YoY), and non-commuter users were 316.04 million (+2.0% YoY), indicating steady accumulation in commuting and leisure demand.
- Trends by Station/Area : Analysis of ticket gate entries/exits shows a +1.4% increase on weekdays and +1.2% on weekends compared to the previous year. By area, growth rates in areas outside the five central wards of Tokyo (weekdays +1.6%, weekends +1.9%) were higher than those within the five central wards (Otemachi, Ginza, etc.; weekdays +1.3%, weekends +0.6%). Additionally, the usage rate of post-payment ride services via credit card touch payments, introduced in March 2026, is rising steadily.
② Real Estate Business: Rise in Rental Unit Prices and Contribution of New Properties
Driven by contributions from new developments/acquisitions and rent revisions for existing offices, the real estate business achieved solid growth with operating revenue of 3.764 billion yen (+5.6% YoY) and operating profit of 1.504 billion yen (+10.2% YoY) .
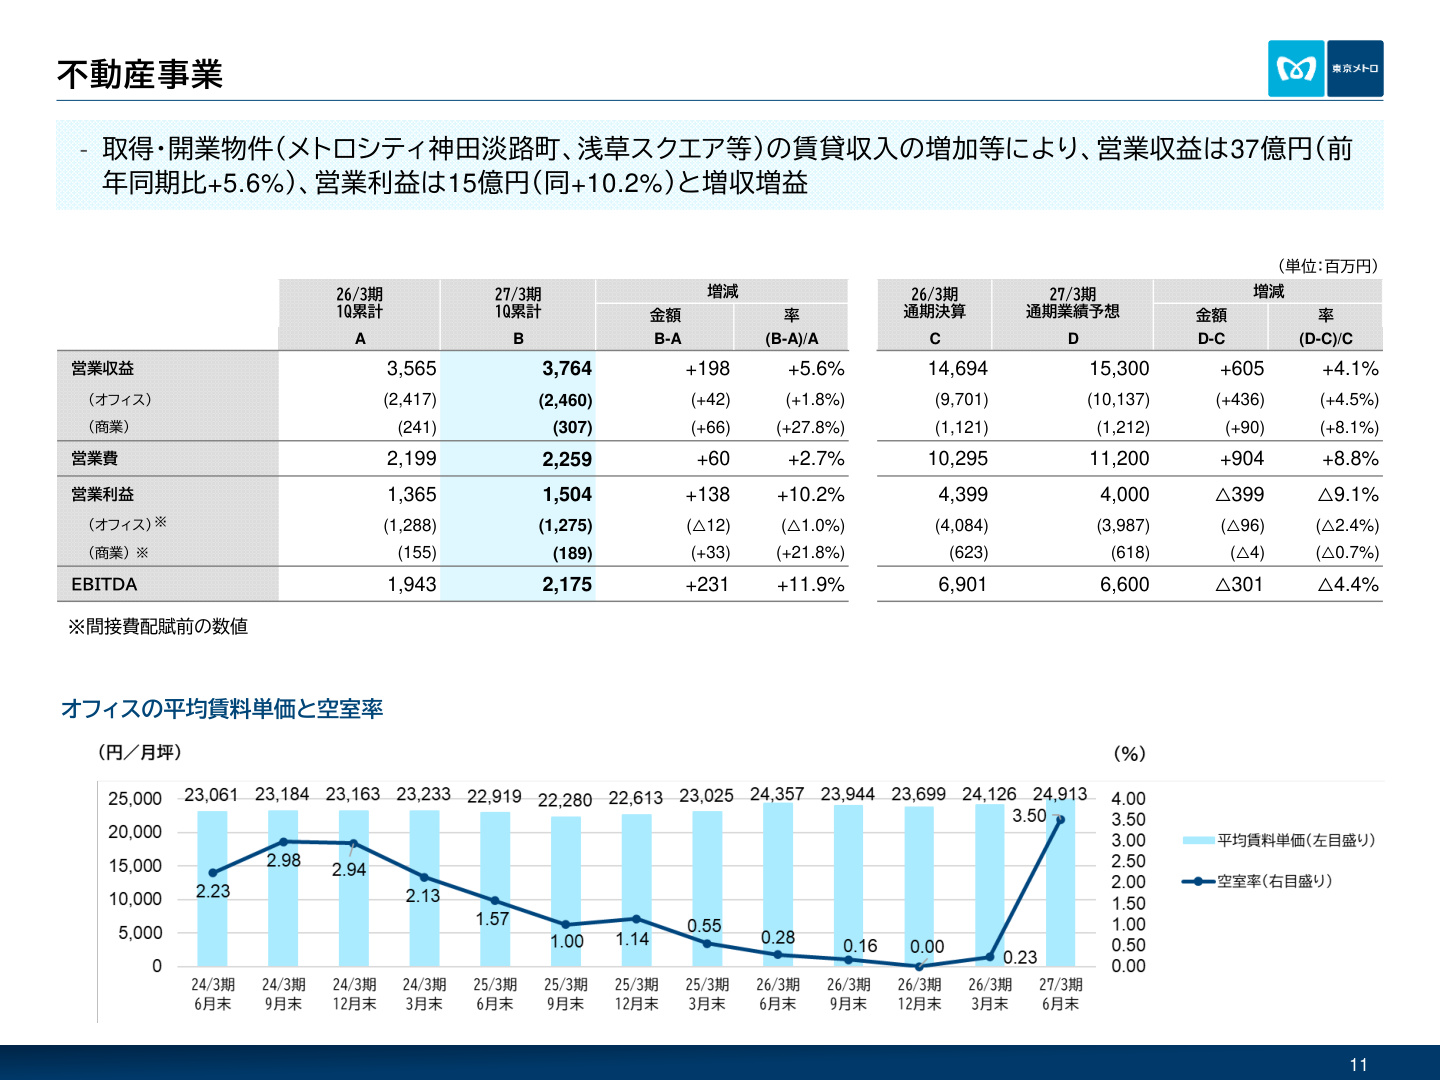
[Slide Commentary: Real Estate Performance and Office Leasing Indicators] The graph at the bottom of this slide shows the trends in average office rent and vacancy rates for properties owned by Tokyo Metro. Rental income from new and renovated properties such as "Metro City Kanda Awajicho" and "Asakusa Square" has contributed to the average rent per tsubo rising steadily to 24,913 yen . Regarding vacancy rates, although they rose temporarily to 3.50% due to new supply and tenant turnover, the company maintains high profitability by leveraging the strength of its portfolio centered on prime locations in central Tokyo.
③ Life/Business Service Business: Rapid Growth in Advertising and Media
This segment showed remarkable growth, with operating revenue of 6.975 billion yen (+11.0% YoY) and operating profit of 2.582 billion yen (+25.1% YoY) .
- Advertising Service Business : Expanded dramatically with operating revenue of 2.012 billion yen (+33.8% YoY) and operating profit of 0.434 billion yen (+186.0% YoY) , driven by increased sales of station media and in-train digital signage, as well as growth in agency production sales.
- Life Service/Communication Service : The opening of the "LifeFit" fitness club and increased licensing revenue from 5G base station infrastructure contributed to profit growth.
4. Future Priority Strategies and Mid-to-Long-Term Growth Story
In response to changes in the business environment such as a shrinking labor force and inflation, Tokyo Metro is advancing strengthening sustainability and pursuing new growth opportunities .
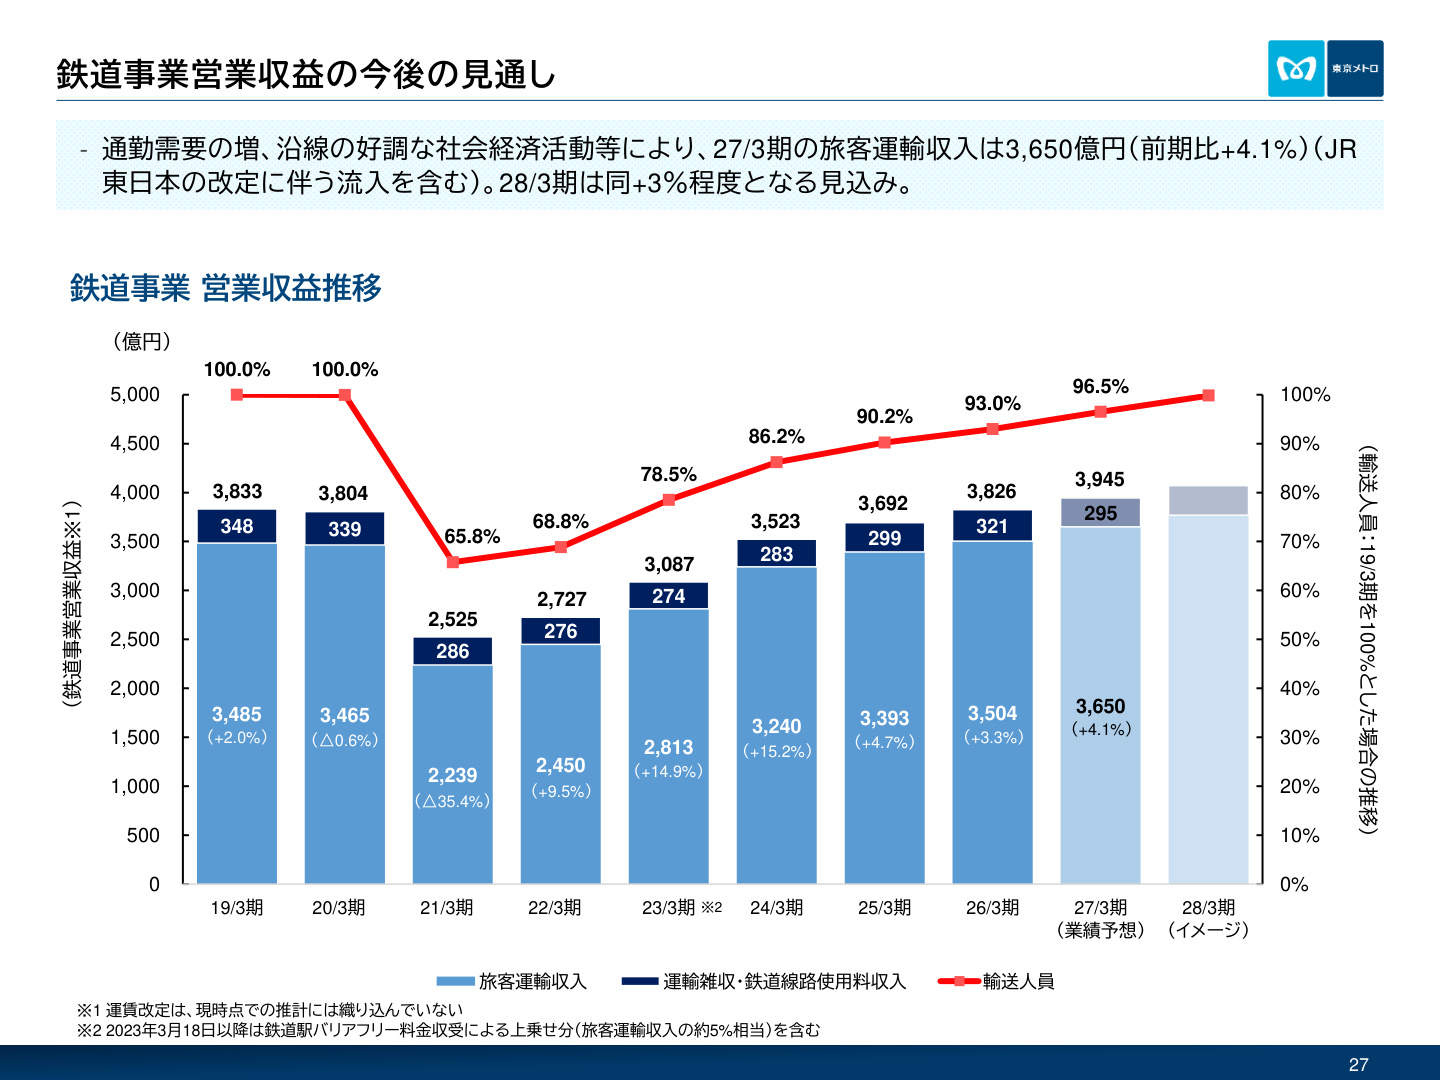
[Slide Commentary: Mid-to-Long-Term Outlook for Railway Operating Revenue] The graph above shows the recovery trajectory and future outlook for passenger volume and railway operating revenue from the COVID-19 pandemic (using the fiscal year ended March 2019 as a 100% baseline). Passenger volume, which fell to 65.8% in FY2021, is expected to recover to 96.5% in the FY2027 forecast. Passenger transportation revenue is also projected to reach 365 billion yen in FY2027 (+4.1% YoY) , with a growth scenario of approximately +3% YoY in FY2028 . Capturing inbound demand (expanding sales of special tickets and the "Tokyo City Pass") and improving convenience through credit card touch payments are key drivers of demand.
Main Pillars of Mid-to-Long-Term Strategy:
- Building a "9,000-Employee Structure" through Labor-Saving and DX : Implementing autonomous driving (GOA 2.5 demonstration on the Marunouchi Line, one-man operation on the Ginza Line) and AI-based Condition Based Maintenance (CBM) to operate the railway business efficiently with a 9,000-person workforce by FY2031.
- Growth Investment and M&A Framework : Establishing a 100 billion yen investment/M&A framework for the two-year period of FY2027 and FY2028 to create new growth drivers. A specialized organization has been set up to accelerate investments in line-side development and synergistic businesses.
- New Line Construction and Extensions of the Yurakucho and Namboku Lines : Steadily advancing projects such as the Yurakucho Line extension (Toyosu to Sumiyoshi) and Namboku Line extension (Shinagawa to Shirokane-takanawa), aiming for openings in the mid-2030s to enhance future network value.
- Consideration of Fare Revisions : Continuously evaluating the possibility of fare revisions to address structural cost increases, alongside the development of barrier-free facilities and the utilization of the additional fare system.
5. Summary and Future Focus Points
Although the Q1 FY2027 results showed a profit decline due to the reactionary effect of one-off gains and rising costs, passenger demand in the core railway business is steadily recovering , and non-railway segments such as real estate and advertising are showing strong growth .
Moving forward, the following points will be key indicators for enhancing corporate value:
- The pace of continuous expansion in non-commuter and inbound demand.
- Results in controlling labor and maintenance costs through autonomous driving and DX implementation.
- Capital allocation and ROI for new areas and real estate using the 100 billion yen growth investment framework.
- Progress on the Yurakucho and Namboku Line extension projects and measures to improve line-side value.
Tokyo Metro has entered a phase of aiming for sustainable corporate value creation through structural reform and diversification of its business portfolio, anchored by its robust central Tokyo infrastructure.
Correction (September 29, 2026): Corrected the specified amounts, rates or reporting periods against the original company disclosure; the verified changes are recorded in the correction ledger. Source
This content is not intended as investment advice or a recommendation. Any opinions expressed are solely the personal views of each article.