


NEC Capital Solutions: Q1 FY2027 Earnings Deep Dive – Growth Strategy Driven by Aggressive Asset Expansion and a New Five-Segment Structure

StockClub
Published: Jul 31, 2026, 10:39 AM
Sentiment Analysis

1. Q1 FY2027 Earnings Summary and Overview
NEC Capital Solutions (Securities Code: 8793) announced its financial results for the first quarter (Q1) of the fiscal year ending March 2027. The company reported year-on-year growth across all major profit categories—net sales, operating profit, ordinary profit, and net income—demonstrating steady earnings growth and capital accumulation .
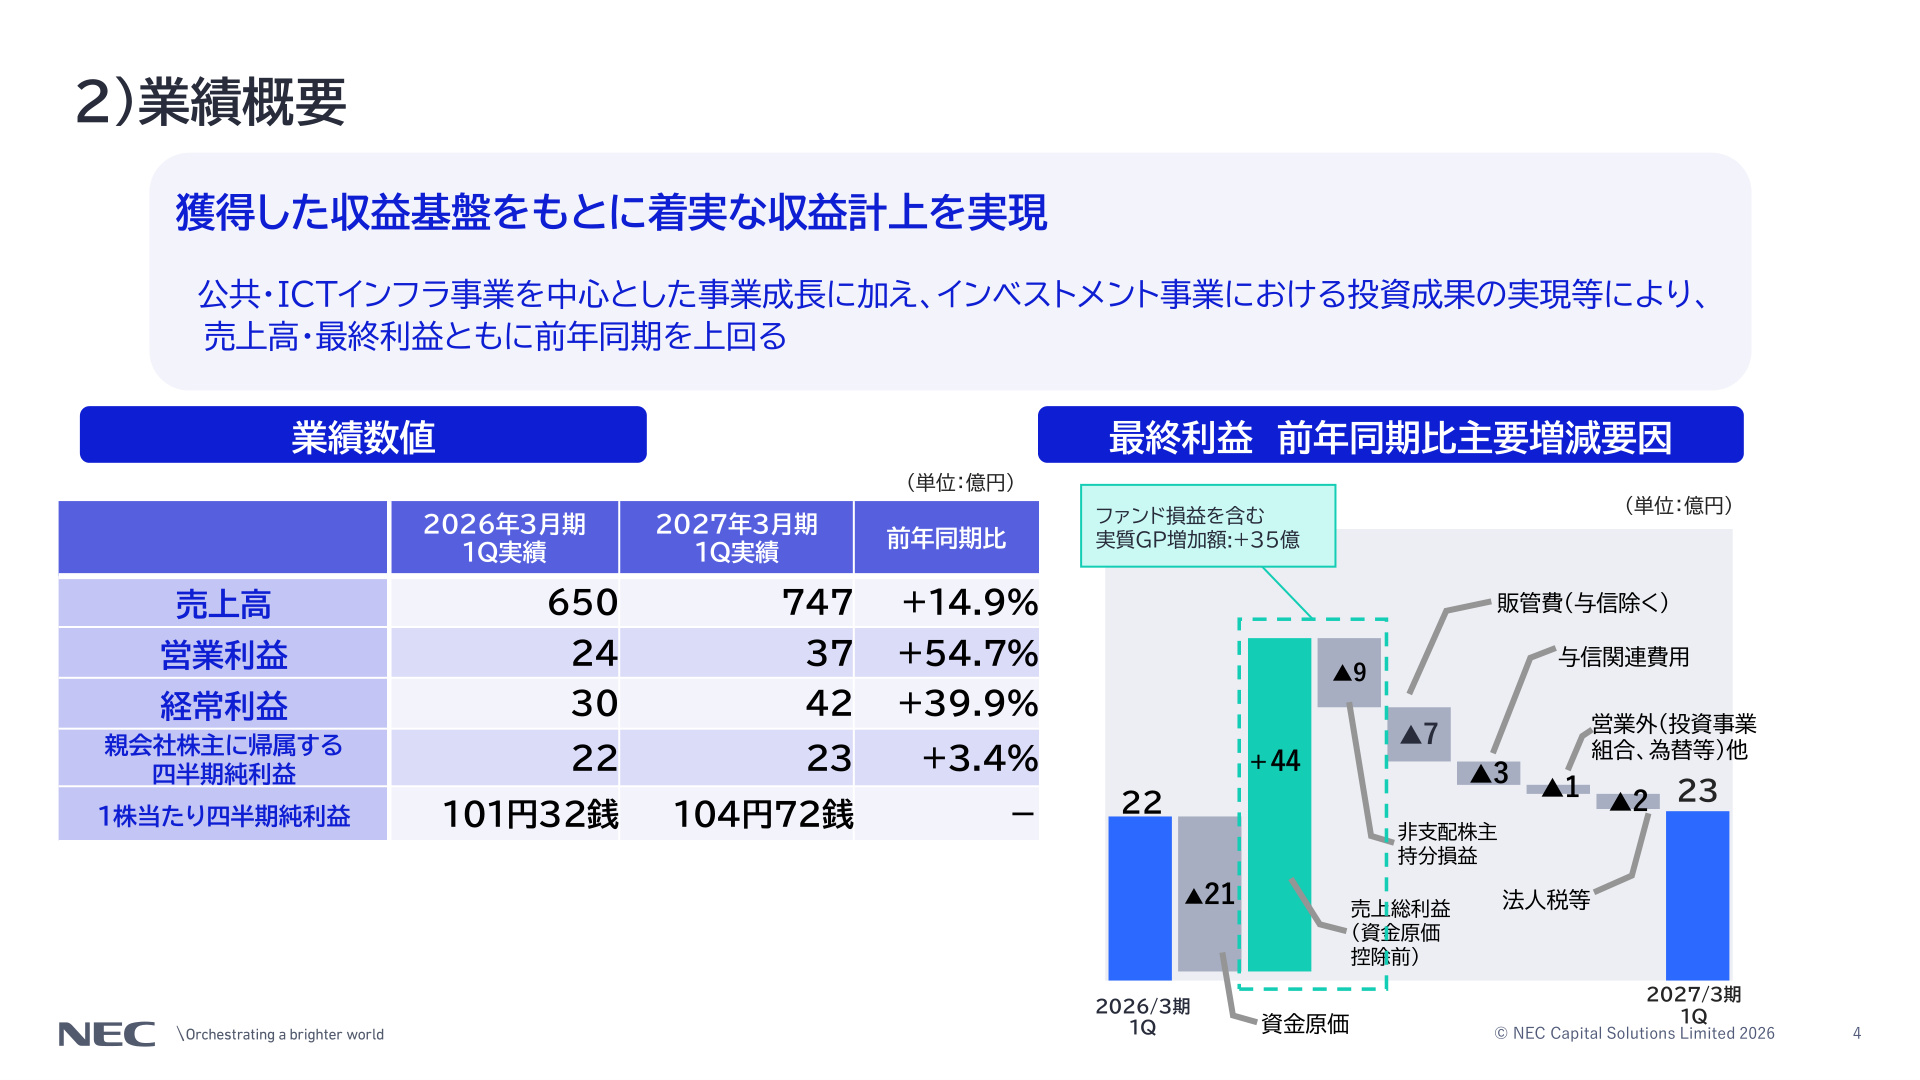
In this first quarter, consolidated net sales reached ¥74.7 billion (up 14.9% YoY) , operating profit hit ¥3.7 billion (up 54.7% YoY) , and ordinary profit rose to ¥4.2 billion (up 39.9% YoY) , marking a significant increase in profitability. Net income attributable to owners of the parent also reached ¥2.3 billion (up 3.4% YoY) , indicating a solid start to the first year of the Mid-Term Management Plan 2028.
This report provides a detailed analysis of the company’s revamped business segments, the aggressive expansion of operating assets, changes in the funding environment, and specific initiatives and future outlooks for each business segment.
2. Analysis of Consolidated Performance and Profit/Loss Drivers
The following chart illustrates the transition of the profit structure in Q1 and the detailed factors contributing to the final profit results.
[Slide Commentary: Key Drivers of Profit/Loss Changes]
The slide above (Performance Overview and Variance Analysis) clearly highlights the background behind the increase in operating and net profit. Operating profit for Q1 grew from ¥2.4 billion in the same period last year to ¥3.7 billion (+54.7%) . The primary driver was a significant increase in gross profit (before deduction of funding costs), which rose by ¥4.4 billion (a net increase of ¥3.5 billion in actual GP) .
Conversely, the main factors exerting downward pressure on profits include:
- Increase in Funding Costs (¥2.1 billion decrease) : Impacted by rising market interest rates (TIBOR and swap rates), an increase in interest-bearing debt, and temporary issuance costs for corporate bonds and loans.
- Increase in SG&A Expenses (¥0.9 billion decrease) : Higher personnel and system-related costs associated with business expansion.
- Increase in Credit-Related Expenses (¥0.7 billion decrease) : An increase in general allowance for doubtful accounts due to the accumulation of operating assets.
- Fluctuations in Non-Controlling Interests (¥0.3 billion decrease) : Adjustments for the portion of consolidated funds in the Investment business attributable to external investors.
Despite these deductions, the robust growth in the Public & ICT Infrastructure business and investment recovery results in the Investment business drove a substantial increase in gross profit, ultimately securing ¥2.3 billion in quarterly net income .
3. BS Management and Expansion of Operating Assets
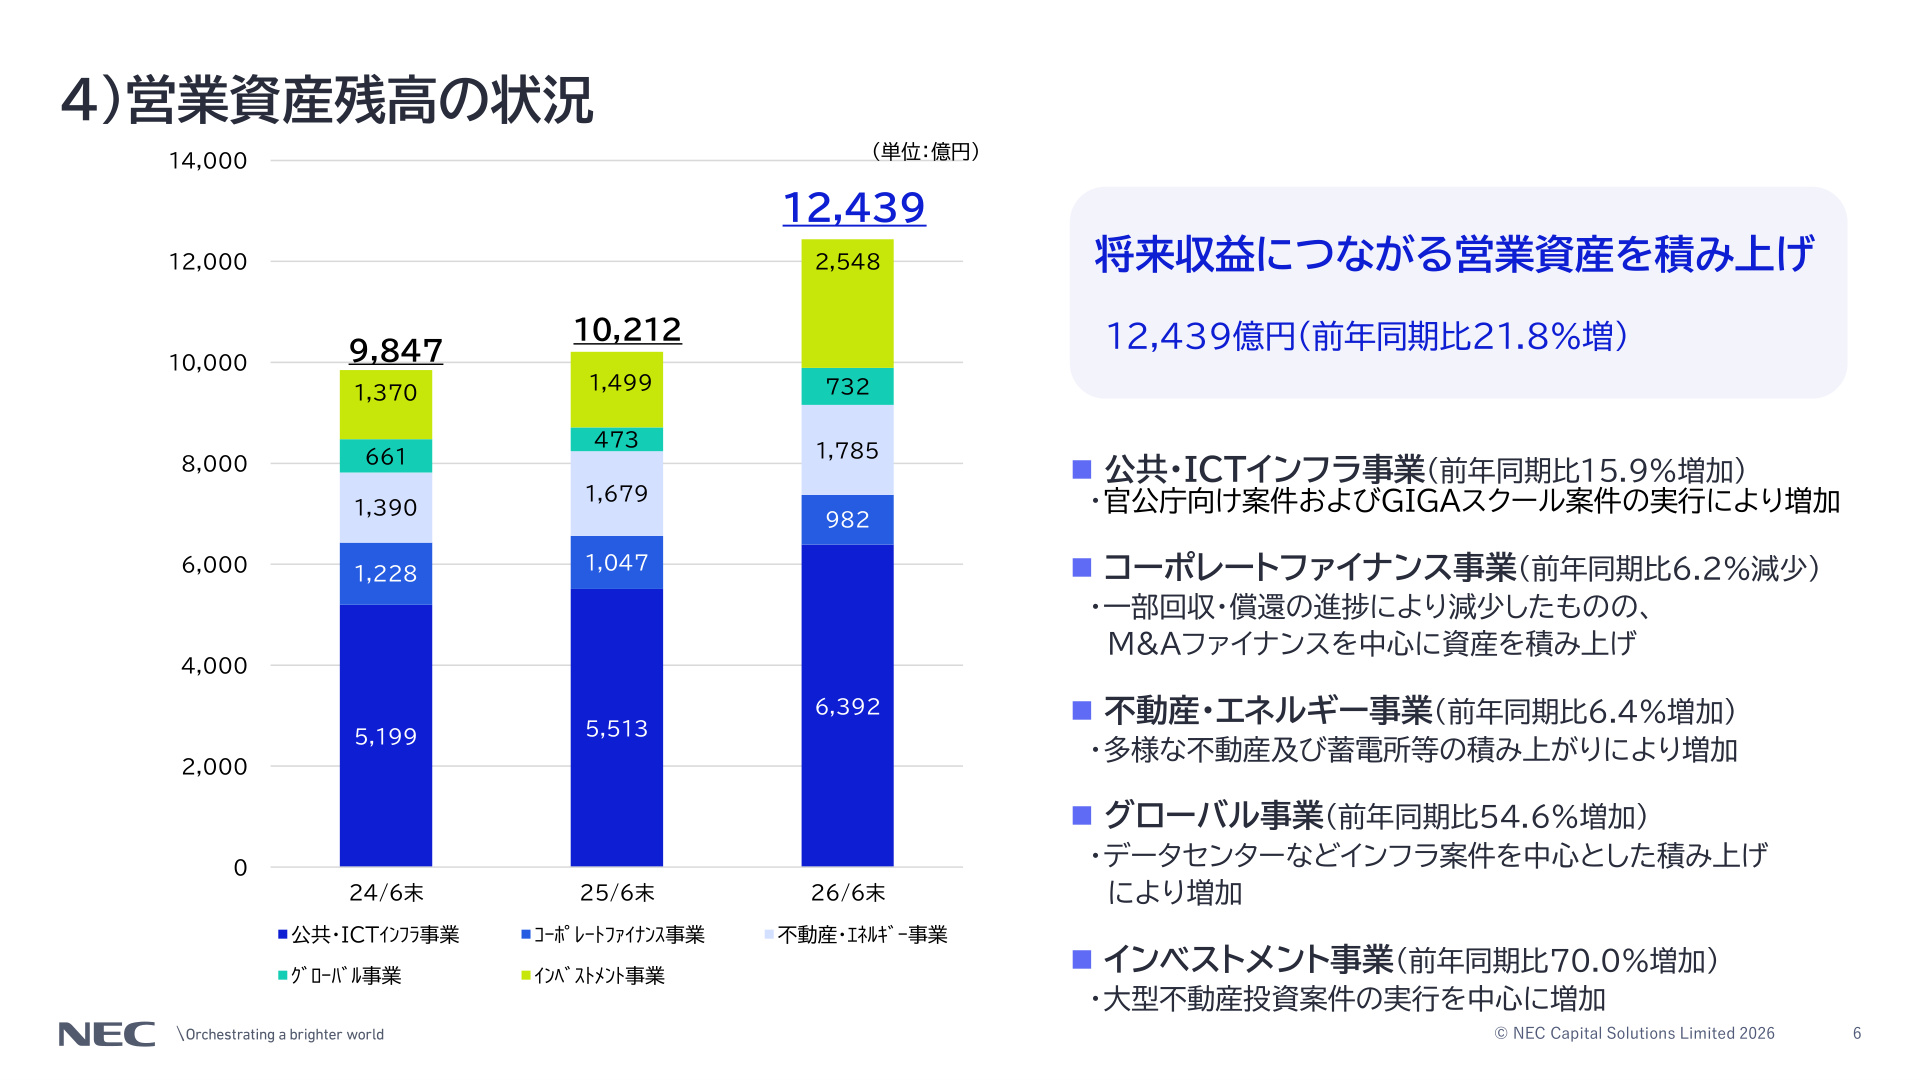
Under the "Mid-Term Plan 2028," the company is shifting from a phase of expanding its earnings base to one of improving profitability, accelerating the proactive accumulation of operating assets that will serve as future profit sources.
[Slide Commentary: Trends in Operating Asset Balances and Segment Breakdown]
The slide above (Status of Operating Asset Balances) visualizes the trends in operating assets, which form the basis for future interest income and capital gains. As of the end of June 2026 (end of Q1 FY2027), the operating asset balance reached ¥1,243.9 billion , a 21.8% increase (+¥222.7 billion) compared to the same period last year, and a 5.5% increase (+¥65.2 billion) from the end of the previous fiscal year.
Segments driving this asset expansion include:
- Public & ICT Infrastructure : ¥639.2 billion (up 15.9% YoY) , driven by government projects and replacement demand from the GIGA School Program.
- Investment Business : ¥254.8 billion (up 70.0% YoY) , primarily due to the execution of large-scale real estate investment projects.
- Global Business : ¥73.2 billion (up 54.6% YoY) , fueled by data center and overseas infrastructure projects.
[Funding Base and Financial Soundness]
With the expansion of operating assets, total assets grew to ¥1,396.5 billion (up 4.1% from the previous year-end) , and interest-bearing debt increased to ¥1,144.0 billion (up ¥170.9 billion) . The equity ratio temporarily declined from 9.7% at the end of the previous fiscal year to 9.4% (-0.3pt) due to the expansion of total assets from growth investments. However, the company aims to maintain and recover the equity ratio to over 10% by the end of March 2027 through the selection of high-quality investments, the promotion of asset-turnover business models, and profit accumulation.
Regarding funding, while the funding cost ratio rose from 1.14% to 1.75% due to higher market interest rates, the company has increased its direct procurement ratio to 35.7% through corporate bond issuances and is strengthening its resilience against interest rate hike risks by fixing interest rates and diversifying funding sources.
4. Transition to a New Segment Structure and Progress Analysis
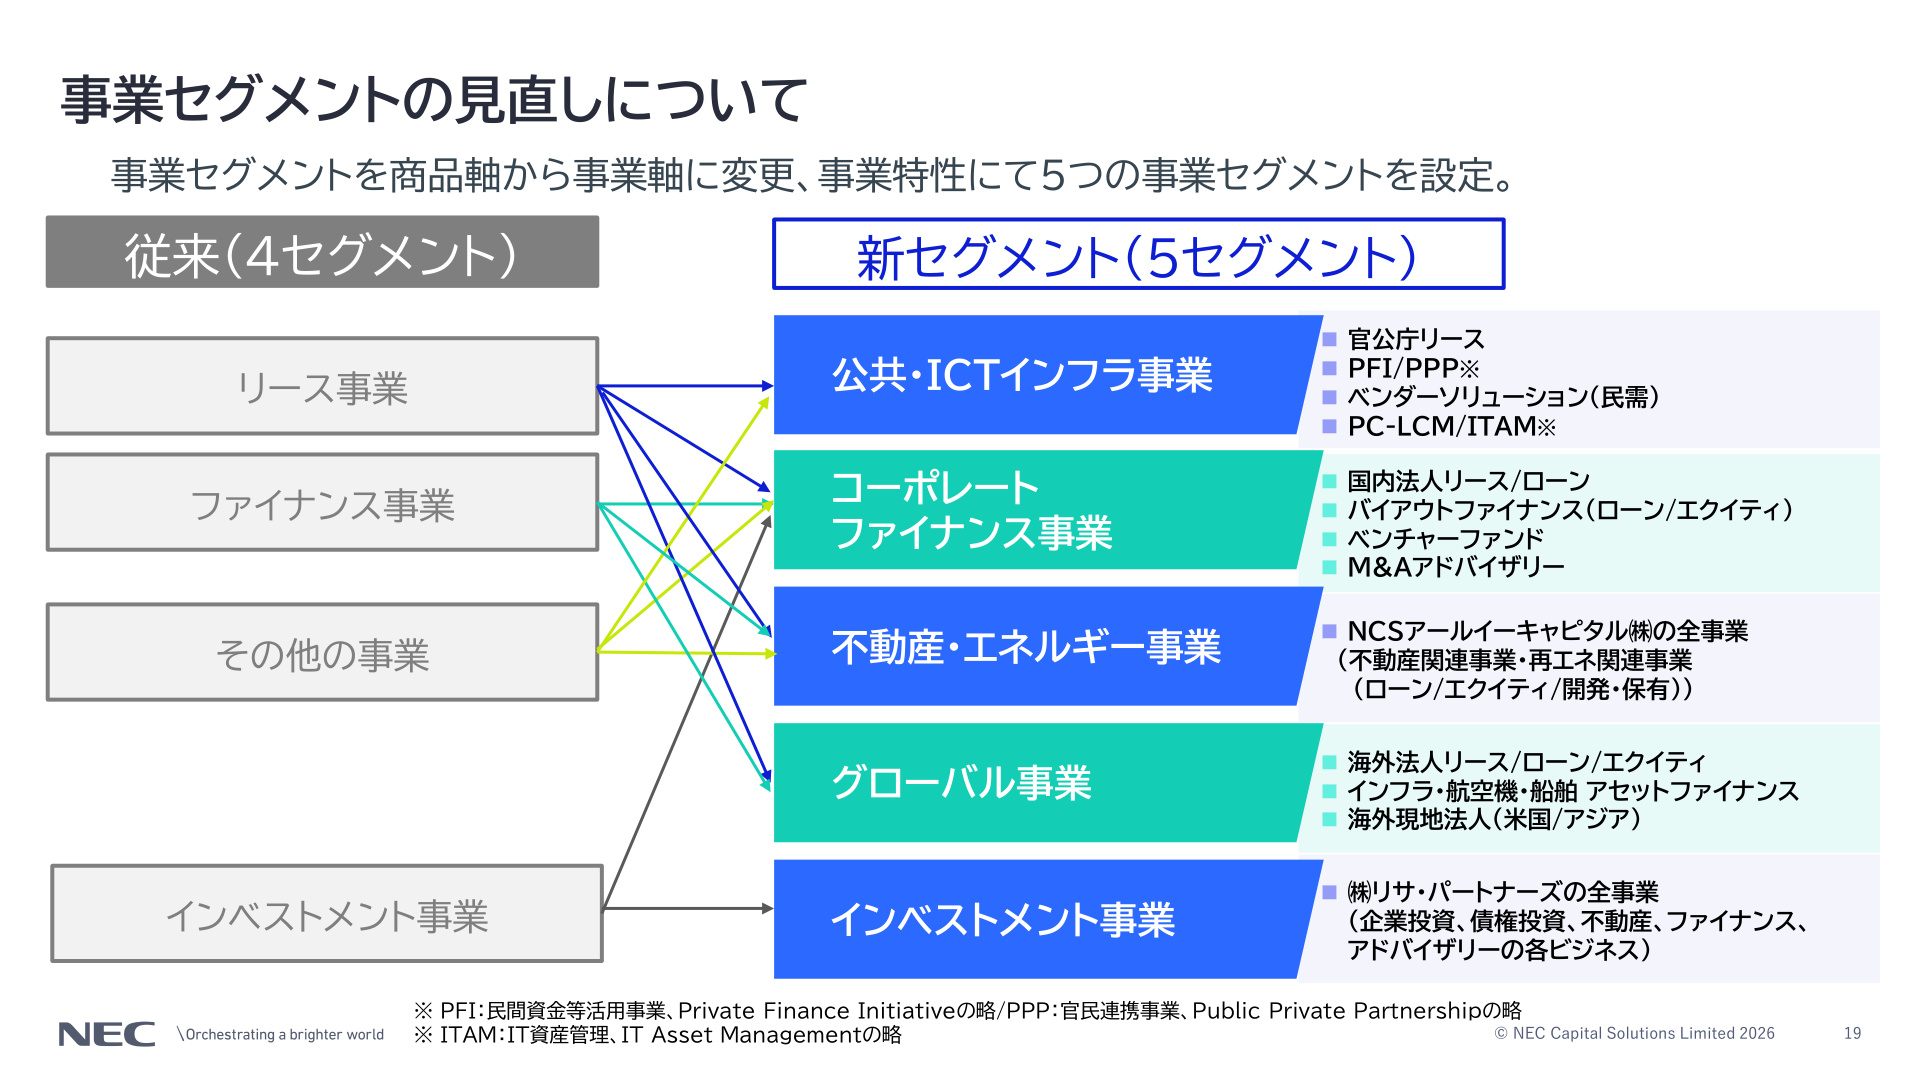
Starting this fiscal year, the company has reorganized its business segments from the traditional "product-based" (4 segments) structure to a "business-based" (5 segments) structure, aligned with customer attributes and market characteristics.
[Slide Commentary: Background of Segment Review and New Structure]
The slide above shows the transition from the traditional "Leasing," "Finance," "Investment," and "Other" classifications to five new segments: "Public & ICT Infrastructure," "Corporate Finance," "Real Estate & Energy," "Global," and "Investment." This reorganization aims to provide optimal solutions tailored to market needs and clarify risk-return management.
Performance trends and strategic positioning for each new segment in Q1 are as follows:
① Public & ICT Infrastructure (Earnings Pillar)
- Performance : Net sales of ¥59.4 billion (up 11.6% YoY), operating profit of ¥1.1 billion ( up 120.6% YoY ).
- Key Points : Successfully captured replacement demand for government projects (contract execution of ¥48.2 billion, including ¥13.0 billion for GIGA School-related projects), securing a total contract execution of ¥85.7 billion. Asset balance remains stable at ¥639.2 billion (up 15.9% YoY) .
② Corporate Finance (Shift Toward High Profitability)
- Performance : Net sales of ¥3.7 billion (down 7.4% YoY), operating profit of ¥0.2 billion (down 50.9% YoY).
- Key Points : Operating asset balance contracted to ¥98.2 billion (down 6.2% YoY) due to the recovery/redemption of certain large-scale projects. Moving forward, the company plans to shift from standard lending to high-profit areas such as M&A finance, LBO mezzanine, and venture investment to improve portfolio quality.
③ Real Estate & Energy (Fusion of Capital and Income Gains)
- Performance : Net sales of ¥2.9 billion (down 27.1% YoY), operating loss of ¥0.03 billion (compared to ¥0.1 billion profit in the same period last year).
- Key Points : Experienced a temporary decline due to the absence of large-scale real estate sales recorded in the previous year, but progress remains on track with the full-year plan. Operating assets grew to ¥178.5 billion (up 6.4% YoY) , with plans to accumulate energy-related assets such as battery storage projects and structured finance alongside logistics and commercial real estate.
④ Global Business (Return to Profitability and High Growth)
- Performance : Net sales of ¥1.5 billion (up 52.6% YoY), operating profit of ¥0.2 billion ( turnaround from a ¥0.1 billion loss in the same period last year).
- Key Points : Benefited from cost-cutting at overseas subsidiaries and the accumulation of data center, overseas PPP, and infrastructure assets. Operating assets grew significantly to ¥73.2 billion (up 54.6% YoY) .
⑤ Investment Business (Fund Management and Asset Business)
- Performance : Net sales of ¥7.2 billion (up 150.9% YoY), operating profit of ¥1.8 billion ( up 116.0% YoY ). Note: Real profit after non-controlling interest deduction is ¥0.9 billion (down 0.7% YoY).
- Key Points : Recorded significant growth driven by corporate investments and asset business recoveries led by subsidiary Lisa Partners. Operating assets surged to ¥254.8 billion (up 70.0% YoY) due to the acquisition of large-scale real estate assets.
5. Full-Year Earnings Forecast and Shareholder Return Policy
The company has maintained its initial full-year consolidated earnings and dividend forecasts for the fiscal year ending March 2027.
[FY2027 Full-Year Consolidated Earnings Forecast]
- Net Sales : ¥310.0 billion (+¥3.8 billion / +1.2% YoY)
- Operating Profit : ¥16.5 billion (+¥5.9 billion / +55.7% YoY)
- Ordinary Profit : ¥17.0 billion (+¥5.6 billion / +49.1% YoY)
- Net Income Attributable to Owners of the Parent : ¥10.0 billion (+¥0.8 billion / +8.7% YoY)
- Earnings Per Share (EPS) : ¥464.15
Achieving ¥10.0 billion in net income would mark a record high profit . With ¥2.3 billion (23% progress) recorded in Q1, and considering the company's business model where project recoveries and profit recognition are concentrated in the second half, the progress is evaluated as favorable.
[Shareholder Return Policy]
- Annual Dividend Forecast : ¥150 per share (Interim ¥75, Year-end ¥75).
- The company maintains its policy of high-level dividends, consistent with the previous fiscal year, demonstrating a strong commitment to shareholder returns.
6. Comprehensive Analysis and Future Focus Points
NEC Capital Solutions' Q1 FY2027 results clearly reflect the strengths and challenges of each business under the new segment structure. Three points are particularly noteworthy for the company's sustainable growth:
- Expansion of Operating Assets and BS Management : With operating assets exceeding ¥1.24 trillion, the medium-to-long-term earnings base has strengthened. The key will be how the company maintains and recovers its equity ratio to the year-end target of over 10% (currently 9.4%) through improved asset turnover and appropriate risk-weight control.
- Management of Funding Costs and Spreads : As the funding cost ratio rises to 1.75% due to higher market rates, the focus will be on whether risk-hedging measures (such as increasing the direct procurement ratio to 35.7% and fixing interest rates) and portfolio restructuring toward high-yield assets (LBO mezzanine, high-profit real estate/infrastructure) can effectively maintain spreads.
- GIGA School Demand and Growth Business Development : The continued capture of GIGA School replacement demand (¥13.0 billion in Q1), the profitability of the Global business (data centers), and the continuity of asset recoveries in the Investment business will serve as the primary drivers for achieving record-high profits for the full year.
This content is not intended as investment advice or a recommendation. Any opinions expressed are solely the personal views of each article.