

Sparx Group Q1 FY2027 Earnings Deep Dive: A Growth Story Driven by Record AUM and Expanding Core Earnings

Sentiment Analysis
Sparx Group Co., Ltd. delivered an exceptionally strong start to the fiscal year ending March 31, 2027, with its Q1 results (April 1, 2026 – June 30, 2026) marked by record-high Assets Under Management (AUM) and a dramatic expansion in core earnings . The company is simultaneously enhancing capital efficiency and shareholder returns through robust investment performance in its flagship Japanese equity and Korean equity (OneAsia) funds, the execution of principal investments, and a significant upward revision of its dividend forecast.
This report provides a detailed analysis of the company’s earnings structure, segment performance, and mid-to-long-term growth strategy, centered on 10 key topics extracted from the earnings presentation materials.
1. Earnings Highlights: Significant Revenue and Profit Growth with High Capital Efficiency
Consolidated results for Q1 FY2027 showed remarkable year-on-year growth:
- Operating Revenue : 5.606 billion JPY ( +40.8% YoY)
- Operating Profit : 2.754 billion JPY ( +80.8% YoY)
- Ordinary Profit : 2.697 billion JPY ( +72.4% YoY)
- Net Income Attributable to Owners of Parent : 2.900 billion JPY ( +77.6% YoY)
- ROE (Return on Equity) : 29.1% ( +9.4 percentage points YoY)
The primary drivers of this profit surge were the expansion of management fees (3.931 billion JPY, +26.2% YoY) resulting from AUM growth, and a substantial increase in performance fees (803 million JPY, +448.5% YoY) due to strong investment performance. Additionally, the booking of 1.528 billion JPY in gains on the sale of investment securities as extraordinary income further boosted net income.
2. Evolution of AUM and Core Earnings
The most critical concept for understanding the company's revenue structure is the correlation between "Core Earnings" and "AUM." Core Earnings is a management accounting metric calculated by subtracting recurring expenses from management fees (net of commissions). It represents the "sustainable and stable earning power of the business," independent of short-term market fluctuations or volatile performance fees.
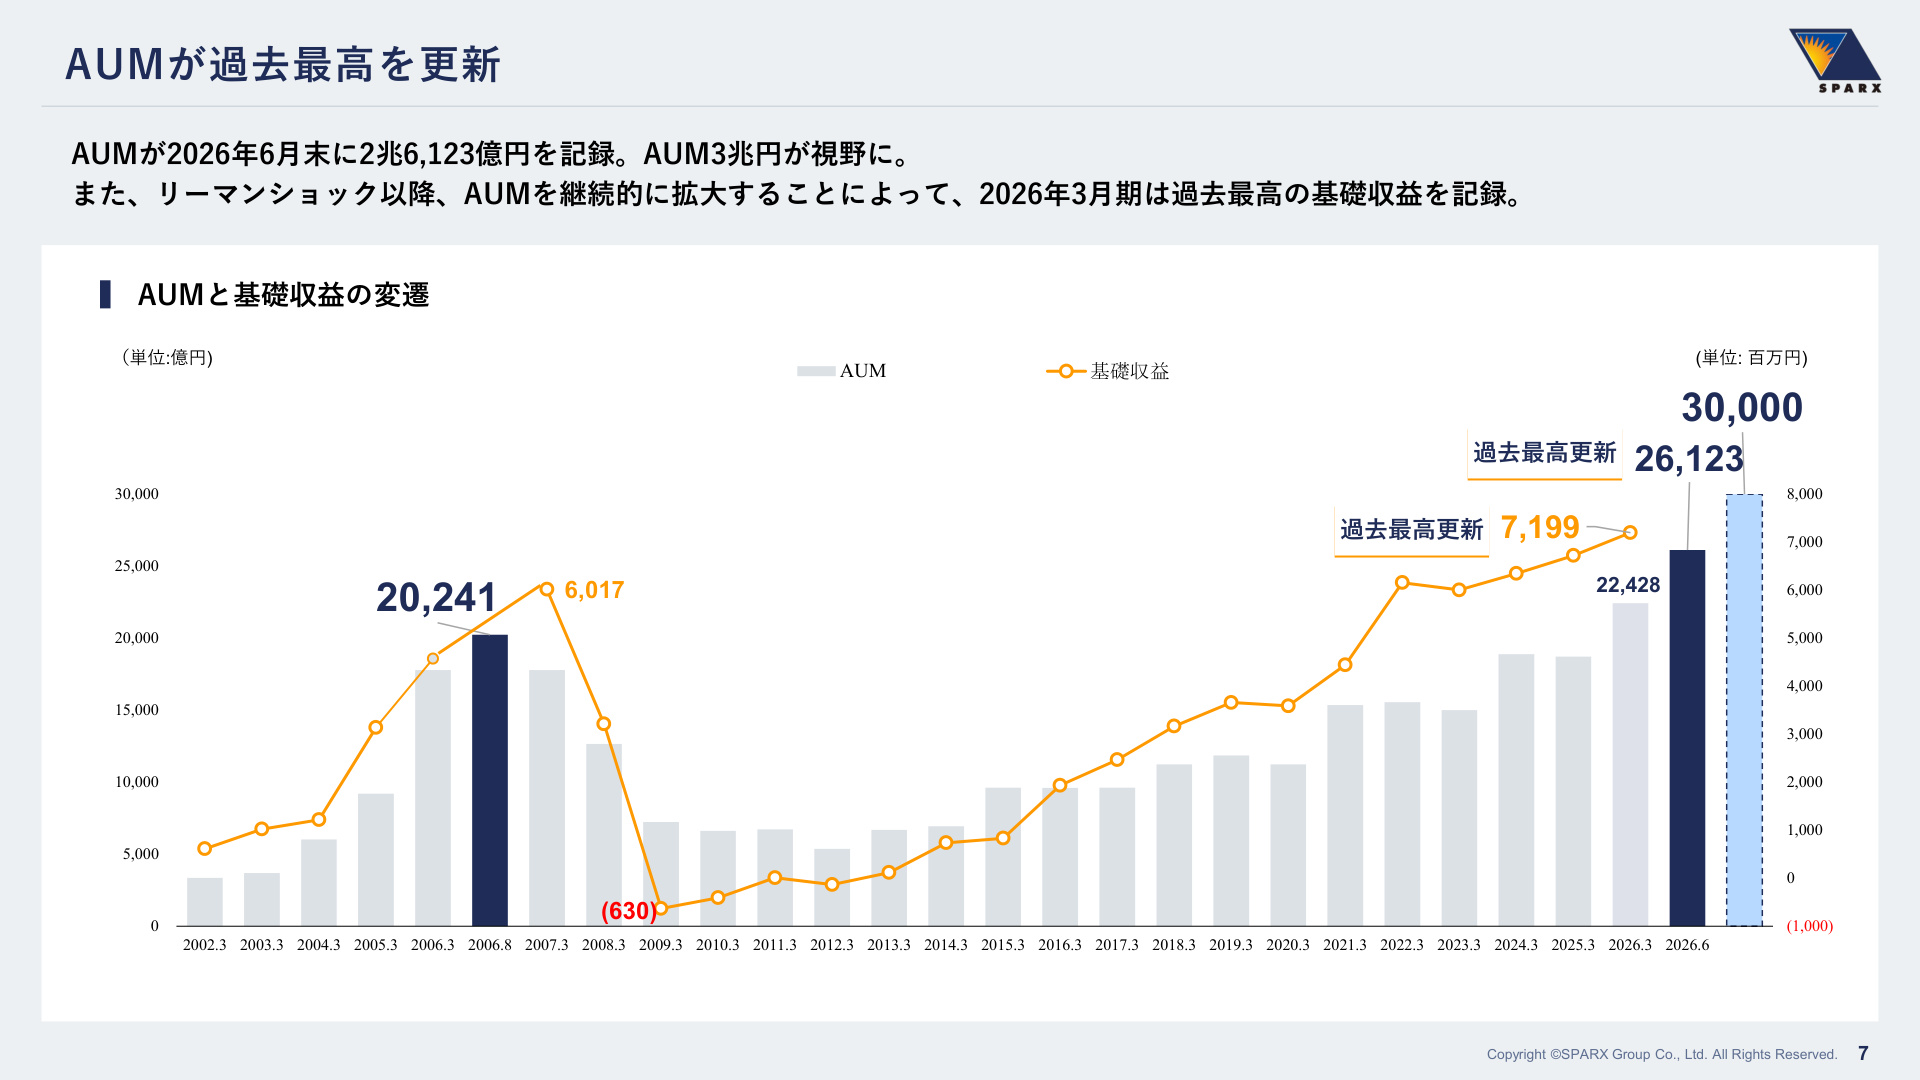
The graph above illustrates the long-term trends in AUM and Core Earnings since 2002. Despite a temporary dip in Core Earnings during the 2008 Lehman Shock (negative 630 million JPY), the company has consistently strengthened its stock-based revenue foundation.
As of the end of June 2026, AUM reached 2.6123 trillion JPY , setting a new record. With the 3 trillion JPY milestone now in sight, this sustained accumulation of AUM has served as the engine driving quarterly Core Earnings to a record high of 2.312 billion JPY (+47.2% YoY) .
3. Analysis of Key Performance Indicators (KPIs)
A granular analysis of the key management KPIs for the first quarter clarifies the mechanism behind the company's revenue expansion.
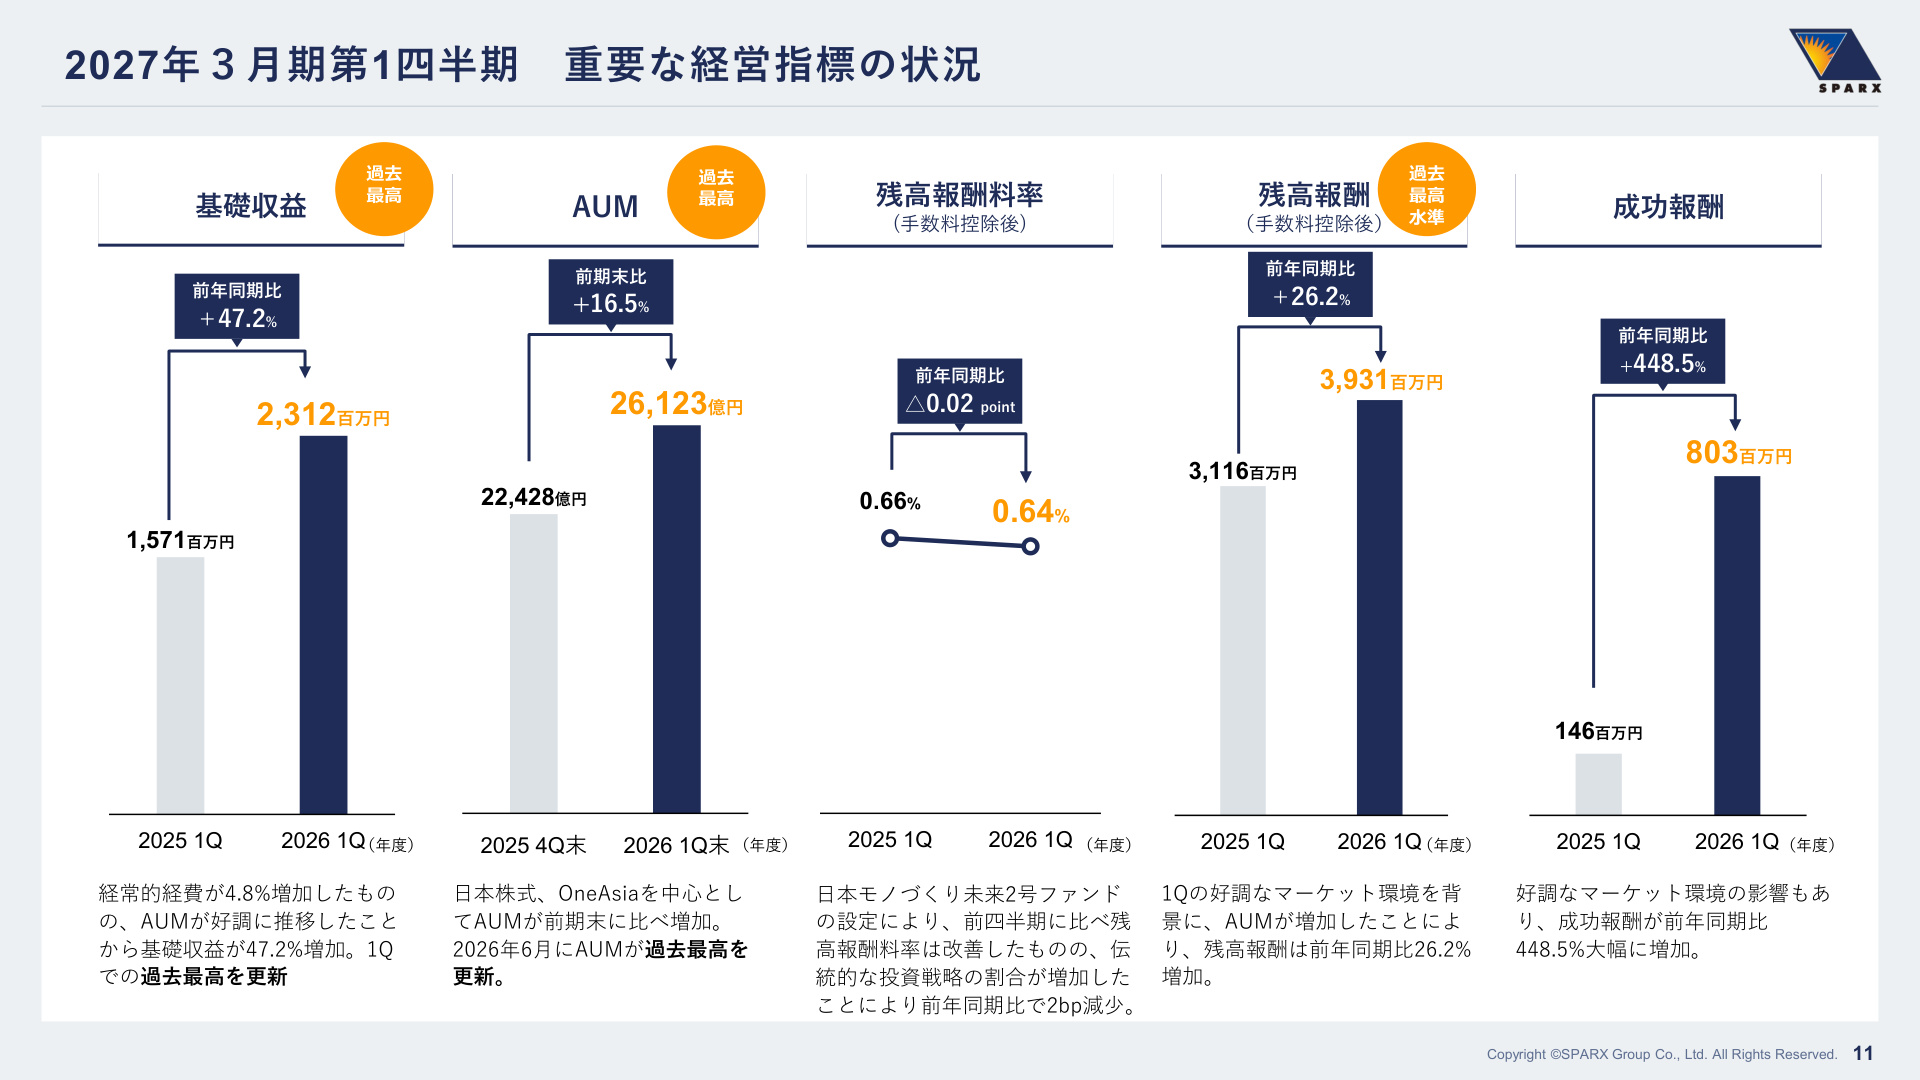
This slide intuitively displays the movements of key KPIs in Q1. The background and implications of each indicator are as follows:
- Core Earnings (2.312 billion JPY / +47.2%) : Driven by steady AUM growth and disciplined control of recurring expenses (up only 4.8% YoY to 1.619 billion JPY), the company leveraged high marginal profit ratios to achieve significant profit growth.
- AUM (2.6123 trillion JPY / +16.5% vs. end of previous fiscal year) : Growth in Japanese equity and OneAsia strategies strongly drove the overall scale expansion.
- Management Fee Rate (0.64% / -0.02 points) : While the launch of the "Japan Monozukuri Future Fund No. 2" increased the proportion of high-fee funds, the overall rate saw a slight decline due to the increased weight of traditional investment strategies (e.g., Japanese equities).
- Management Fees (3.931 billion JPY / +26.2%) : Stable management fees grew significantly as average AUM expanded to 2.5495 trillion JPY (+32.3% YoY).
- Performance Fees (803 million JPY / +448.5%) : Against the backdrop of a booming Japanese equity market, the performance of funds with performance-fee structures improved, contributing significantly to earnings.
4. Overview by Focus Area
(1) Japanese Equity Strategy
- AUM : 1.7406 trillion JPY (vs. end of March 2026: +14.6% )
- Riding the wave of a strong stock market, the "Long-term Selected Investment Strategy (1.0246 trillion JPY)" and "Small/Mid-cap Investment Strategy (496.4 billion JPY)" led the AUM growth. The "Long-Short Investment Strategy (134.9 billion JPY)" also grew assets due to strong performance. Notably, the net assets of the "Sparx New International Excellent Japan Equity Fund (Nickname: Selected Investment)" reached 300 billion JPY.
(2) OneAsia Strategy (Korean/Asian Equities)
- AUM : 350.6 billion JPY (vs. end of March 2026: +46.4% )
- AUM for Korean equity funds surged to 329.5 billion JPY (+51.3% vs. previous period). In a market environment where the KOSPI rose by 67.8%, the company achieved overwhelming performance, outperforming benchmarks (with a 3-year cumulative performance of 292.24% for Korean-domiciled funds), attracting interest and capital from Western institutional investors.
(3) Real Assets (Renewable Energy & Energy Storage)
- AUM : 326.1 billion JPY (flat vs. end of March 2026)
- The company invests in 348 renewable energy power plants (approx. 725MW) across Japan. As a new focus area, it announced participation in a large-scale energy storage project in Niigata City, Niigata Prefecture (SGET Niigata Energy Storage Station: rated output approx. 22.7MW, rated capacity approx. 70.2MWh, scheduled for commercial operation in May 2028) . This is the first energy storage project in the Tohoku area in collaboration with SMFL Mirai Partners, aiming to secure new revenue sources for power grid stabilization.
(4) Private Equity (PE)
- AUM : 194.9 billion JPY (vs. end of March 2026: +23.3% )
- In April 2026, the company launched the "Japan Monozukuri Future Fund No. 2 (AUM 52.9 billion JPY)" and the "Mirai Creation Fund No. 4." Portfolio companies have seen successful IPOs, with GO Inc. (a portfolio company of Mirai Creation Fund No. 1) listing on the Tokyo Stock Exchange (TSE) Growth Market, and Tier IV, Inc. receiving approval for listing on the TSE Growth Market.
5. PE AUM Diversification Strategy
In its PE business, the company is pursuing a unique strategy to overcome AUM declines caused by fund lifecycles.
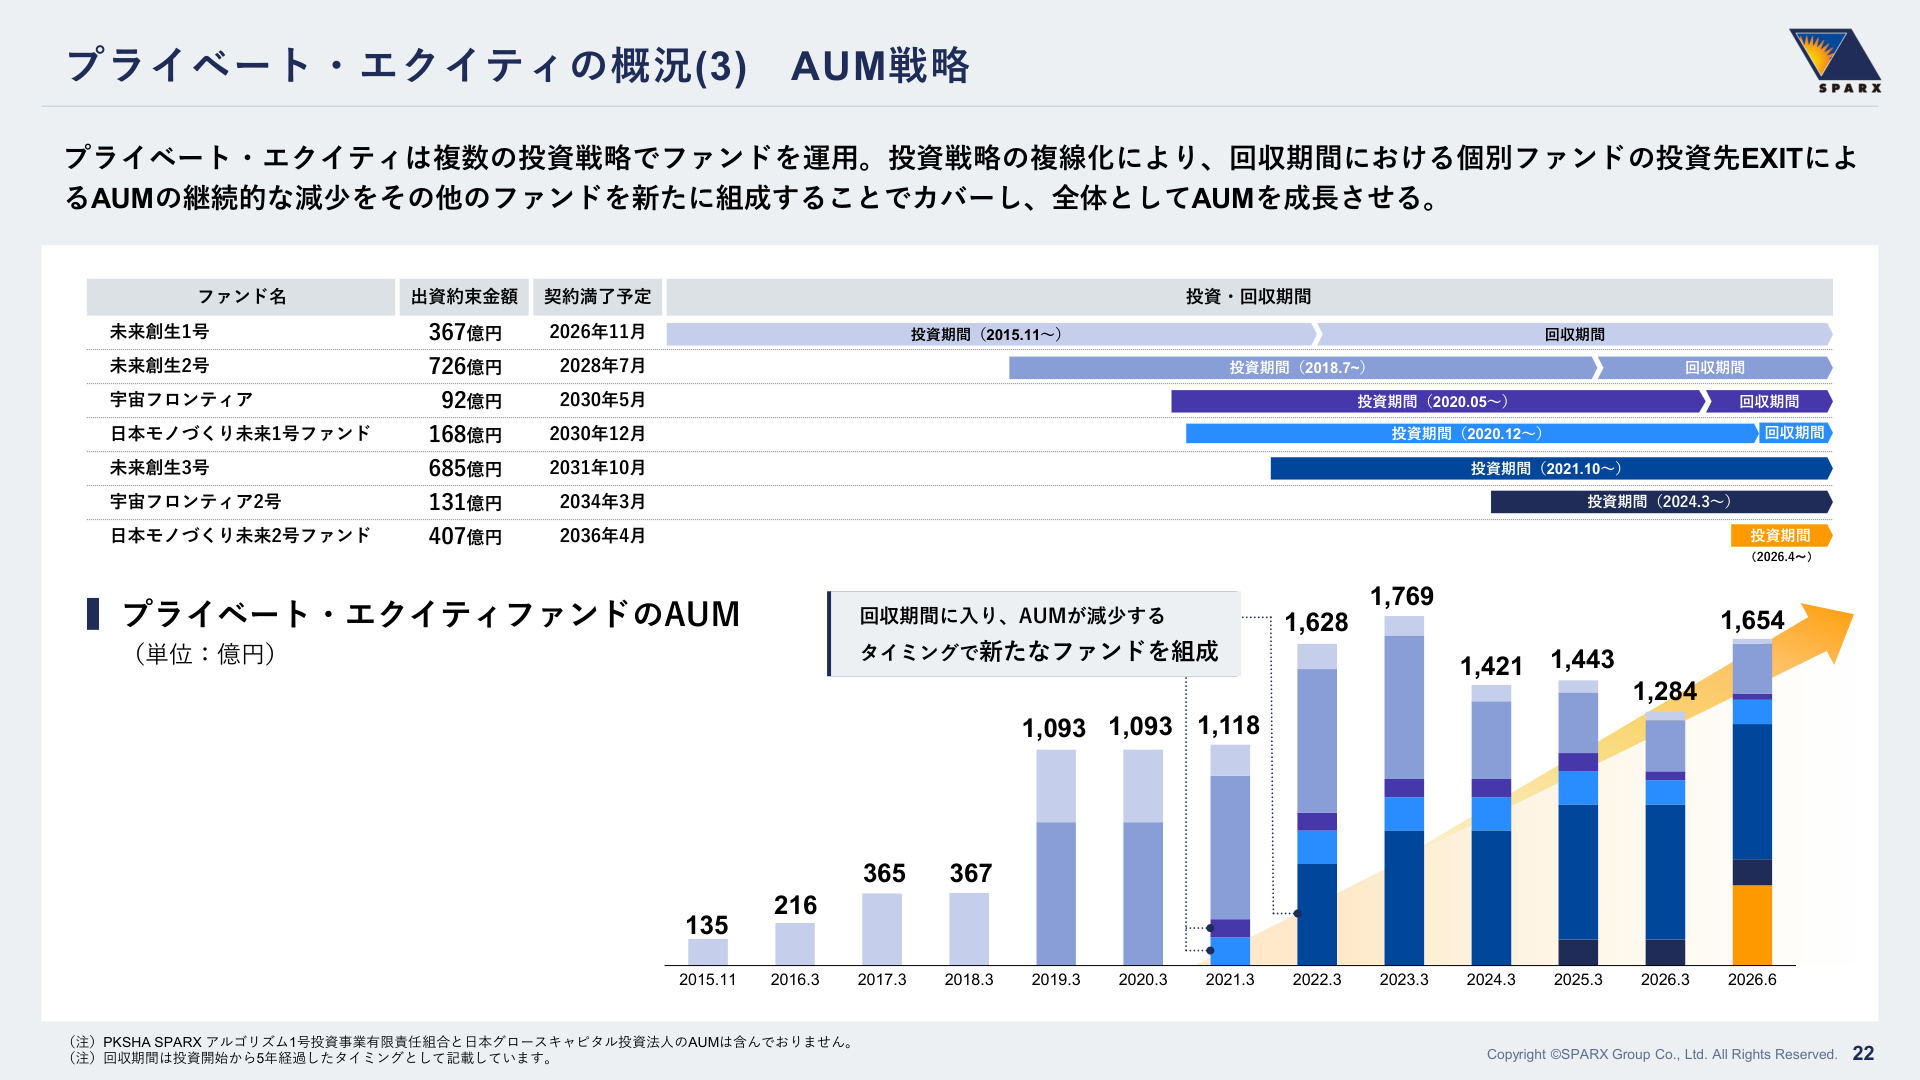
The chart above shows the concept and track record of the company's "AUM Diversification Strategy." PE funds typically experience a continuous decline in AUM as they enter the "harvest period" (after an investment period of approx. 5 years) due to exits (sales or IPOs). Sparx mitigates this by launching next-generation funds (e.g., Mirai Creation 3, 4, Space Frontier 2, Japan Monozukuri Future 2) in stages to coincide with the harvest periods of existing funds.
This multi-track fund structure compensates for AUM decay from exits with capital raised for new funds, driving the overall PE AUM upward (165.4 billion JPY as of June 2026, excluding notes). According to Preqin data, the company ranks 3rd in Japan (1,676 USD MN) for domestic venture capital fundraising, demonstrating a significant market presence.
6. Principal Investment and Capital Allocation/Shareholder Return Policy
Execution of Principal Investment (First Project)
To improve capital efficiency (ROE) using cash on hand, the company has established a principal investment quota of approx. 4 billion JPY . As its first project, it acquired all shares of M&I Art Co., Ltd. , which specializes in art appraisal and brokerage, from Mori Building Co., Ltd. (effective June 30, 2026). The goal is to generate stable cash flow and enhance corporate value through Sparx's research and engagement capabilities, aiming for high investment returns (capital efficiency exceeding the company's ROE).
Upward Revision of Dividend Forecast
Based on steady growth in Core Earnings and strong performance, the company has decided to expand shareholder returns.
- Annual Dividend Forecast per Share : Previous 94.0 JPY ➔ Revised 110.0 JPY (+16.0 JPY increase)
- Interim Dividend : 55.0 JPY (previously 47.0 JPY)
- Year-end Dividend : 55.0 JPY (previously 47.0 JPY)
Supported by steady growth in Core Earnings and robust financial health, the company is demonstrating a commitment to balancing future growth investments (principal investments and new fund contributions) with proactive shareholder returns.
7. Outlook and Conclusion
Sparx Group's Q1 FY2027 results confirm a solid growth trajectory across three key points:
- Solidification of Stock-based Revenue : With AUM expanding to 2.61 trillion JPY, management fees and Core Earnings—the foundation of the business—have reached record levels.
- Success of Multi-Asset Expansion : Revenue sources are diversifying beyond Japanese equities to include Korean equities (OneAsia), real assets (renewables/storage), and a steady pipeline of new private equity funds.
- Simultaneous Pursuit of Capital Efficiency and Shareholder Returns : The company has clearly articulated its strategy through ROE-enhancing principal investments, such as the M&I Art acquisition, and a commitment to shareholder returns, evidenced by the dividend increase to 110 JPY per share.
The combination of stable stock-based revenue growth and the generation of "shot" revenue (performance fees and extraordinary gains) leveraging market conditions indicates that the company's mid-to-long-term corporate value enhancement story is being executed steadily.
This content is not intended as investment advice or a recommendation. Any opinions expressed are solely the personal views of each article.