


Traders Holdings: Q1 FY2027 Earnings Deep Dive Report

StockClub
Published: Jul 31, 2026, 10:37 AM
Sentiment Analysis

1. Earnings Highlights and Progress Against Full-Year Targets
Traders Holdings Co., Ltd. achieved significant profit growth in its Q1 FY2027 (April–June 2026) consolidated results , despite a challenging market environment characterized by low volatility.
Key performance metrics for the first quarter are as follows:
- Operating Revenue : ¥3,974 million (+31.7% YoY)
- Operating Profit : ¥2,097 million (+50.2% YoY)
- Ordinary Profit : ¥2,080 million (+47.3% YoY)
- Profit Attributable to Owners of Parent : ¥1,426 million (+32.1% YoY)
- Operating Profit Margin : 52.8% (+6.6 percentage points YoY)
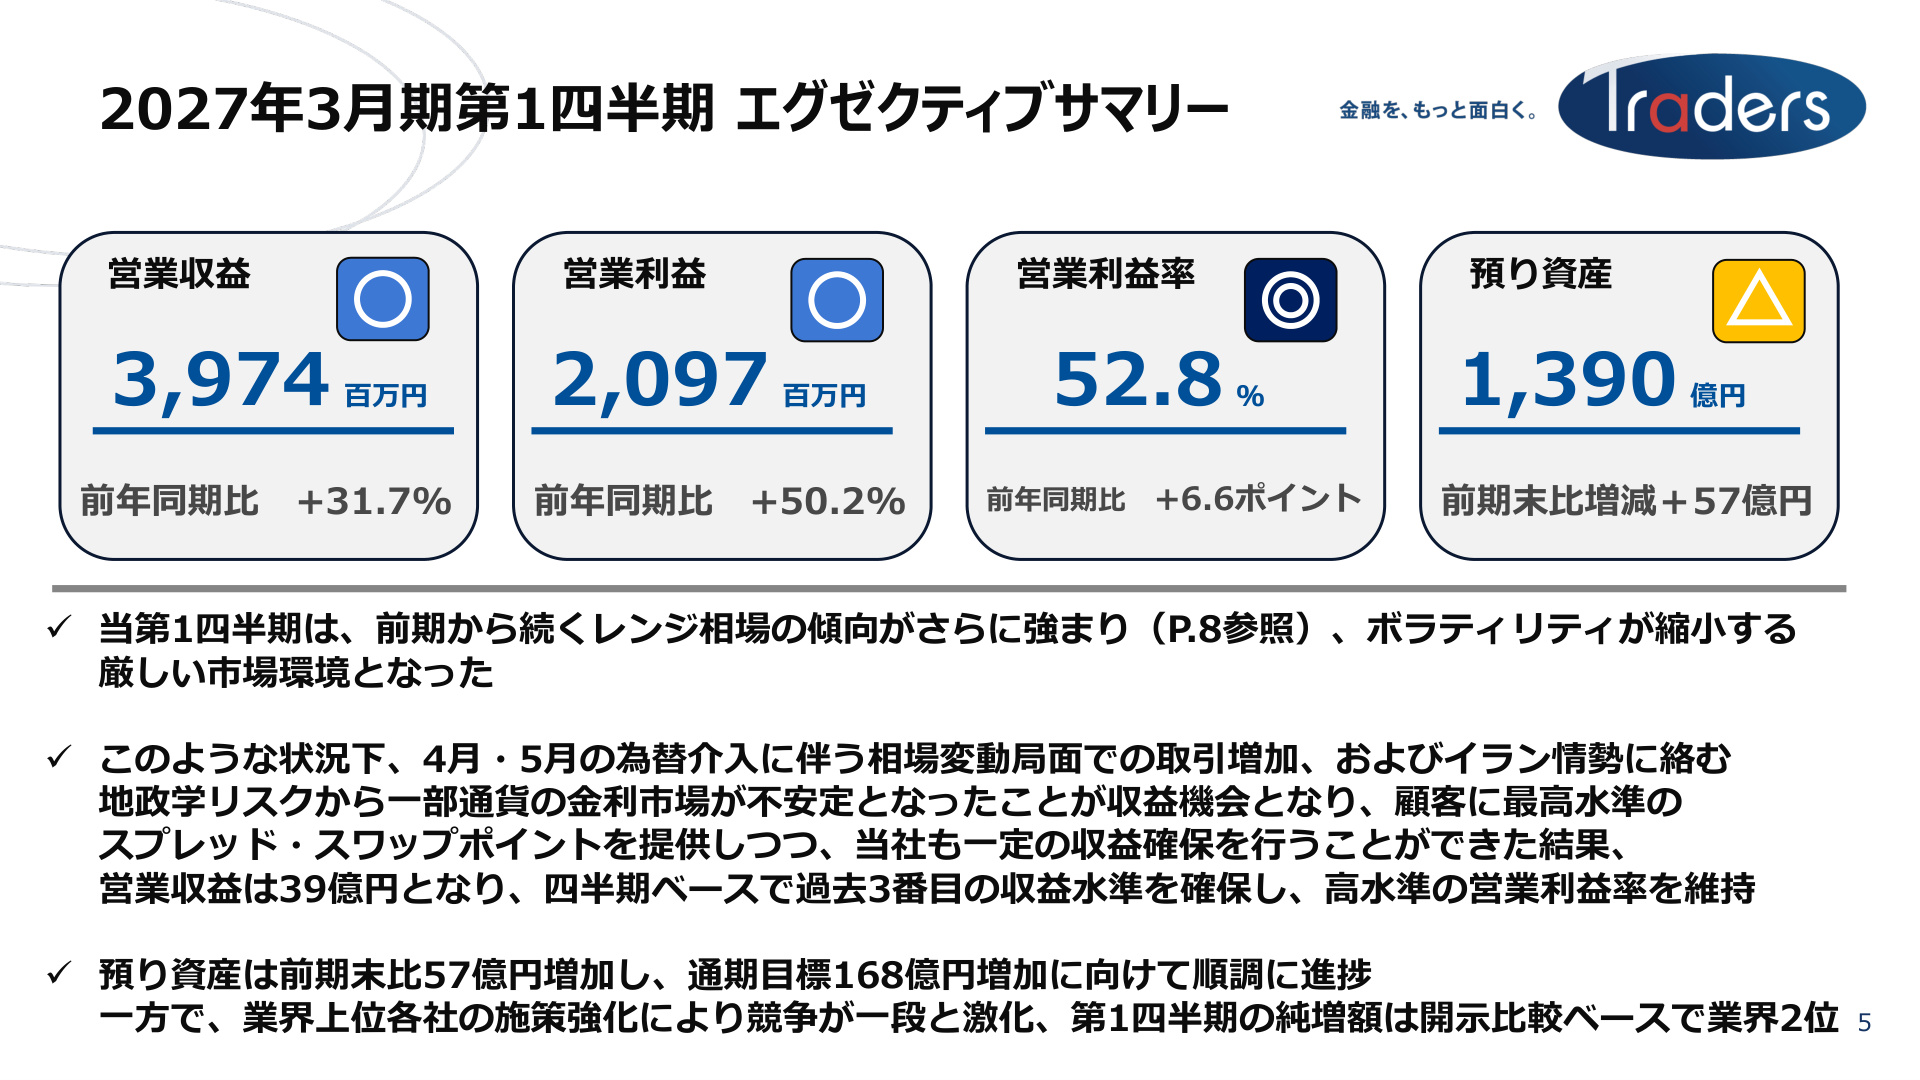
Executive Summary and Slide Significance
The slide above provides the most critical overview of the quarter's performance. Revenue reached its third-highest level on a quarterly basis , with operating profit (+50.2%) growing at a pace significantly outpacing the growth in operating revenue (+31.7%). This resulted in a high level of profitability, with an operating profit margin of 52.8% .
The progress against full-year earnings forecasts is off to a strong start:
- Operating Revenue Progress : 25.3% (Full-year forecast: ¥15,700 million)
- Operating Profit Progress : 30.0% (Full-year forecast: ¥7,000 million)
- Quarterly Net Profit Progress : 29.7% (Full-year forecast: ¥4,800 million)
- Customer Asset Balance Growth : 34.3% (+¥5.7 billion against a full-year target of +¥15 billion; total balance: ¥139 billion )
With all profit items and customer asset metrics exceeding the 25% benchmark for the first quarter, the company is tracking well against its plans.
2. Challenging Market Conditions and Revenue Generation Mechanism
The foreign exchange market in Q1 presented significant headwinds for FX brokers.
Factors Contributing to Market Deterioration
- Shrinking Daily Ranges (Low Volatility) : The average daily range for USD/JPY (monthly average) declined for three consecutive months—¥1.14 in April, ¥0.81 in May, and ¥0.57 in June—marking a period of extremely limited price movement where every month averaged below ¥1 .
- Sharp Decline in Domestic FX Trading Volume : Total monthly trading volume in the domestic OTC FX market fell to the ¥600 trillion range in June 2026, the lowest level in four years and four months since February 2022.
- Stabilization of High-Interest Currencies : Historical volatility dropped significantly not only for USD/JPY but also for high-demand pairs like MXN/JPY and TRY/JPY.
Factors Behind the Significant Profit Growth
Despite the overall decline in market activity, the company successfully captured revenue opportunities through the following measures:
- Capturing Intervention Phases : Trading volume surged temporarily during the sharp market fluctuations caused by large-scale government/BOJ interventions in late April and early May (when the yen strengthened toward the 155 level).
- Geopolitical Risk and Interest Rate Uncertainty : The company secured income gain opportunities by capitalizing on instability in interest rate markets caused by geopolitical risks, such as the situation in Iran, and shifting monetary policy outlooks.
- Competitive Service Offerings : By maintaining industry-leading spreads and swap points, the company successfully retained existing customers while acquiring new ones.
3. In-Depth Analysis of Customer Metrics as Future Revenue Drivers
Beyond the financial figures, the trends in "Open Positions" and "Customer Assets" are critical leading indicators for future performance.
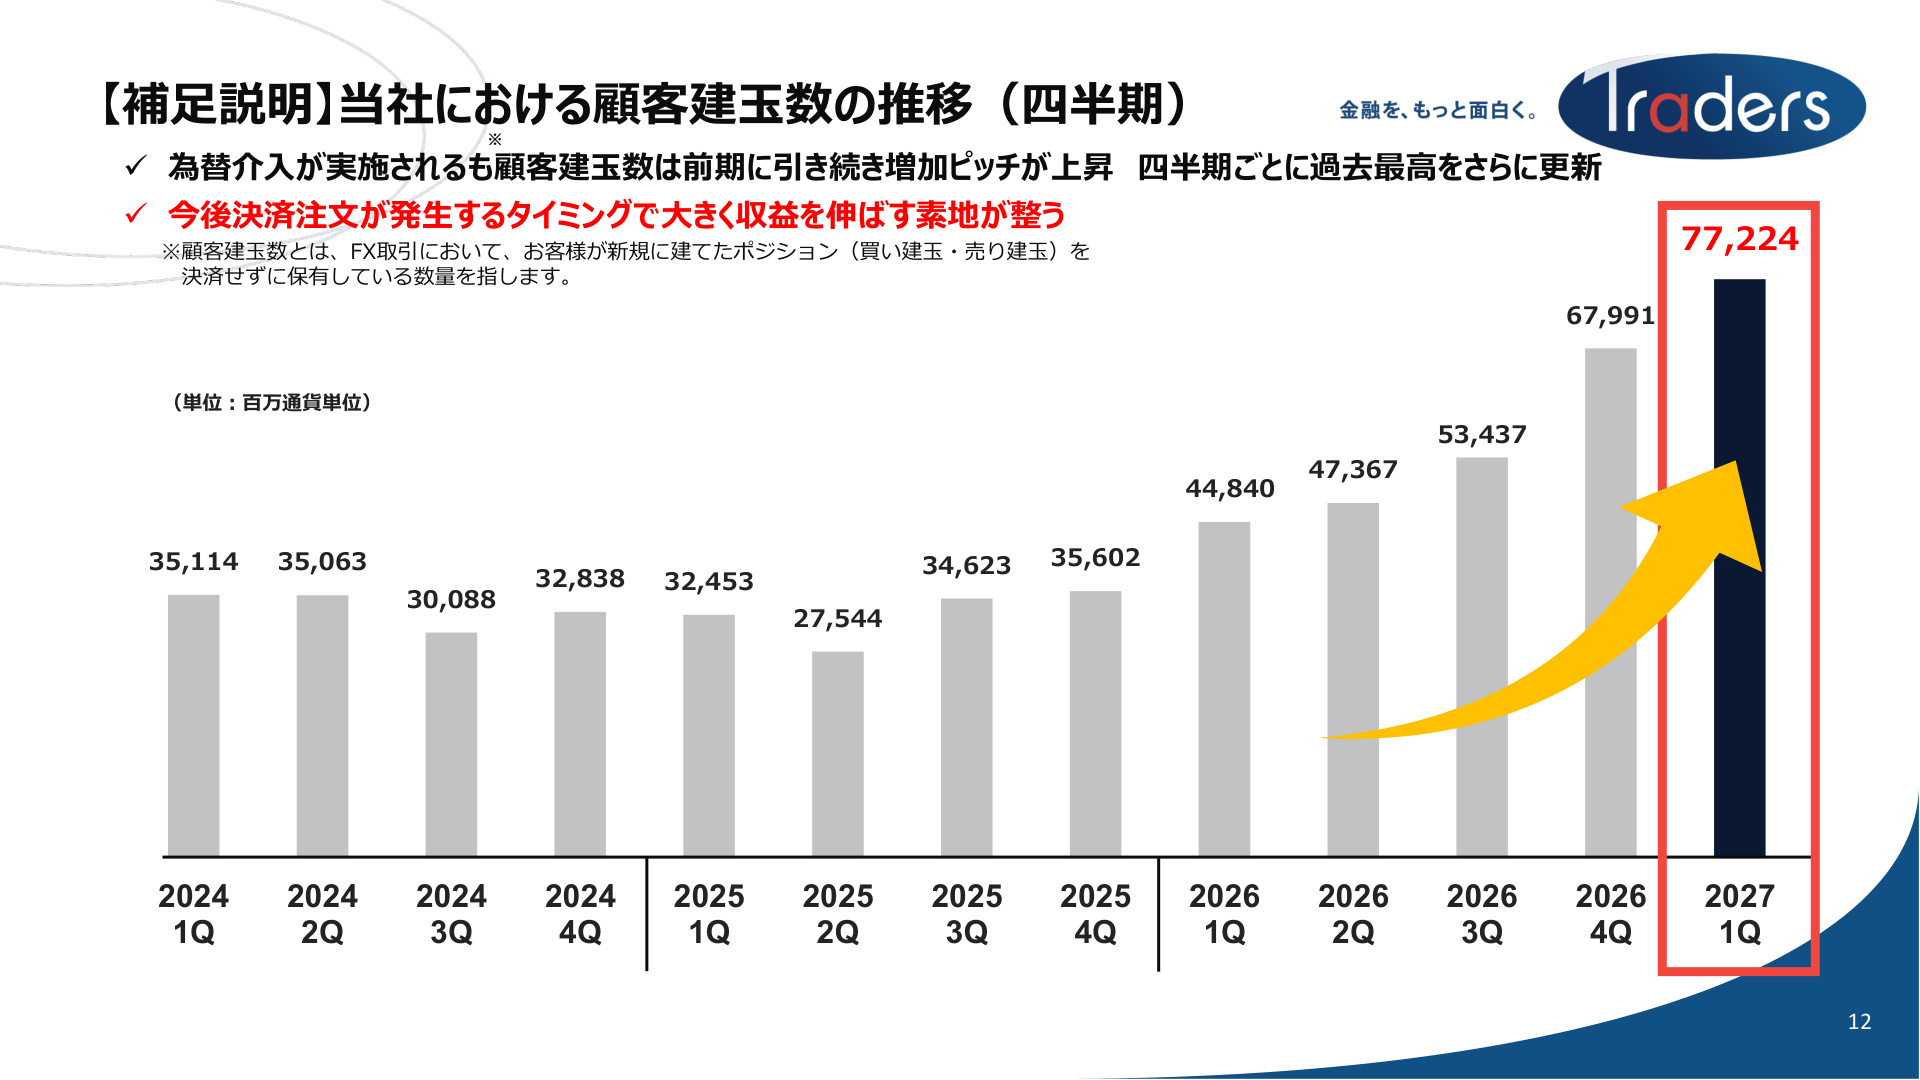
Interpretation of Open Position Data
The slide above (P.12) illustrates the quarterly trend of customer open positions. At the end of Q1, open positions reached 77,224 million currency units , marking a consecutive all-time high for each quarter .
The significance of this data is profound:
- Accumulation of "Magma" for Revenue : In the FX business, trading revenue is generated not only when customers open new positions but also when they close them . The surge in open positions directly implies that the "foundation for significant revenue growth" is in place as these positions are eventually settled.
- Revenue Explosiveness During Market Volatility : When the market moves significantly while customers hold large positions, it triggers a wave of settlement orders, creating massive revenue opportunities for the company.
Expansion of Customer Assets and Effective Margin
- Customer Assets : Increased steadily to ¥139 billion at the end of Q1 (+¥5.7 billion from the previous quarter-end). Despite the impact of withdrawals following the end of a major campaign in the previous quarter, the company maintained a solid growth trend driven by swap-investment-oriented customers.
- Effective Margin : Including unrealized gains, the effective margin expanded rapidly to ¥154.3 billion (of which ¥15.3 billion represents customer unrealized gains). Higher asset valuations provide customers with greater potential investment capacity, supporting long-term trading continuity.
- Industry Share : In terms of net growth in customer assets within the domestic FX industry, the company secured the #2 position based on Q1 disclosures.
4. Cost Structure and Financial Stability
SG&A Expenses
Total SG&A expenses for Q1 were ¥1,859 million (a slight YoY increase, largely flat QoQ). Key components include:
- Trading-related Expenses : ¥518 million (efficiently controlled while maintaining active marketing investment).
- Personnel Expenses : ¥667 million (slight increase due to salary revisions in April).
- Real Estate Expenses : ¥248 million (increase due to the office expansion at Yebisu Garden Place Tower in the second half of the previous fiscal year).
- Taxes and Dues : ¥175 million (increase in non-deductible consumption tax due to higher financial income from BOJ rate hikes).
While continuing aggressive marketing investments to acquire customer assets, overall costs remain strictly controlled, contributing to the high operating profit margin.
Robust Financial Foundation
The Capital Adequacy Ratio stood at 709.5% (as of June 30, 2026), significantly exceeding both the regulatory requirement (120%) and industry standards. By maintaining sufficient capital (consolidated equity of ¥21.4 billion ), the company has built a financial structure capable of withstanding market stress.
5. Progress in Growth Strategy, New Domains, and IP Strategy
Beyond price competition, the company is building quantitative and qualitative competitive advantages through product refinement and intellectual property.
1. "Minna no Option" Renewal (May 2026)
- UI/UX Overhaul : Revamped the trading screen to streamline the flow from market analysis to order execution.
- Expanded Trading Opportunities : Increased target rates, revised session times, and added AUD/JPY .
- Enhanced Information : Added economic calendars and indicator displays to create revenue opportunities even in low-volatility environments.
2. Advanced IP Strategy (Implementation of Patented Technology)
- Continuous Patent Filings : Maintaining a pace of one new patent application per month in FY2027.
- Publication of Applications : Two patents, "Order Execution" and "Swap-related," were published, visualizing the company's technological superiority.
- Product Implementation :
- "New Minna no Repeat" : Features proprietary logic for automatic order redesign.
- "AI Analysis Report" : Expanded functionality using proprietary AI technology (implemented June 25).
6. Shareholder Return Policy and Mid-to-Long-Term Outlook
The company's shareholder return policy is based on clear metrics that balance earnings-linked performance with stability.
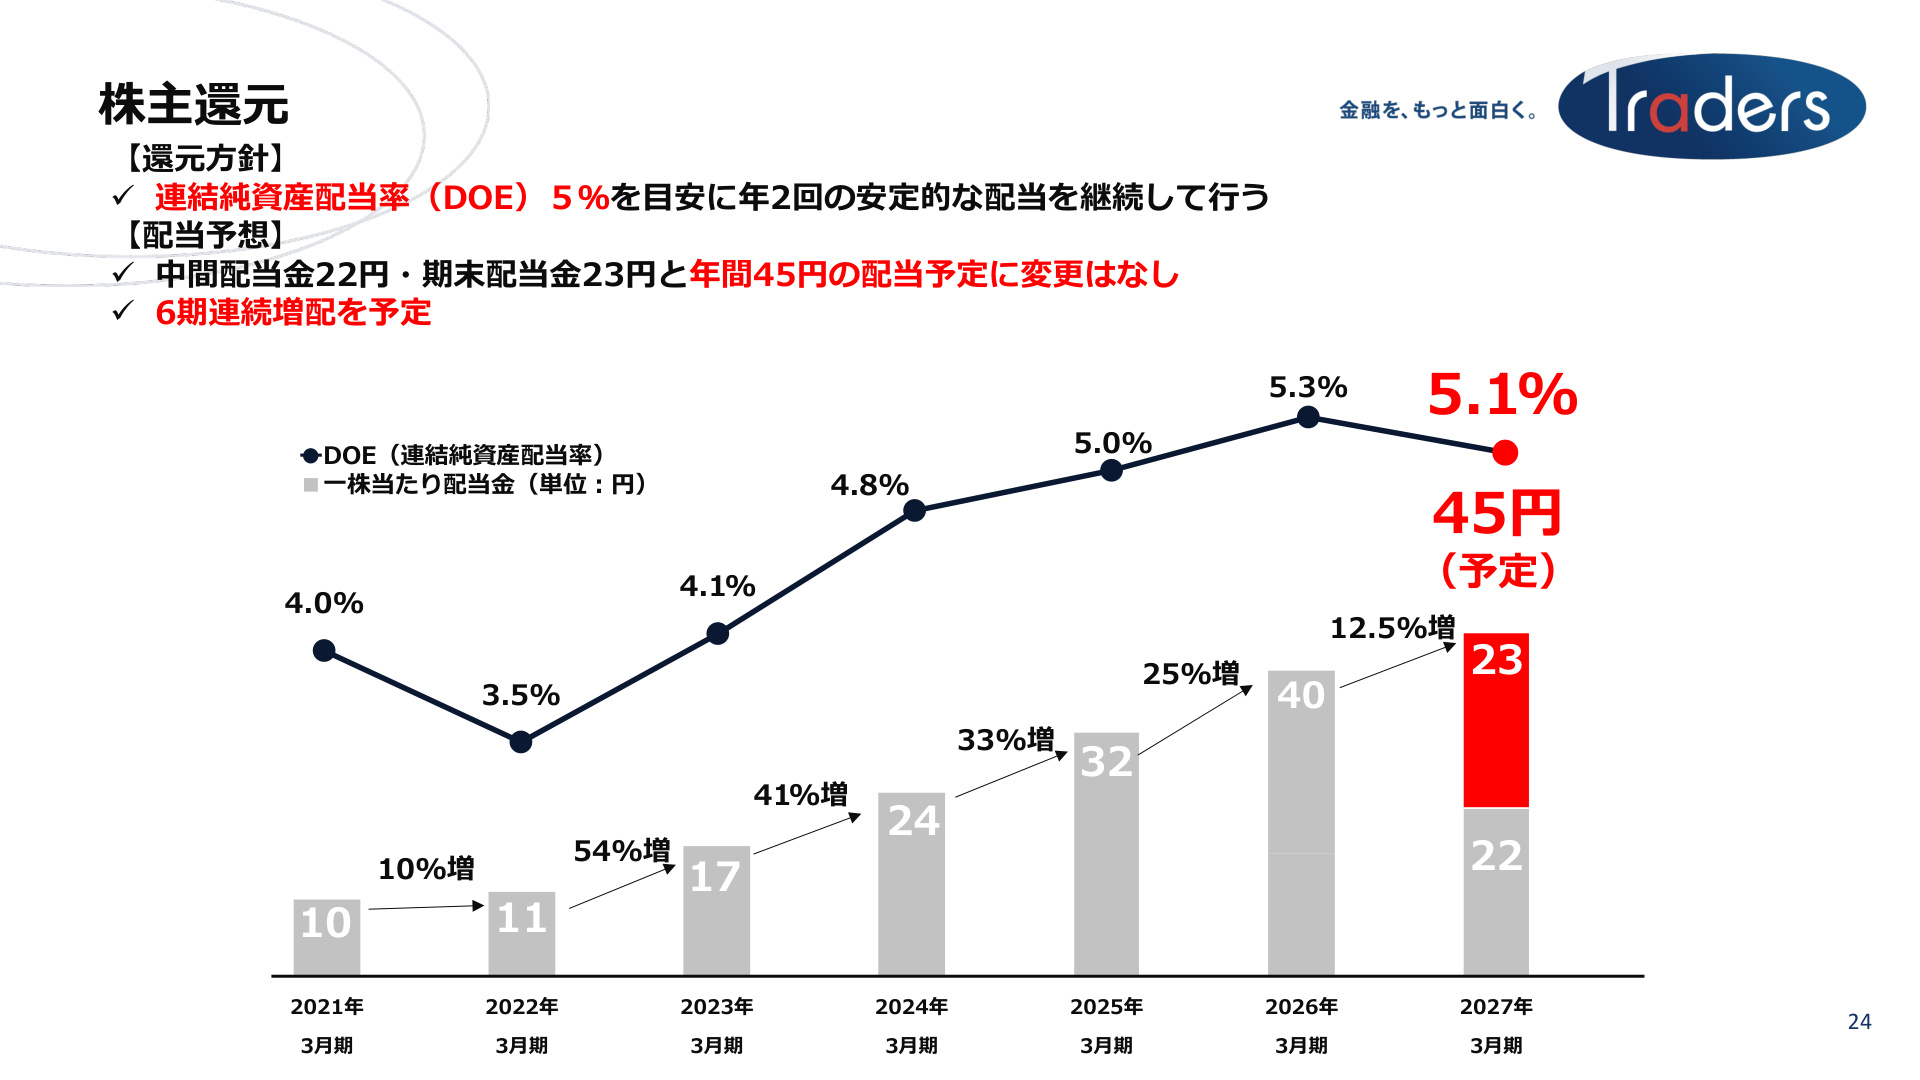
Shareholder Return Policy
The slide above (P.24) shows the company's dividend track record, forecasts, and the trend in the Dividend on Equity (DOE) ratio.
- Basic Policy : Aiming for a consolidated DOE of 5% , with a focus on stable, semi-annual dividends.
- FY2027 Dividend Forecast :
- Interim Dividend : ¥22
- Year-end Dividend : ¥23
- Annual Dividend Forecast : ¥45 per share (projected DOE of 5.1%)
- Consecutive Dividend Increases : Having raised dividends incrementally from ¥10 in FY2021, achieving the projected ¥45 would mark six consecutive years of dividend increases .
By adopting the DOE metric, which increases dividends in line with the growth of net assets while considering financial health and internal reserves for growth, the company provides a highly predictable return stance for shareholders.
7. Conclusion
In Q1 FY2027, Traders Holdings achieved a 50.2% YoY increase in operating profit by capturing market fluctuations related to interventions and geopolitical risks, even as the FX market faced record-low volatility and declining trading volumes.
Notably, customer open positions reached a record high of 77,224 million currency units , and customer assets expanded to ¥139 billion . This accumulation of customer base and open positions holds significant potential for revenue leverage when market activity recovers.
With a 30.0% progress rate against the full-year operating profit target of ¥7 billion, combined with product differentiation, IP strategy, and a policy of six consecutive years of dividend increases based on a 5% DOE , the company's future business development and earnings trajectory remain highly anticipated.
This content is not intended as investment advice or a recommendation. Any opinions expressed are solely the personal views of each article.