


HOYA Q1 FY2027 Earnings Deep Dive: A Comprehensive Analysis of Significant Revenue and Profit Growth

StockClub
Published: Jul 31, 2026, 10:33 AM
Sentiment Analysis
HOYA Q1 FY2027 Earnings Deep Dive Report
Based on the consolidated financial results supplementary materials for the first quarter of the fiscal year ending March 31, 2027 (April 1, 2026 – June 30, 2026), this report provides a comprehensive analysis of HOYA Corporation’s performance, key drivers, segment-specific trends, financial position, and future outlook.
1. Earnings Highlights: Achieving Significant Revenue and Profit Growth
In the first quarter, HOYA demonstrated robust growth, with both revenue and operating profit significantly exceeding the same period last year.
- Revenue : ¥255,742 million ( +16.0% YoY)
- Profit from Ordinary Operating Activities : ¥82,367 million ( +24.4% YoY)
- Operating Profit : ¥82,626 million ( +30.0% YoY)
- Profit Before Tax : ¥85,994 million ( +27.7% YoY)
- Quarterly Profit Attributable to Owners of the Parent : ¥65,791 million ( +26.9% YoY)
- Earnings Per Share (EPS) : ¥196.61 (compared to ¥151.24 in the same period last year)
Profitability improved significantly alongside revenue expansion, with the operating profit margin rising 3.5 percentage points from 28.8% to 32.3% compared to the same period last year. This performance was driven by the recovery and expansion of demand in both core business segments, as well as the tailwind provided by the depreciation of the yen.
The slide below summarizes the key financial indicators and the impact of foreign exchange rates for the first quarter.
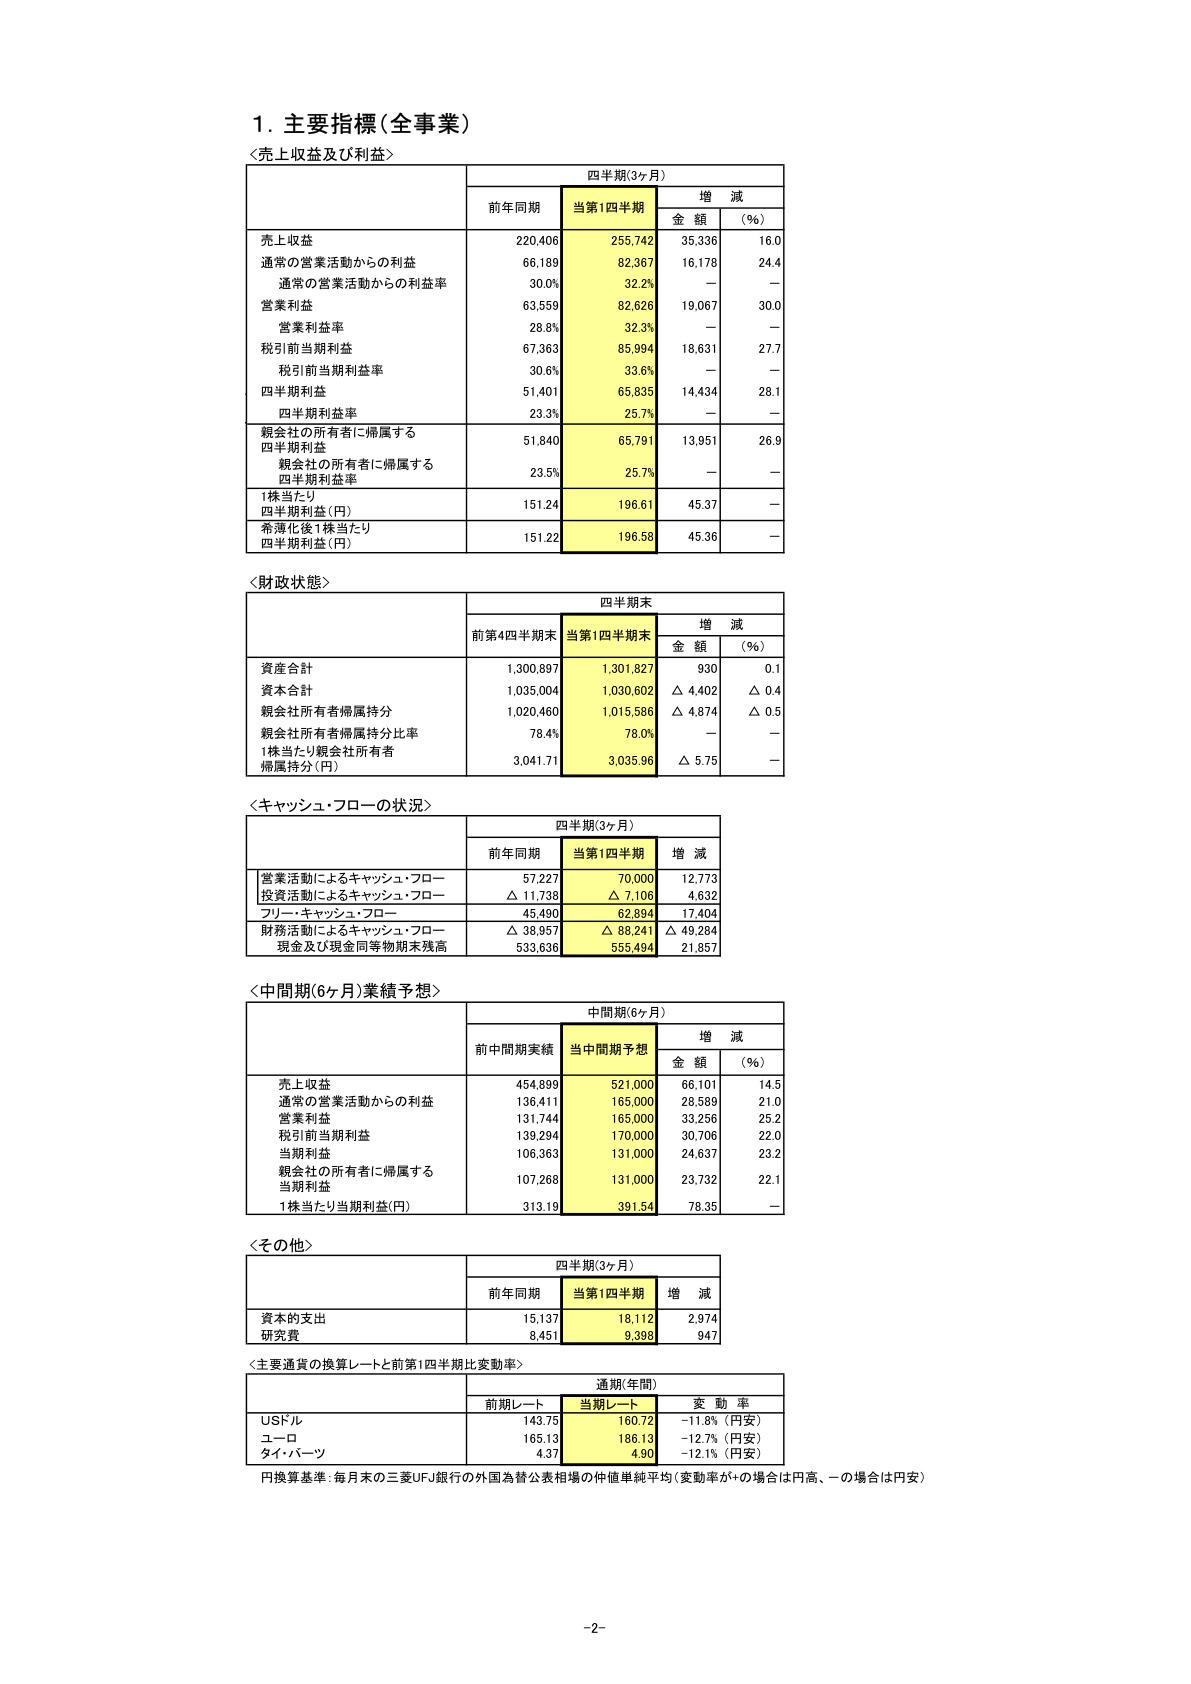
[Slide Commentary: Importance of Key Indicators (Total Business)]
This slide is the most critical document for grasping the overall framework of the financial results. Looking at the P&L items, operating profit (+30.0%) is growing at a faster pace than revenue (+16.0%), demonstrating a high-profitability structure characterized by operating margin improvement (reaching 32.3%) driven by revenue growth . Regarding exchange rates, the US Dollar averaged ¥160.72 (an 11.8% depreciation of the yen YoY) and the Euro averaged ¥186.13 (a 12.7% depreciation YoY) , confirming the significant positive impact of the weaker yen on the company's global operations. Furthermore, Free Cash Flow showed remarkable growth at ¥62,894 million (+38.3% YoY), proving the company's strong ability to generate cash from its operations.
2. In-depth Segment Analysis
HOYA’s reporting segments consist primarily of " Life Care " and " Information Technology ." Both segments recorded double-digit growth in revenue and profit this quarter.
(1) Life Care Segment: Solid Performance in Both Healthcare and Medical
- Revenue : ¥154,788 million (+12.8% YoY, +3.4% on a constant currency basis)
- Segment Profit : ¥29,984 million (+23.6% YoY)
- Segment Profit Margin : 19.4% (+1.7pt improvement from 17.7% in the same period last year)
Breakdown: Healthcare-related products (eyeglass lenses, contact lenses) revenue was ¥119,986 million (+12.8%) , and Medical-related products (endoscopes, medical instruments, intraocular lenses, etc.) revenue was ¥34,802 million (+12.7%) . Both fields maintained positive growth even on a constant currency basis, excluding the impact of exchange rates.
(2) Information Technology Segment: High Demand and Sustained High Profitability
- Revenue : ¥100,954 million (+22.7% YoY, +14.8% on a constant currency basis)
- Segment Profit : ¥55,615 million (+27.8% YoY)
- Segment Profit Margin : 55.1% (+2.2pt improvement from 52.9% in the same period last year)
In the IT segment, electronics-related products such as mask blanks for semiconductors and photomasks for FPDs were the primary drivers, with revenue of ¥84,379 million (+22.9% YoY, +15.5% constant currency) . Additionally, optical solutions such as optical lenses showed a recovery trend with ¥16,574 million (+22.3% YoY, +11.4% constant currency) . The segment profit margin reached an exceptionally high level of 55.1% , validating the company's high-value-added strategy.
Details of performance and the breakdown of changes can be found in the slide below.
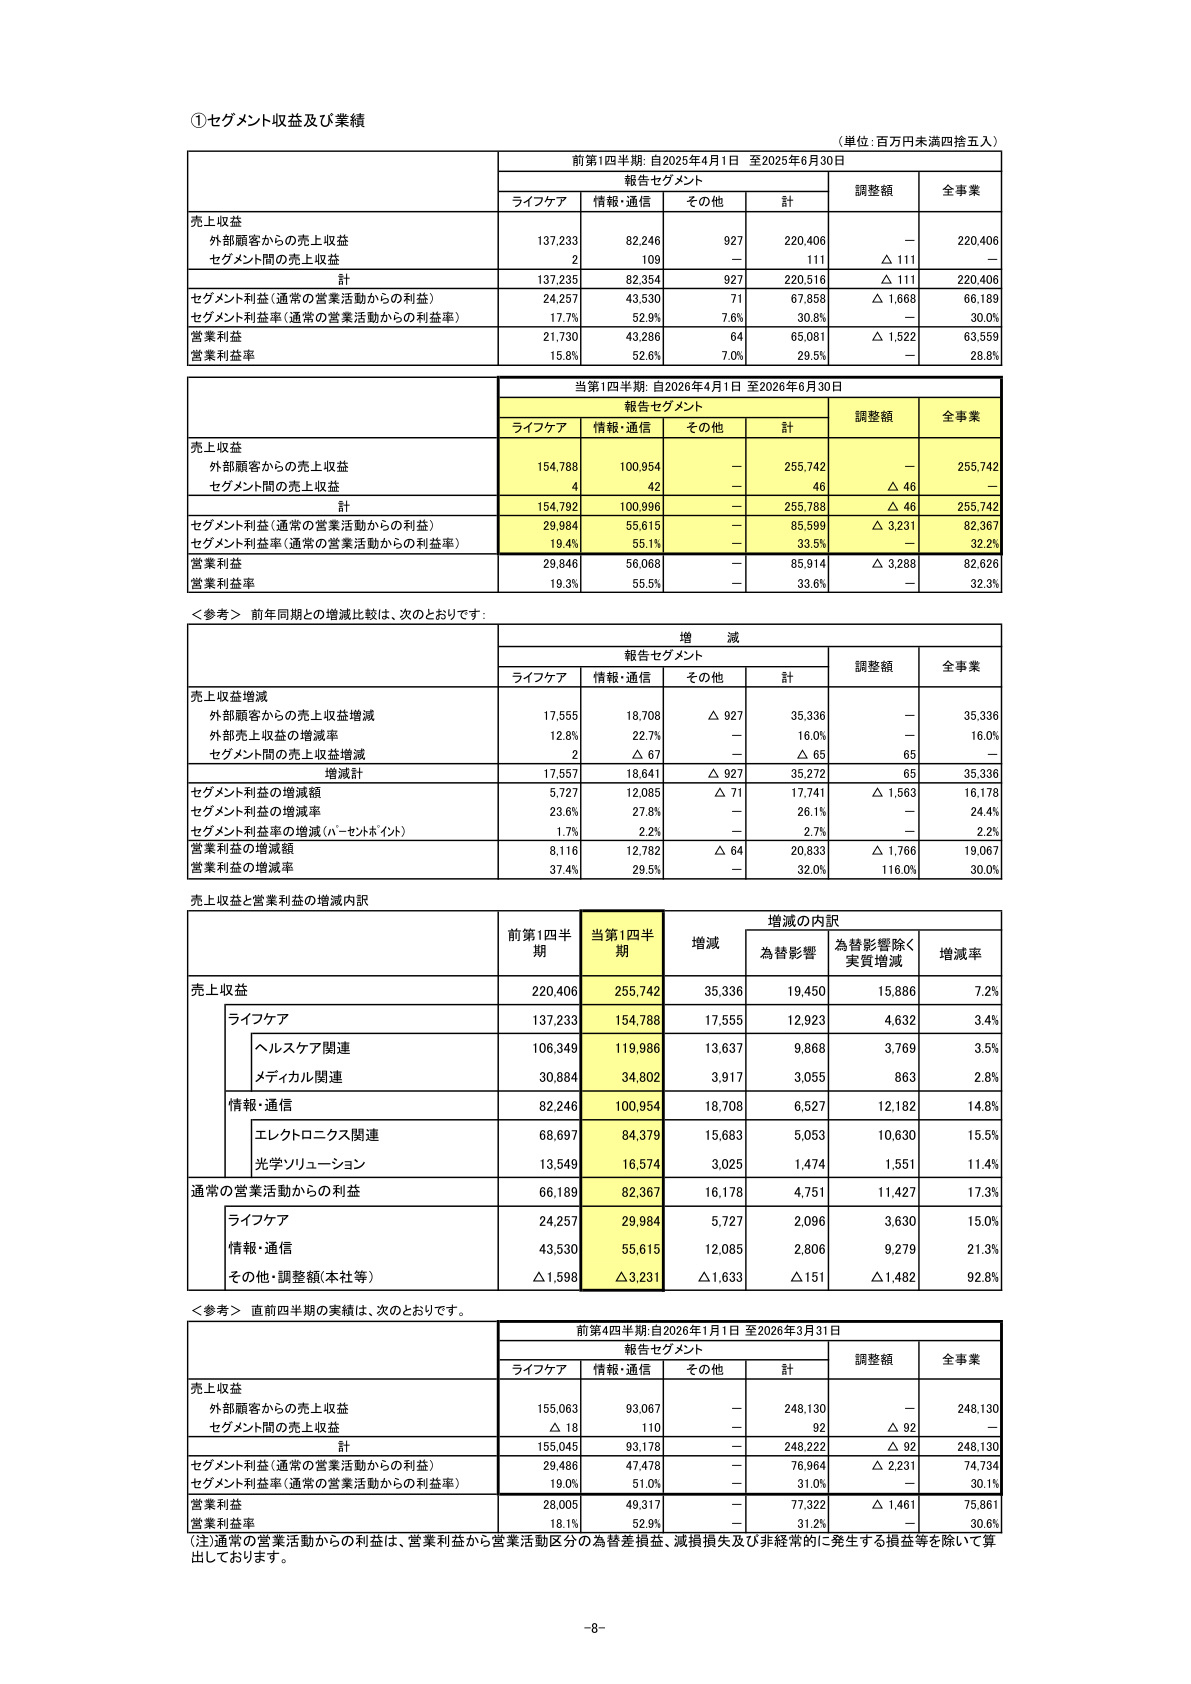
[Slide Commentary: Importance of Segment Revenue and Performance]
This slide provides essential data for assessing the "quality" of growth in each segment. Of particular note is the " Breakdown of FX impact and organic growth ." Out of the total revenue increase of ¥35,336 million, while the FX effect accounted for ¥19,450 million, there was an organic increase (volume/price factors) of ¥15,886 million (+7.2%) . In the IT segment specifically, the organic growth rate reached +14.8% , clearly indicating that growth is driven by actual demand recovery in the semiconductor market and other sectors, rather than relying solely on the weak yen.
3. Regional Revenue Trends and FX Impact
Revenue from external customers by region shows balanced growth across the globe.
- Japan : ¥49,547 million (+5.4% YoY, 19.4% of total)
- Americas : ¥45,102 million (+16.3% YoY, 17.6% of total)
- Europe : ¥52,462 million (+15.5% YoY, 20.5% of total)
- Asia/Oceania : ¥104,076 million (+20.7% YoY, 40.7% of total)
- Other : ¥4,554 million (+53.1% YoY, 1.8% of total)
Notably, the Asia/Oceania region accounts for over 40% of total revenue and showed the highest growth at +20.7% YoY, reflecting strong demand in regions where semiconductor manufacturing bases and electronic component demand are concentrated.
4. Financial Position and Cash Flow
(1) Financial Structure (B/S Analysis)
- Total Assets : ¥1,301,827 million (+¥930 million from previous year-end)
- Cash and Cash Equivalents : ¥555,494 million (-¥18,598 million from previous year-end)
- Equity Attributable to Owners of the Parent : ¥1,015,586 million (-¥4,874 million from previous year-end)
- Equity Ratio : 78.0% (remained largely flat from 78.4% at the previous year-end)
HOYA maintains an extremely sound financial position with a high equity ratio of 78.0% . Current assets account for 73.1% (¥951,239 million) of total assets, ensuring high liquidity.
(2) Cash Flow and Shareholder Returns (C/F Analysis)
- Operating CF : ¥70,000 million (+¥12,773 million YoY)
- Investing CF : -¥7,106 million (an improvement of ¥4,632 million YoY)
- Free Cash Flow : ¥62,894 million (+¥17,404 million YoY)
- Financing CF : -¥88,241 million (primarily due to dividend payments of -¥56,912 million and share buybacks of -¥28,052 million)
Driven by the increase in operating profit, operating cash flow increased significantly. Utilizing the abundant free cash flow, the company implemented proactive shareholder returns, including dividend payments and share buybacks , resulting in a cash outflow of ¥88,241 million in financing activities.
(3) R&D and Capital Expenditure Trends
- Capital Expenditure : ¥18,112 million (+19.7% YoY)
- R&D Expenses : ¥9,398 million (+11.2% YoY)
The company continues to invest aggressively in capital expenditure and R&D to maintain its competitive edge in advanced technology fields.
5. Future Outlook: Interim Forecast for the Fiscal Year Ending September 2026
The company has disclosed its consolidated earnings forecast for the six-month period ending September 2026.
- Interim Revenue : ¥521,000 million (+14.5% YoY)
- Interim Profit from Ordinary Operating Activities : ¥165,000 million (+21.0% YoY)
- Interim Operating Profit : ¥165,000 million (+25.2% YoY)
- Interim Profit Before Tax : ¥170,000 million (+22.0% YoY)
- Interim Profit Attributable to Owners of the Parent : ¥131,000 million (+22.1% YoY)
- Interim EPS : ¥391.54
The slide below shows the interim forecast and the trend for the second quarter (3 months) alone.
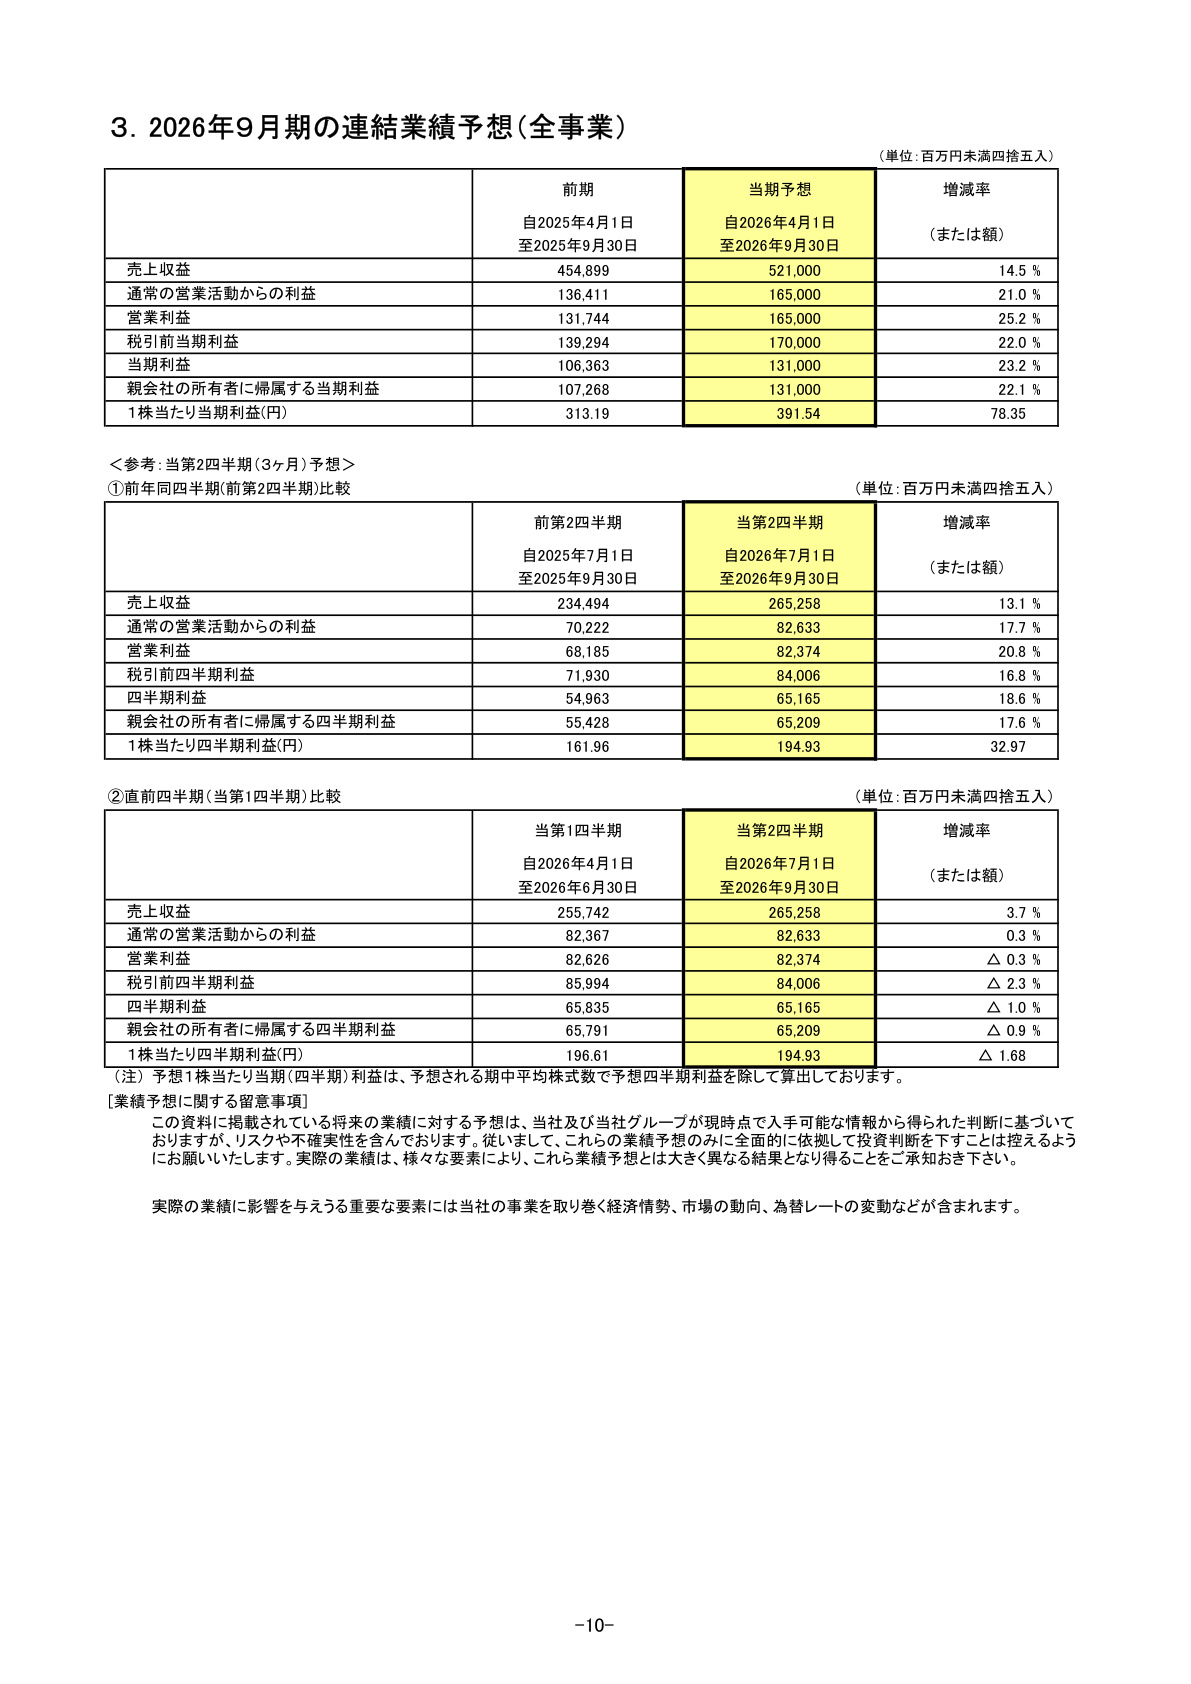
[Slide Commentary: Importance of Consolidated Earnings Forecast (Total Business)]
This slide is crucial for gauging the sustainability of the company's growth. With an interim forecast of ¥521 billion in revenue (+14.5%) and ¥165 billion in operating profit (+25.2%) , the company anticipates high-level growth. Comparing the Q1 results (¥255.7 billion revenue, ¥82.6 billion operating profit) with the Q2 standalone forecast (¥265.2 billion revenue, ¥82.3 billion operating profit), it is clear that the company expects to maintain high performance in Q2, comparable to or exceeding Q1 . The plan reflects expectations for favorable demand conditions to continue into the second half of the year.
6. Summary and Future Topics
In the first quarter of the fiscal year ending March 2027, HOYA achieved excellent results driven by the strength of advanced products in the IT segment , stable growth in the Life Care segment , and the synergistic effect of the weak yen .
Key points to monitor moving forward include:
- Momentum in the IT segment : Sustainability of semiconductor demand and demand for advanced mask blanks.
- Profitability improvement in the Life Care segment : Global price revisions and product mix improvements in healthcare and medical fields.
- Exchange rate fluctuations : Sensitivity to FX rates and the degree of impact on full-year performance.
- Capital efficiency and shareholder returns : Trends in share buybacks and dividends supported by strong free cash flow.
With high technical barriers to entry and a sound financial foundation, HOYA’s continued pursuit of sustainable growth remains a key focus for investors.
This content is not intended as investment advice or a recommendation. Any opinions expressed are solely the personal views of each article.