


Japan Investment Adviser (7172) H1 FY2026 Earnings Deep Dive Report

StockClub
Published: Jul 31, 2026, 10:32 AM
Sentiment Analysis
1. Executive Summary and Performance Highlights
Japan Investment Adviser Co., Ltd. (JIA) delivered a robust performance for the first half (January–June) of the fiscal year ending December 2026 , with the core Operating Lease business driving strong results. The company achieved record-high profits for a second quarter across all profit stages.
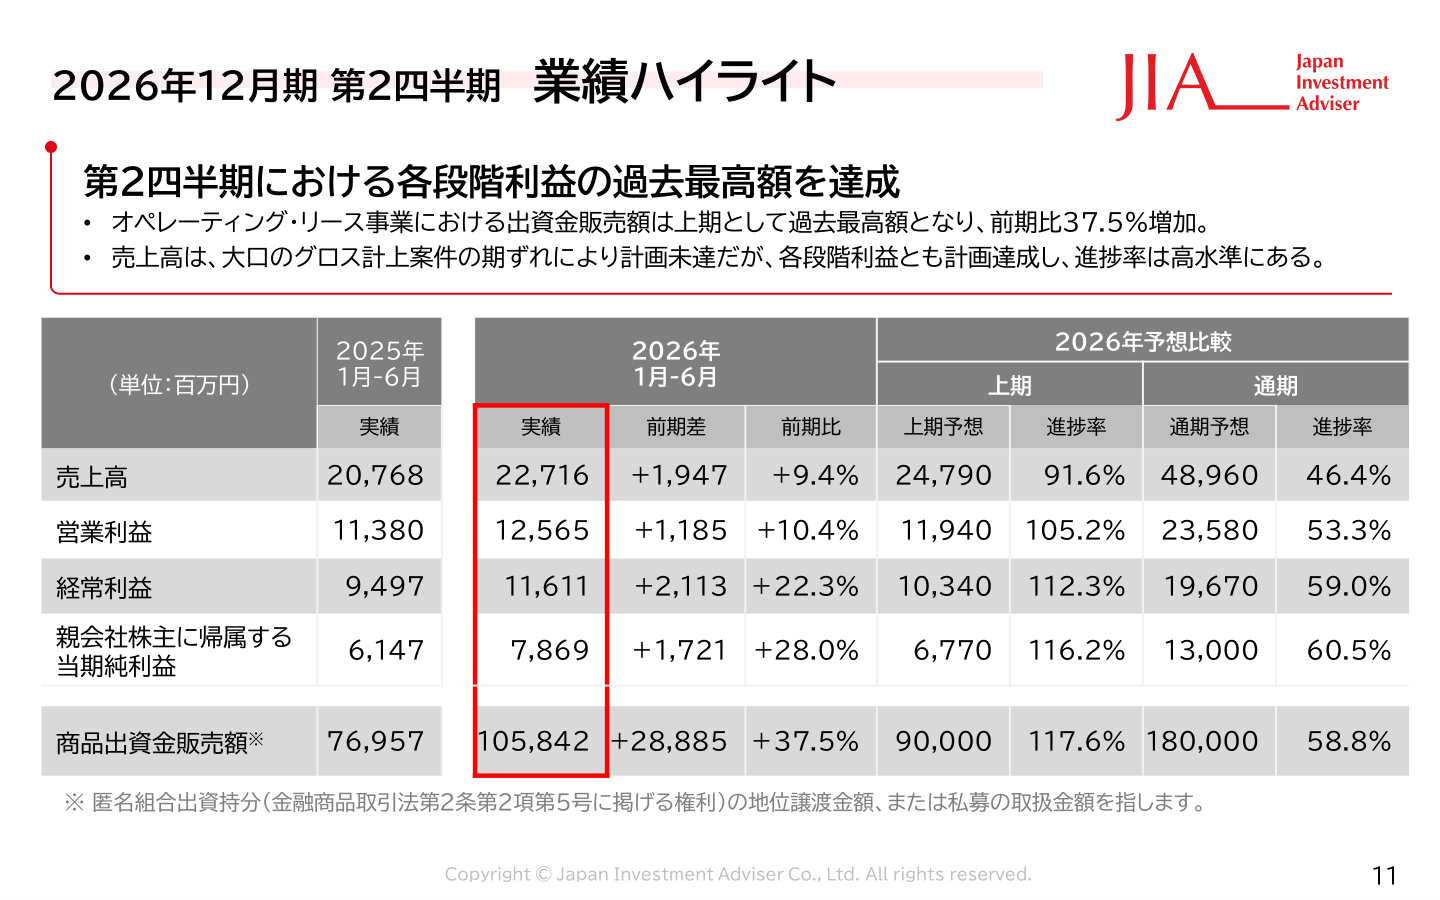
Net sales reached 22,716 million yen (+9.4% YoY) , operating profit was 12,565 million yen (+10.4% YoY) , ordinary profit stood at 11,611 million yen (+22.3% YoY) , and net profit attributable to owners of the parent hit 7,869 million yen (+28.0% YoY) . Furthermore, the sales volume of product investments , a key indicator of the business, grew significantly to 105,842 million yen (+37.5% YoY) , surpassing the 100 billion yen milestone for the first time in a first-half period.
While net sales fell slightly short of the H1 target (24,790 million yen) at 91.6% progress due to the deferral of certain large-scale gross-recorded transactions to the second half, the gross profit margin improved from 77.1% in the same period last year to 81.3% , driven by high-margin deals. Consequently, all profit stages—operating, ordinary, and net profit—significantly exceeded the H1 forecasts.
Significance and Data Context of This Slide
The "Performance Highlights" slide above clearly illustrates the strength of JIA's earnings power and the high progress rate of its profits. As of the end of the first half, the progress rate against the full-year operating profit forecast is 53.3% , ordinary profit is 59.0% , net profit is 60.5% , and product investment sales volume is 58.8% , indicating a high probability of achieving the full-year targets. The structure where profit stages exceed plans despite the deferral of sales is evidence of successful high-profit deal structuring and sales.
2. Profit Structure and Segment Analysis
P/L Factor Analysis
Breaking down the consolidated statement of income, cost of sales was contained at 4,237 million yen (a 10.8% decrease YoY), leading to a notable increase in gross profit to 18,478 million yen (+15.4% YoY) . Meanwhile, SG&A expenses increased to 5,913 million yen (+27.5% YoY) . The primary components of this 1,276 million yen increase are as follows:
- Personnel expenses : +546 million yen (strengthening structure through increased headcount and salary hikes)
- Rent expenses : +109 million yen (costs associated with head office relocation, etc.)
- Taxes and dues : +128 million yen (tax burden associated with business scale expansion)
Regarding non-operating income/expenses, the 1,023 million yen foreign exchange loss recorded in the same period last year turned into a 172 million yen foreign exchange gain . Despite a 486 million yen equity-method investment loss, the overall balance of non-operating income and expenses improved, supporting a significant increase in ordinary profit of over 20%.
Segment Sales Trends and Challenges
A look at the sales composition by business segment highlights the company's structural characteristics and challenges:
- Operating Lease Business : Sales of 20,903 million yen (+10.3% YoY, 92.0% of total)
- Real Estate Business : Sales of 256 million yen (+61.2% YoY, 1.1% of total)
- Environment and Energy Business : Sales of 73 million yen (-32.1% YoY, 0.3% of total)
- PE (Private Equity) Investment Business : Sales of 161 million yen (-56.8% YoY, 0.7% of total)
- Other Businesses : Sales of 1,321 million yen (+12.5% YoY, 5.8% of total)
While the Operating Lease business remains the overwhelming pillar accounting for over 90% of total sales, "increasing the sales composition ratio of non-operating lease businesses" remains a medium-term challenge. The Real Estate business requires asset diversification and differentiation; the Environment and Energy business needs to create new opportunities through PPA and battery site development; and the PE Investment business must recover from delays in fund scale expansion and exits.
3. Deal Structuring, Sales, and Customer Base Expansion
Deal Structuring and Sales Performance
In the January–June 2026 period, the value of structured deals reached 234,281 million yen (25 deals) , a steady increase from 217,642 million yen (21 deals) in the same period last year. By asset type, aircraft accounted for the majority at 173,276 million yen (21 deals) , while ships totaled 61,005 million yen (4 deals) .
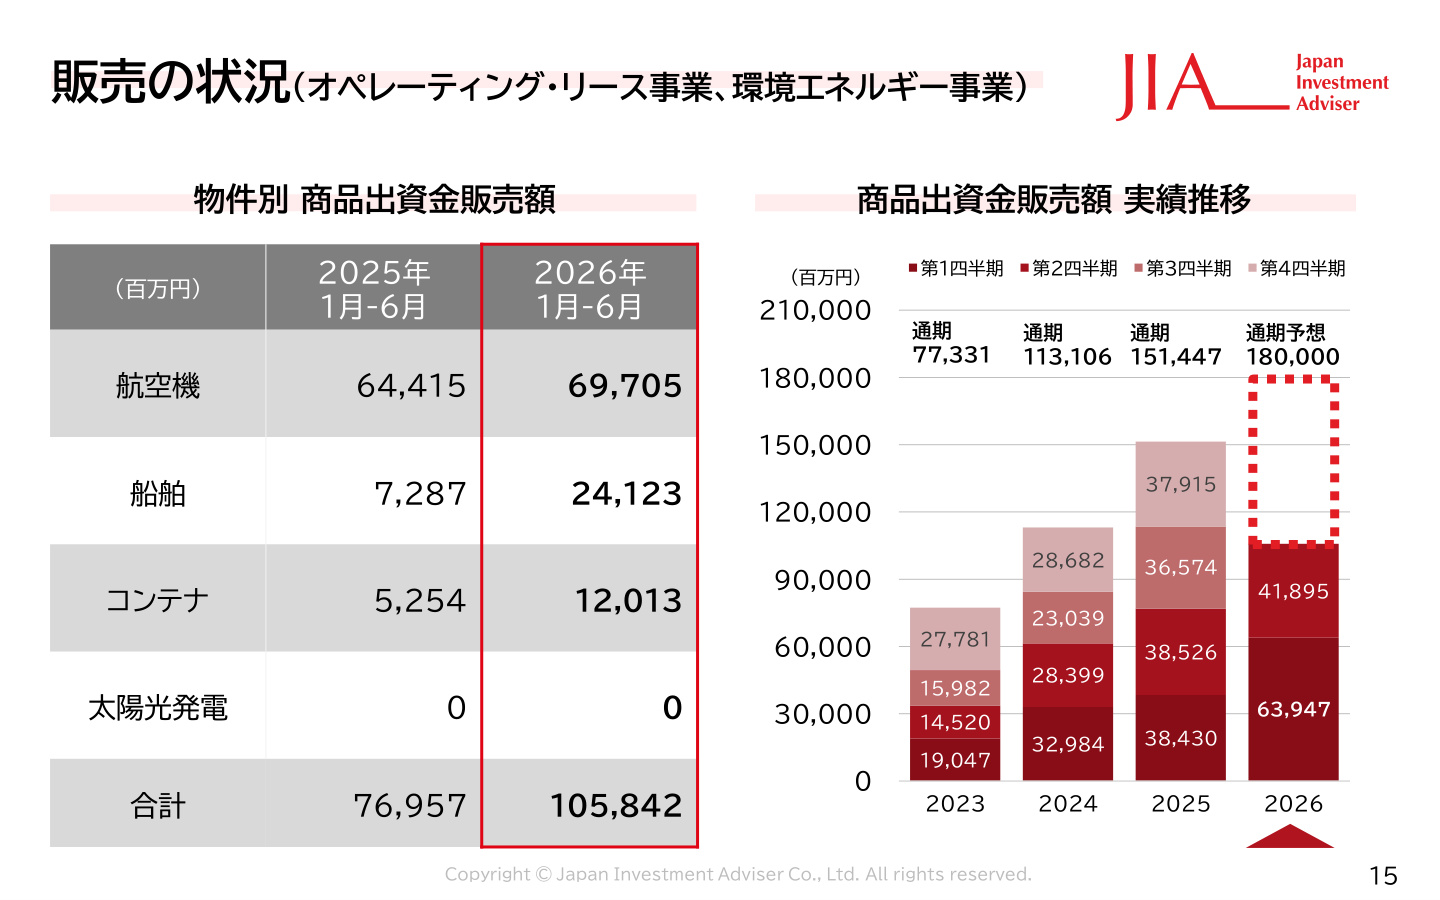
The trend in product investment sales to investors is shown in the slide below.
Significance and Data Context of This Slide
The "Sales Status" slide above demonstrates that JIA's core Operating Lease products are being sold extremely smoothly to corporate investors nationwide. Of the 105,842 million yen in product investment sales, 69,705 million yen came from aircraft deals , 24,123 million yen from ship deals , and 12,013 million yen from container deals , showing that sales of non-aircraft assets are also steadily accumulating. The quarterly bar chart shows that sales are progressing at a very high pace compared to previous years, indicating that the company is successfully capturing investors' needs for tax planning and surplus fund management.
Trends in Sales Network (Business Matching Partners)
This strong sales capability is supported by a wide network of tax accounting firms and financial institutions.
- Total Business Partner Agreements : 950 (as of the end of June 2026)
- Tax/Accounting Firms, etc. : 830 (an increase of 15 in Q2 2026)
- Financial Institutions (Banks, Credit Unions, Securities) : 120
In particular, collaboration with tax accounting firms that have contact with small and medium-sized enterprise owners facing business succession and inheritance issues is accelerating, serving as a unique strength in the company's customer acquisition.
4. Financial Position and Balance Sheet Analysis
In the consolidated balance sheet as of the end of June 2026, total assets were 268,541 million yen , a decrease of 25,090 million yen compared to the end of December 2025 (293,632 million yen). This was primarily due to the decrease and cash recovery of product investments held temporarily, which stood at 93,882 million yen at the end of the period (down from 136,482 million yen at the end of December 2025) following strong sales.
On the liabilities side, short-term borrowings , which were used for purchasing investments, decreased to 144,658 million yen (a decrease of 21,963 million yen from the end of December 2025). As a result, the equity ratio improved by 5.7 percentage points, from 25.0% at the end of December 2025 to 30.7% , significantly enhancing financial soundness. With the improvement in the turnover rate of investments (cash conversion cycle), the company is successfully balancing the reduction of interest-bearing debt with improved capital efficiency.
5. Progress of Medium-Term Management Plan and Full-Year Outlook
Full-Year Earnings Forecast
Regarding the full-year earnings forecast for the fiscal year ending December 2026, the company has maintained its initial forecast .
- Net Sales : 48,960 million yen (+26.4% YoY)
- Operating Profit : 23,580 million yen (+24.8% YoY)
- Ordinary Profit : 19,670 million yen (+18.3% YoY)
- Net Profit : 13,000 million yen (+23.3% YoY)
- Product Investment Sales : 180,000 million yen (+18.9% YoY)
Although the profit progress rate at the end of the first half exceeds 50–60% at each stage, the company remains cautious, considering the impact of international uncertainties, such as tensions in the Middle East , on the aviation/shipping industries and investor sentiment.
Progress and Revision of the 3-Year Medium-Term Plan (2024–2026)
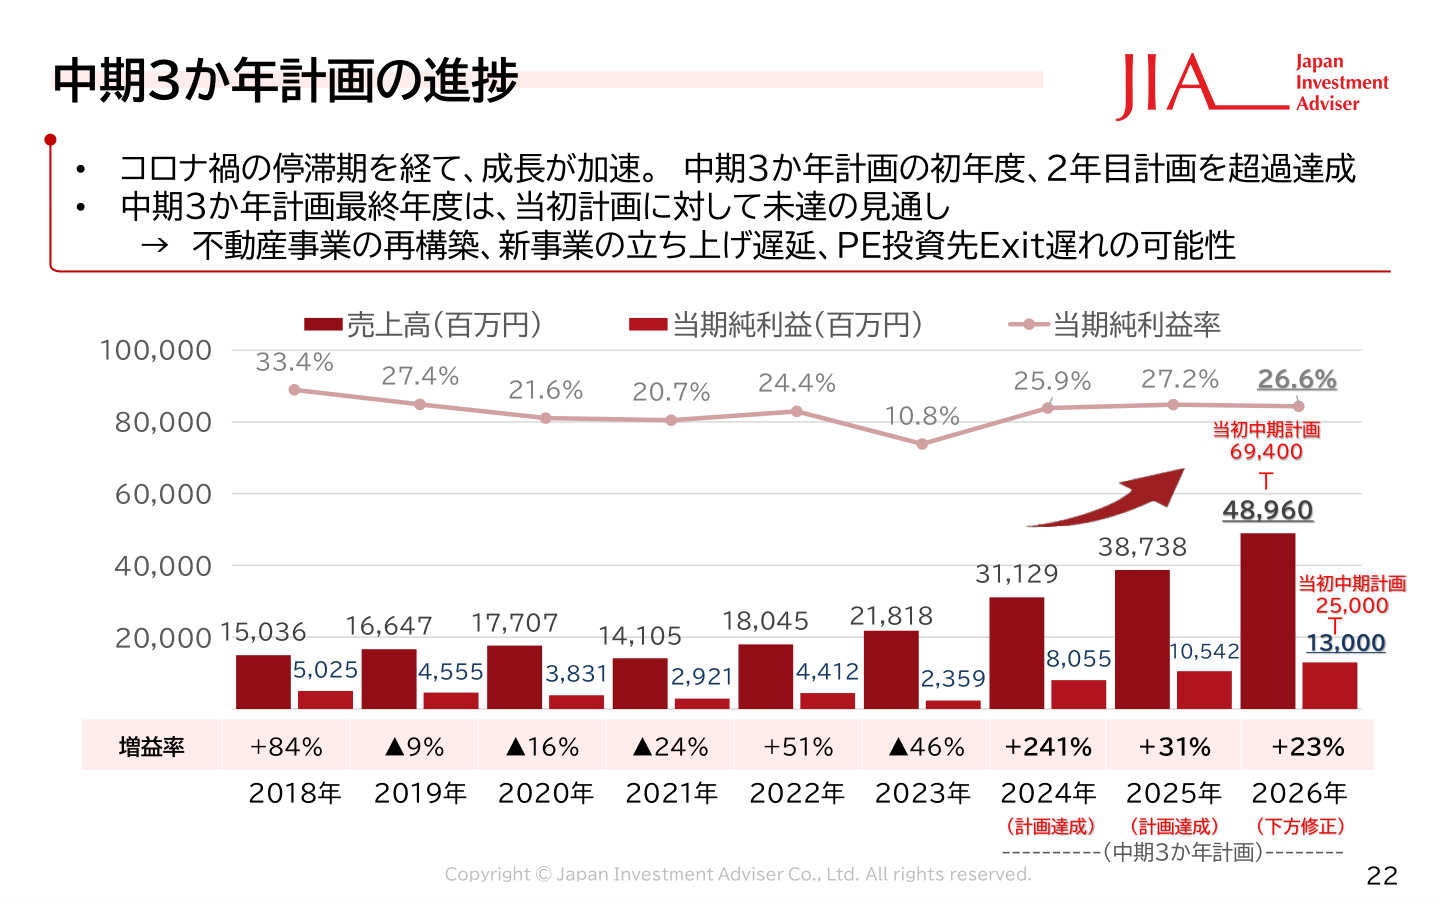
The slide showing the progress of the company's 3-year medium-term plan and the background of the full-year forecast is as follows.
Significance and Data Context of This Slide
This "Progress of the 3-Year Medium-Term Plan" slide is the most important for understanding JIA's long-term growth trajectory and the challenges it faces. After a sharp recovery from the COVID-19 downturn, the first year (2024) and second year (2025) of the medium-term plan exceeded targets , with the company continuously hitting record-high profits. However, for the final year, 2026, the company is projected to fall short of the initial medium-term plan figures (Net Sales: 69,400 million yen, Net Profit: 25,000 million yen) with current forecasts of 48,960 million yen and 13,000 million yen, respectively. This is due to "delays in restructuring the real estate business," "delays in launching new businesses," and "delays in the timing of PE investment exits." While the core business is recovering well, the reality is that the growth speed of non-lease businesses requires adjustment.
6. Future Growth Strategy and Shareholder Return Policy
Three Key Pillars of Growth Strategy
For 2026, the company has set the following three priorities:
- Diversification of the Operating Lease Business :
- Aiming to move away from sole reliance on aircraft, the company targets maintaining/promoting non-aircraft sales (ships, containers, etc.) at around 30% (H1 2026 result was 34.1%).
- Creating new products such as Engine JOL and Helicopter JOL, and expanding trading (sales profit) of company-owned aircraft.
- Restructuring the Real Estate Business :
- Reviewing the procurement and commercialization structure for fractional real estate products and value-up businesses.
- Expansion of Business Portfolio :
- Creating synergies in peripheral financial services such as M&A advisory, crowdfunding, and investment management.
Shareholder Return Policy
As a shareholder return measure emphasizing capital efficiency, the company has set a target dividend payout ratio of 50% or more . The projected dividend payout ratio for this fiscal year is 50.3% , demonstrating the company's commitment to increasing dividends in line with earnings growth. With the improvement of the financial structure that had deteriorated during the pandemic and the smooth recovery of investments, the foundation for maintaining a high level of returns is being established.
7. Conclusion (Comprehensive Analysis)
Japan Investment Adviser's H1 FY2026 earnings were exceptionally strong, supported by robust demand and structuring capabilities in the core Operating Lease business , leading to record-high profits. Product investment sales exceeded 100 billion yen, and the expansion of the customer base, centered on tax accountants and financial institutions nationwide, is a major strength.
On the other hand, the company has been forced to downwardly revise its final targets for the medium-term management plan due to delays in the launch of non-lease areas such as real estate and PE investment. Moving forward, the speed at which the company can execute its departure from aircraft dependency and the diversification of its business portfolio will be the key to enhancing corporate value over the medium to long term.
This content is not intended as investment advice or a recommendation. Any opinions expressed are solely the personal views of each article.