


Murata Manufacturing Q1 FY2026 Earnings Deep Dive: Record-Breaking Results and Upward Revisions Driven by Surging AI/Data Center Demand and High Capacity Utilization

StockClub
Published: Jul 31, 2026, 10:31 AM
Sentiment Analysis

Murata Manufacturing’s financial results for the first quarter of fiscal year 2026 (April–June 2026) were exceptionally strong, reflecting a robust recovery in the electronic components industry and the rapid expansion of the AI and data center markets. The company not only achieved record-high quarterly revenue but also significantly raised its full-year earnings guidance.
This report provides a detailed analysis of the company's overall performance, growth mechanisms, segment-specific trends, and the future business outlook, based on 10 key topics extracted from the earnings materials.
1. Q1 Earnings Highlights: Record Quarterly Revenue and Significant Profit Growth
In the first quarter, Murata reported consolidated revenue of 502.3 billion yen (+20.7% YoY) and operating profit of 98.5 billion yen (+59.8% YoY) , marking a substantial increase in both top and bottom lines. Even on a real basis, excluding the tailwind from the weaker yen, revenue grew by 12.6% and operating profit by 32.6%, confirming a strong underlying demand for the company's core business.
Furthermore, profit before income taxes reached 109.2 billion yen (+75.3% YoY) , and net profit attributable to owners of the parent company hit 81.4 billion yen (+63.7% YoY) , underscoring the company's high profitability.
2. Explosive Growth in Orders and a Surge in the Book-to-Bill Ratio to 1.34
One of the most notable aspects of these results is the rapid acceleration in order intake. The company recorded record-high quarterly orders of 673.9 billion yen , pushing the Book-to-Bill (BB) ratio to 1.34 .
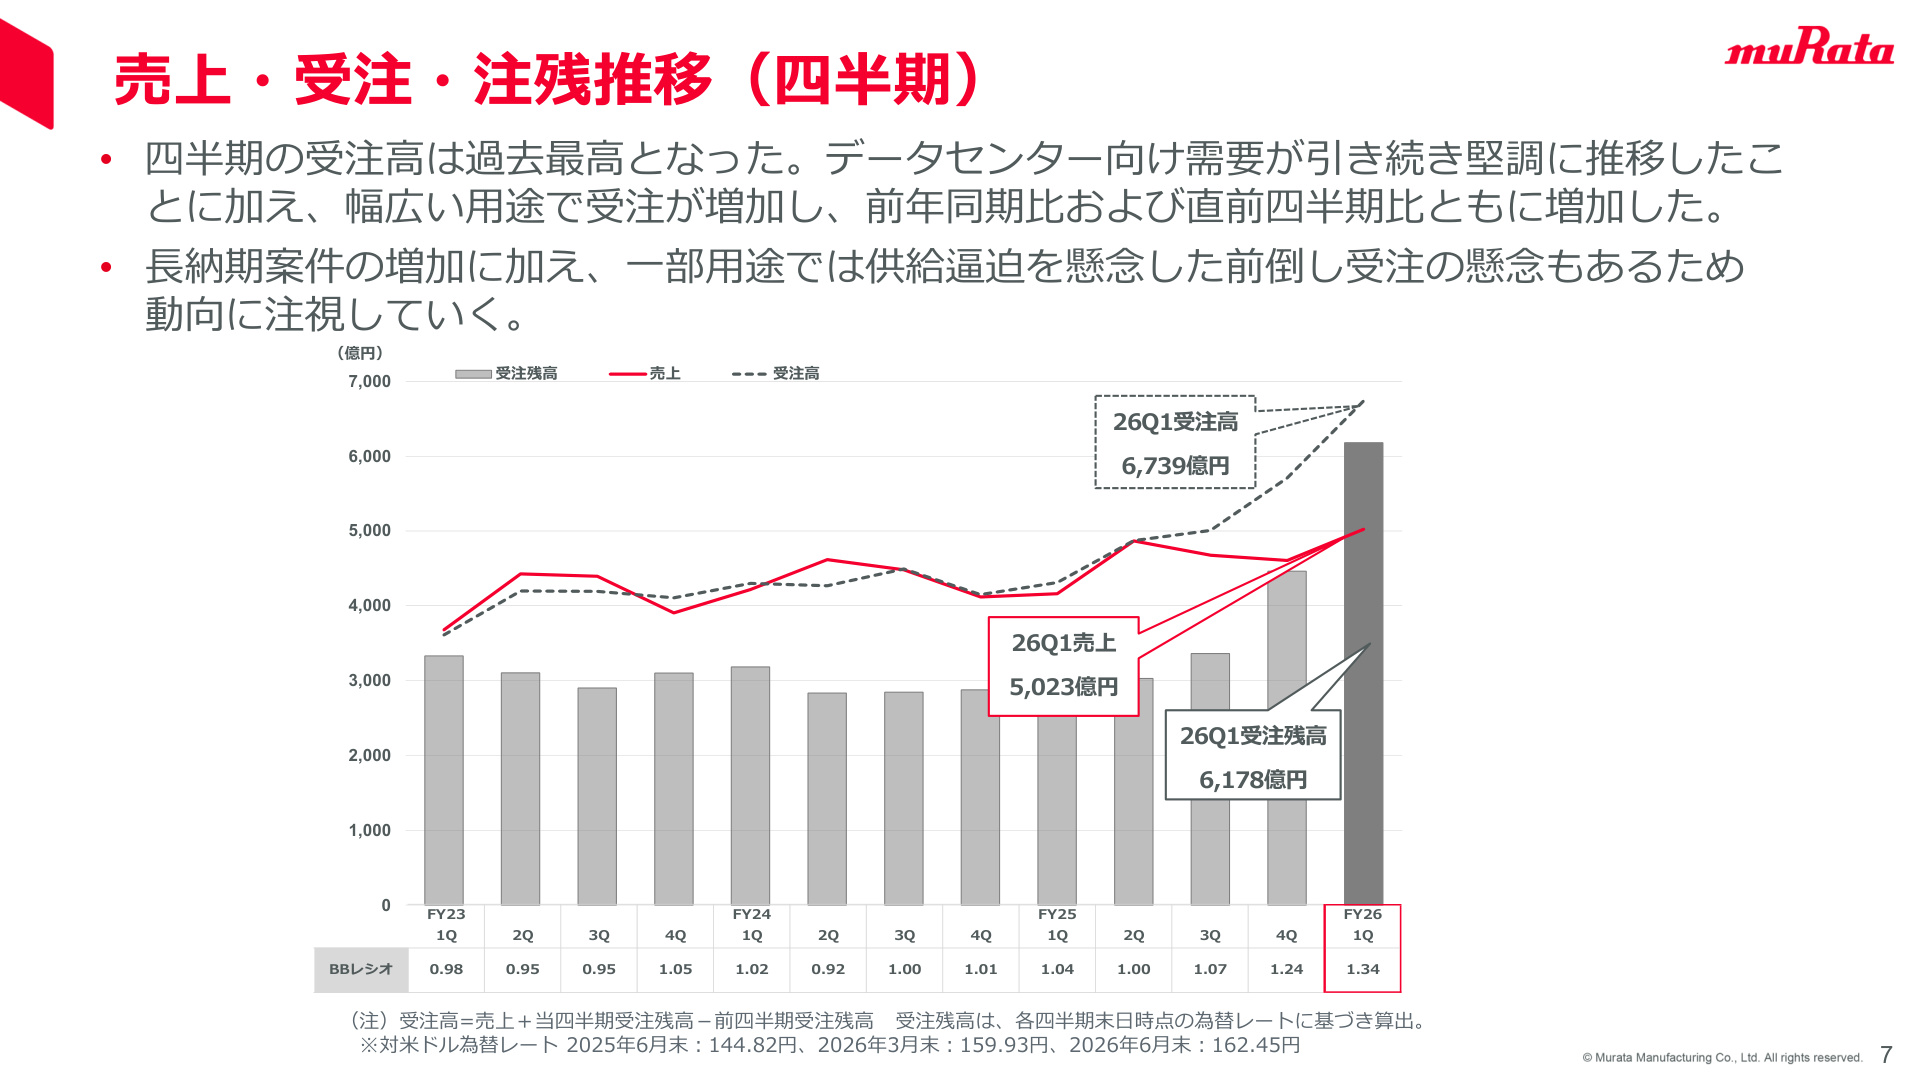
The quarterly trend chart above (Slide 7) clearly indicates that Murata has entered a dramatic new phase in its demand environment. Order backlog has climbed to 617.8 billion yen , a standout increase compared to previous quarters. This is driven by sustained strength in data center demand alongside broad-based growth across various applications. However, as noted in the materials, some of this may include "front-loaded orders" due to concerns over longer lead times, necessitating careful monitoring to gauge actual demand levels.
3. AI and Data Center Demand Intensifies Growth in Computer Applications
Looking at revenue by application, the primary drivers of the market are clearly shifting. Specifically, revenue from "Computer" applications surged 47.0% YoY to 102.9 billion yen . Within this, "Data Center-related" revenue reached 69.7 billion yen (+81.1% YoY) , nearly doubling from 38.5 billion yen in the same period last year.
With the proliferation of AI servers, there is an increasing demand for high-value-added products, such as power modules capable of handling higher power requirements and high-quality Multi-Layer Ceramic Capacitors (MLCCs) for stable power delivery and noise suppression.
4. Dramatic Recovery in Core Components (MLCCs, etc.)
The "Components" segment, the company's core business, was the primary engine for overall growth:
- Capacitor (MLCC) Revenue : 282.5 billion yen (+30.0% YoY)
- Inductor/EMI Filter Revenue : 64.3 billion yen (+22.4% YoY)
Total revenue for the Components segment reached 349.3 billion yen (+27.5% YoY), with a segment operating profit of 113.6 billion yen (+59.5% YoY) , achieving an exceptionally high operating margin of 32.5% . The improvement in capacity utilization directly translated into higher profit margins.
5. Analysis of Profit Variance: Capacity Utilization Gains Offset Price Reductions
An analysis of the profit growth from 61.6 billion yen in the same period last year to 98.5 billion yen this quarter (+36.8 billion yen) highlights the strength of the company's manufacturing capabilities.
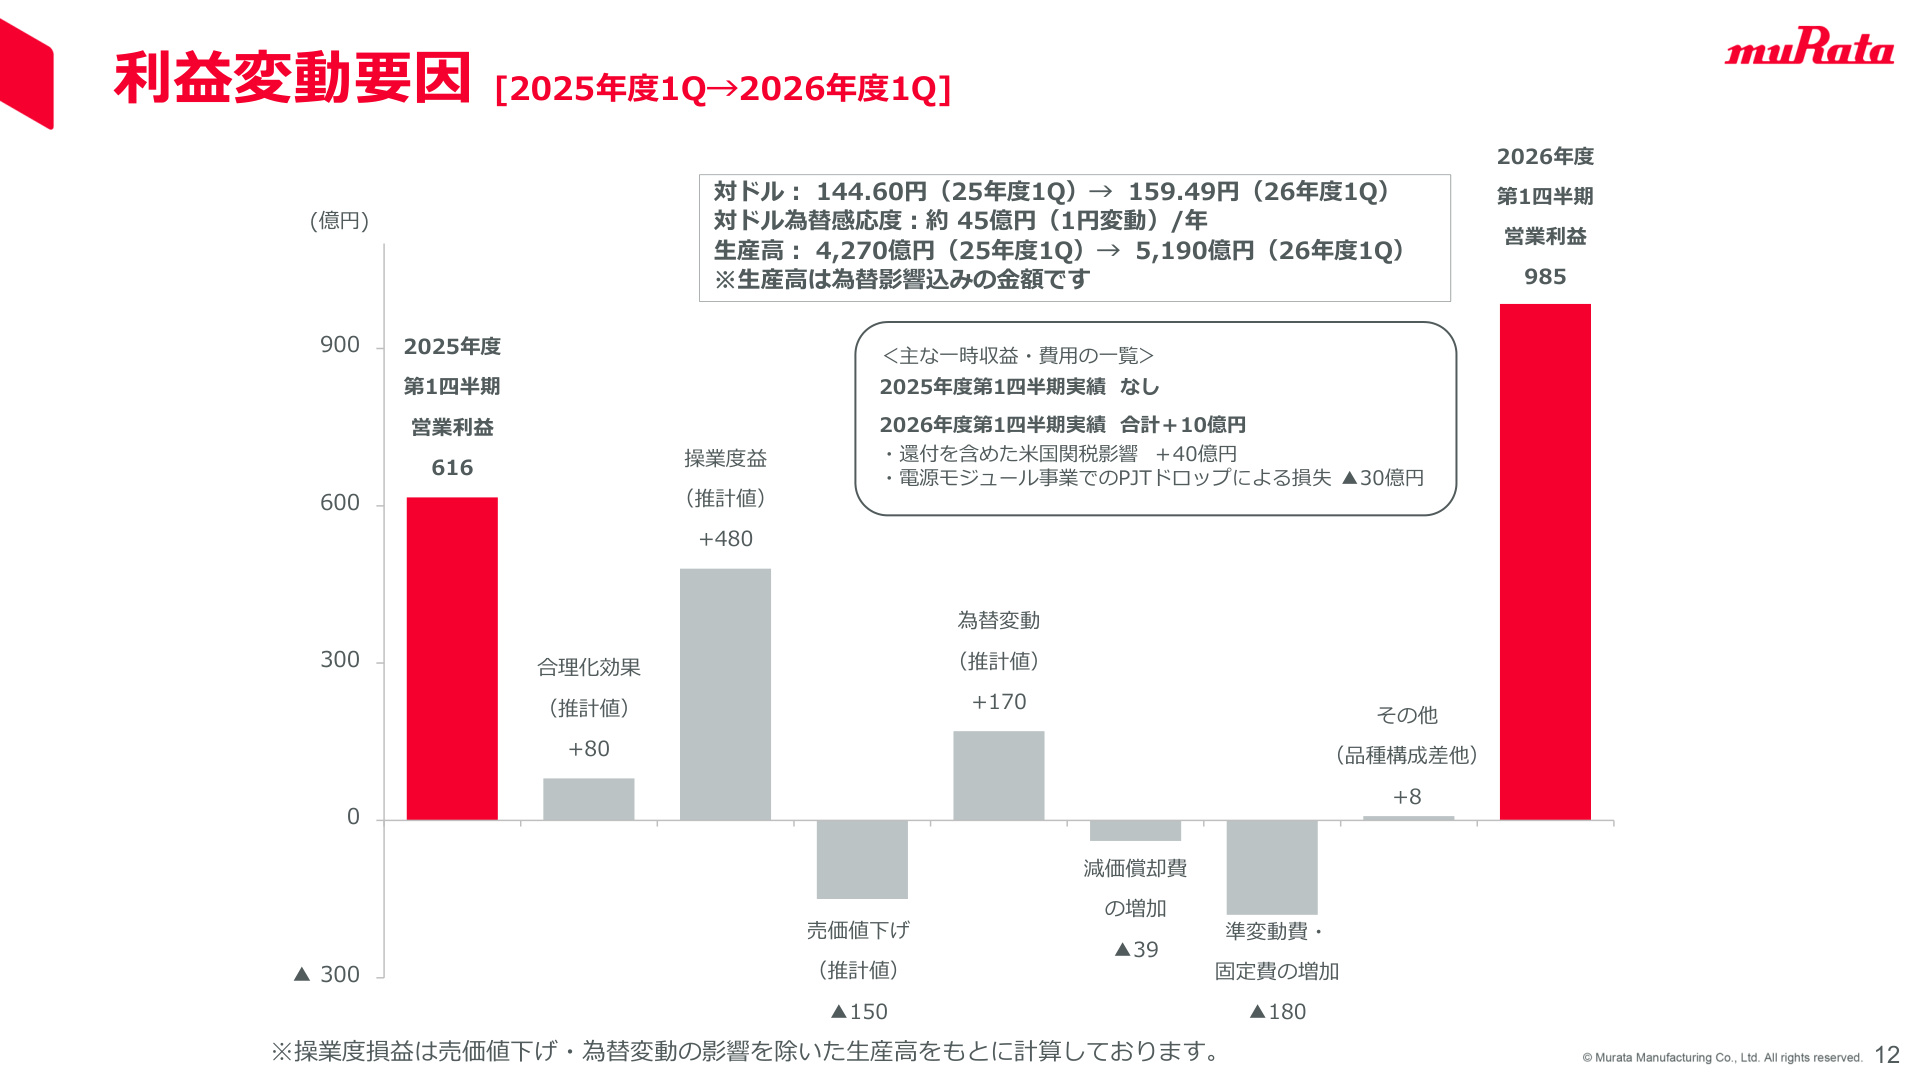
As shown in the profit variance analysis on Slide 12, the largest contributor was gains from capacity utilization (estimated +48.0 billion yen) . With production volume increasing significantly from 427.0 billion yen to 519.0 billion yen, factory utilization rates soared, leading to a reduction in the fixed cost burden.
Conversely, negative factors included product price reductions (estimated -15.0 billion yen) , increases in fixed and variable costs (-18.0 billion yen) , and higher depreciation expenses (-3.9 billion yen). However, these were strongly offset by foreign exchange effects (estimated +17.0 billion yen, with the USD rate weakening from 144.60 to 159.49 yen) and rationalization efforts (estimated +8.0 billion yen), resulting in a significant increase in operating profit.
6. Challenges in the Device & Module Segment and Absorption of One-time Losses
Meanwhile, the "Device & Module" segment saw revenue of 151.4 billion yen (+6.2% YoY) , but segment operating profit resulted in a loss of 12.9 billion yen (compared to a loss of 8.0 billion yen in the same period last year).
This was due to a decline in high-frequency modules for smartphones and PCs, sluggish demand for lithium-ion batteries in power tools, and a one-time loss of 3.0 billion yen from a project drop in the power module business . While there were positive one-time factors, such as a 4.0 billion yen refund from U.S. tariffs, the strong performance of the company as a whole successfully compensated for the weakness in the module business.
7. Significant Upward Revision of Full-Year Earnings Forecast
Given the strong Q1 progress and the robust momentum in AI server demand, the company has significantly raised its full-year earnings forecast for FY2026:
- Revenue Forecast : 2.11 trillion yen (+150 billion yen, +7.7% vs. April forecast)
- Operating Profit Forecast : 430 billion yen (+50 billion yen, +13.2% vs. April forecast)
- Net Profit Attributable to Owners of the Parent : 338 billion yen (+45 billion yen, +15.4% vs. April forecast)
- Projected ROIC (after-tax) : 13.9% (up from 12.3% in the April forecast)
Both revenue and operating profit are expected to reach record highs for the full year.
8. Updated Business Environment Outlook and Assumptions
In conjunction with the upward revision, the company has significantly updated its business environment assumptions as of July compared to the start of the fiscal year (April).
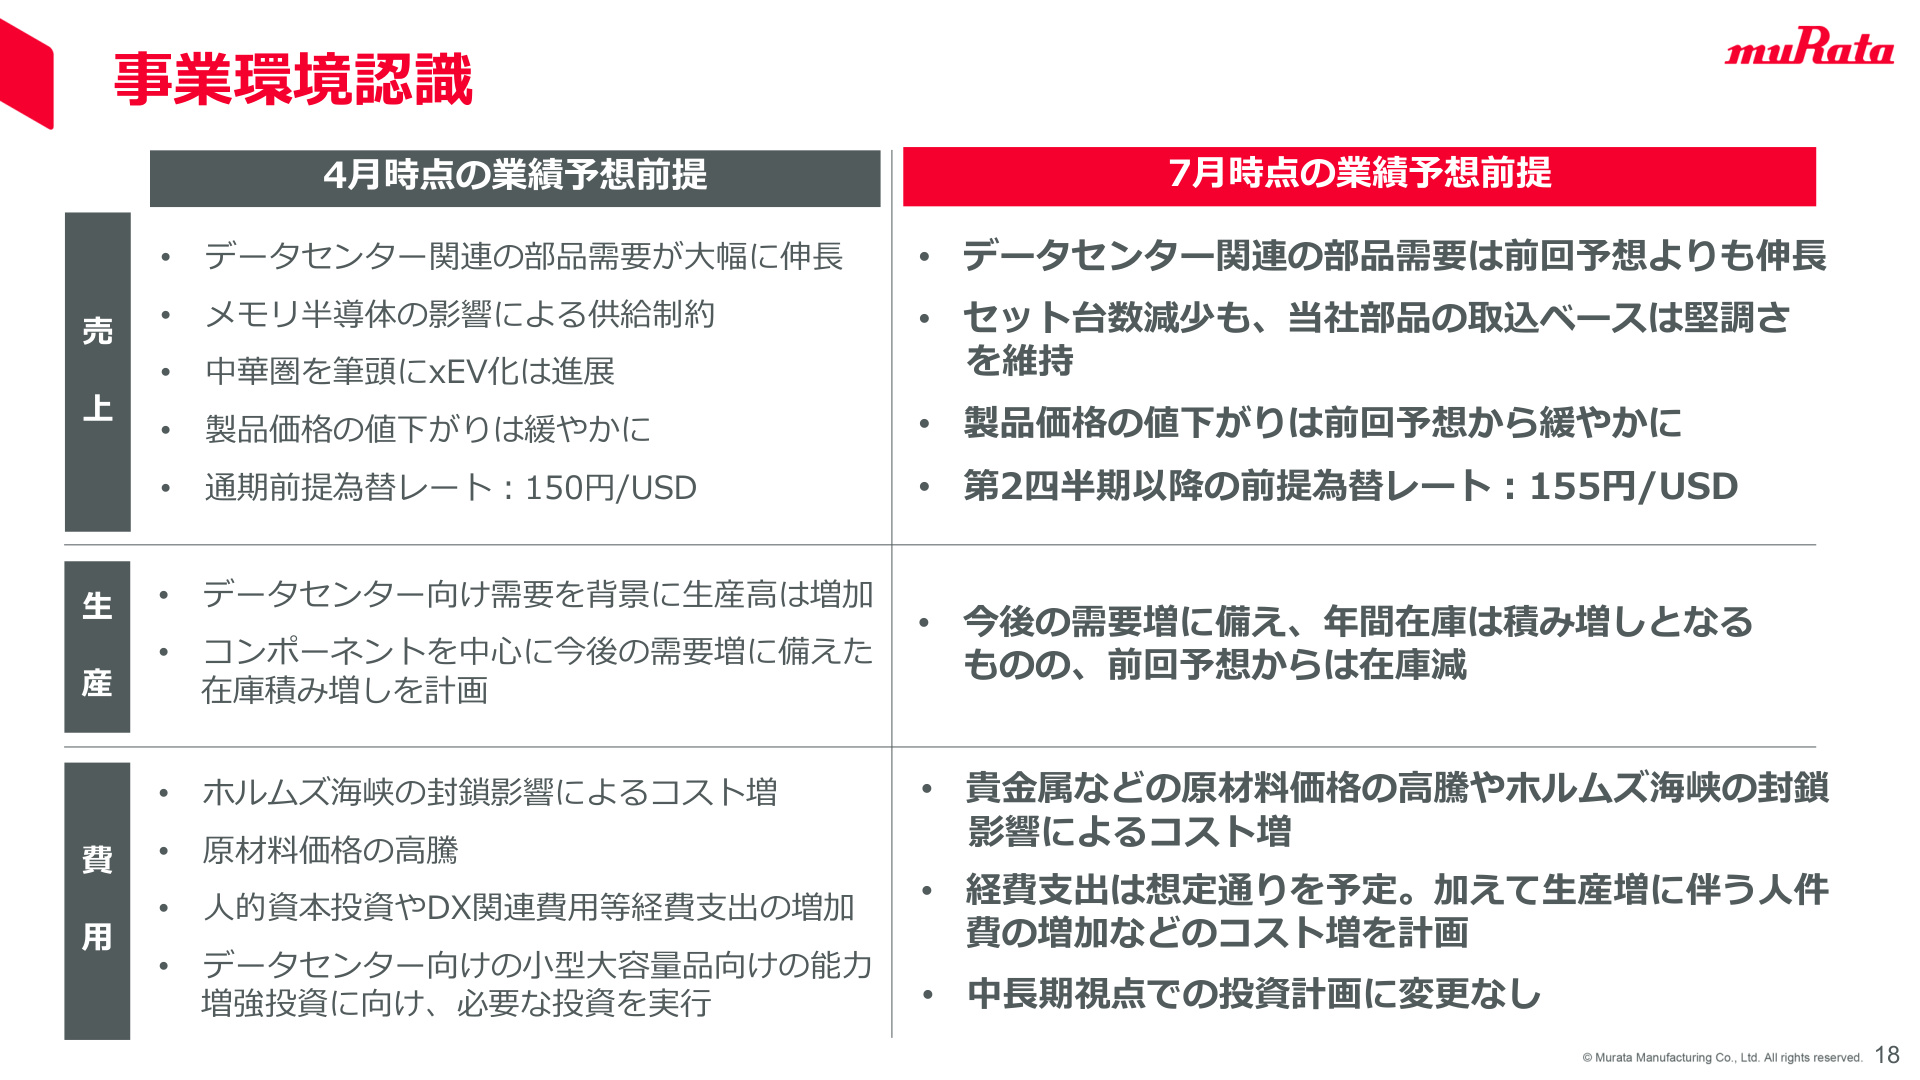
As shown in the comparison on Slide 18, the key changes in the market environment are as follows:
- Revenue Environment : Demand for data center-related components is growing faster than previously anticipated. While unit demand for smartphones and PCs is expected to decline YoY due to supply constraints in memory semiconductors, Murata’s high-end component adoption remains solid.
- FX Assumptions : The assumed exchange rate for the second quarter and beyond has been changed from 150 yen to 155 yen per dollar (full-year average assumption: 156.12 JPY/USD).
- Costs and Investment : While anticipating higher logistics costs due to rising raw material prices and risks such as the closure of the Strait of Hormuz, the company has increased its capital expenditure plan to meet rising demand.
9. Increased Capital Expenditure and Capital Allocation for Future Growth
To expand supply capacity in response to increased demand, the company has raised its full-year capital expenditure plan from 250 billion yen to 255 billion yen (+5 billion yen) . Priority investments will be directed toward product groups with guaranteed future demand, such as device/module products and small, high-capacity MLCCs.
Furthermore, the company plans 174 billion yen in annual R&D expenses and 182 billion yen in depreciation , maintaining its commitment to R&D to sustain its competitive edge.
10. Maintenance of Shareholder Return Policy
Despite the upward revision in earnings, the company has kept its annual dividend forecast unchanged from the previous announcement. Additionally, the planned 150 billion yen share buyback for this fiscal year will proceed as originally scheduled.
Summary and Outlook
Murata Manufacturing’s Q1 FY2026 results demonstrate a company successfully capturing a clear growth driver in the AI and data center market , achieving high profitability through improved factory utilization (capacity utilization gains).
While facing concerns such as sluggish smartphone unit growth, rising raw material costs, and challenges in certain module businesses, these are being far outweighed by structural demand growth and the benefits of a weaker yen. With the order backlog swelling to 617.8 billion yen, the focus will now shift to monitoring the risk of a reaction to front-loaded orders, while ensuring that planned production capacity increases are executed to achieve the record-high earnings forecast of 430 billion yen in operating profit.
This content is not intended as investment advice or a recommendation. Any opinions expressed are solely the personal views of each article.