


FANUC Q1 FY2026 Earnings Report: Double-Digit Growth Across All Major Segments and Upward Revision of Full-Year Guidance Driven by Sharp Order Recovery

StockClub
Published: Jul 31, 2026, 10:30 AM
Sentiment Analysis
FANUC Corporation (Ticker: 6954) reported strong financial results for the first quarter of fiscal year 2026 (April–June 2025) , characterized by significant growth in both revenue and profit . This performance was driven by a recovery in demand across its core Factory Automation (FA), Robot, and Robomachine segments. Orders, a key leading indicator, surged by +36.9% year-on-year, prompting the company to upwardly revise its full-year consolidated earnings forecast.
This report provides a comprehensive analysis based on 10 key topics extracted from the earnings materials, covering current performance, factor analysis, segment and regional breakdowns, and future growth strategies leveraging AI technology.
1. Q1 FY2026 Consolidated Financial Highlights
The consolidated results for the first quarter (three months) showed a strong performance, with both revenue and profit levels significantly exceeding those of the same period last year.
- Net Sales : ¥231.0 billion (+17.7% YoY / +¥34.7 billion)
- Operating Income : ¥53.5 billion (+26.1% YoY / +¥111 billion)
- Operating Margin : 23.2% (+1.6pt YoY)
- Ordinary Income : ¥68.2 billion (+32.3% YoY / +¥16.6 billion)
- Net Income Attributable to Owners of Parent : ¥51.0 billion (+34.7% YoY / +¥13.1 billion)
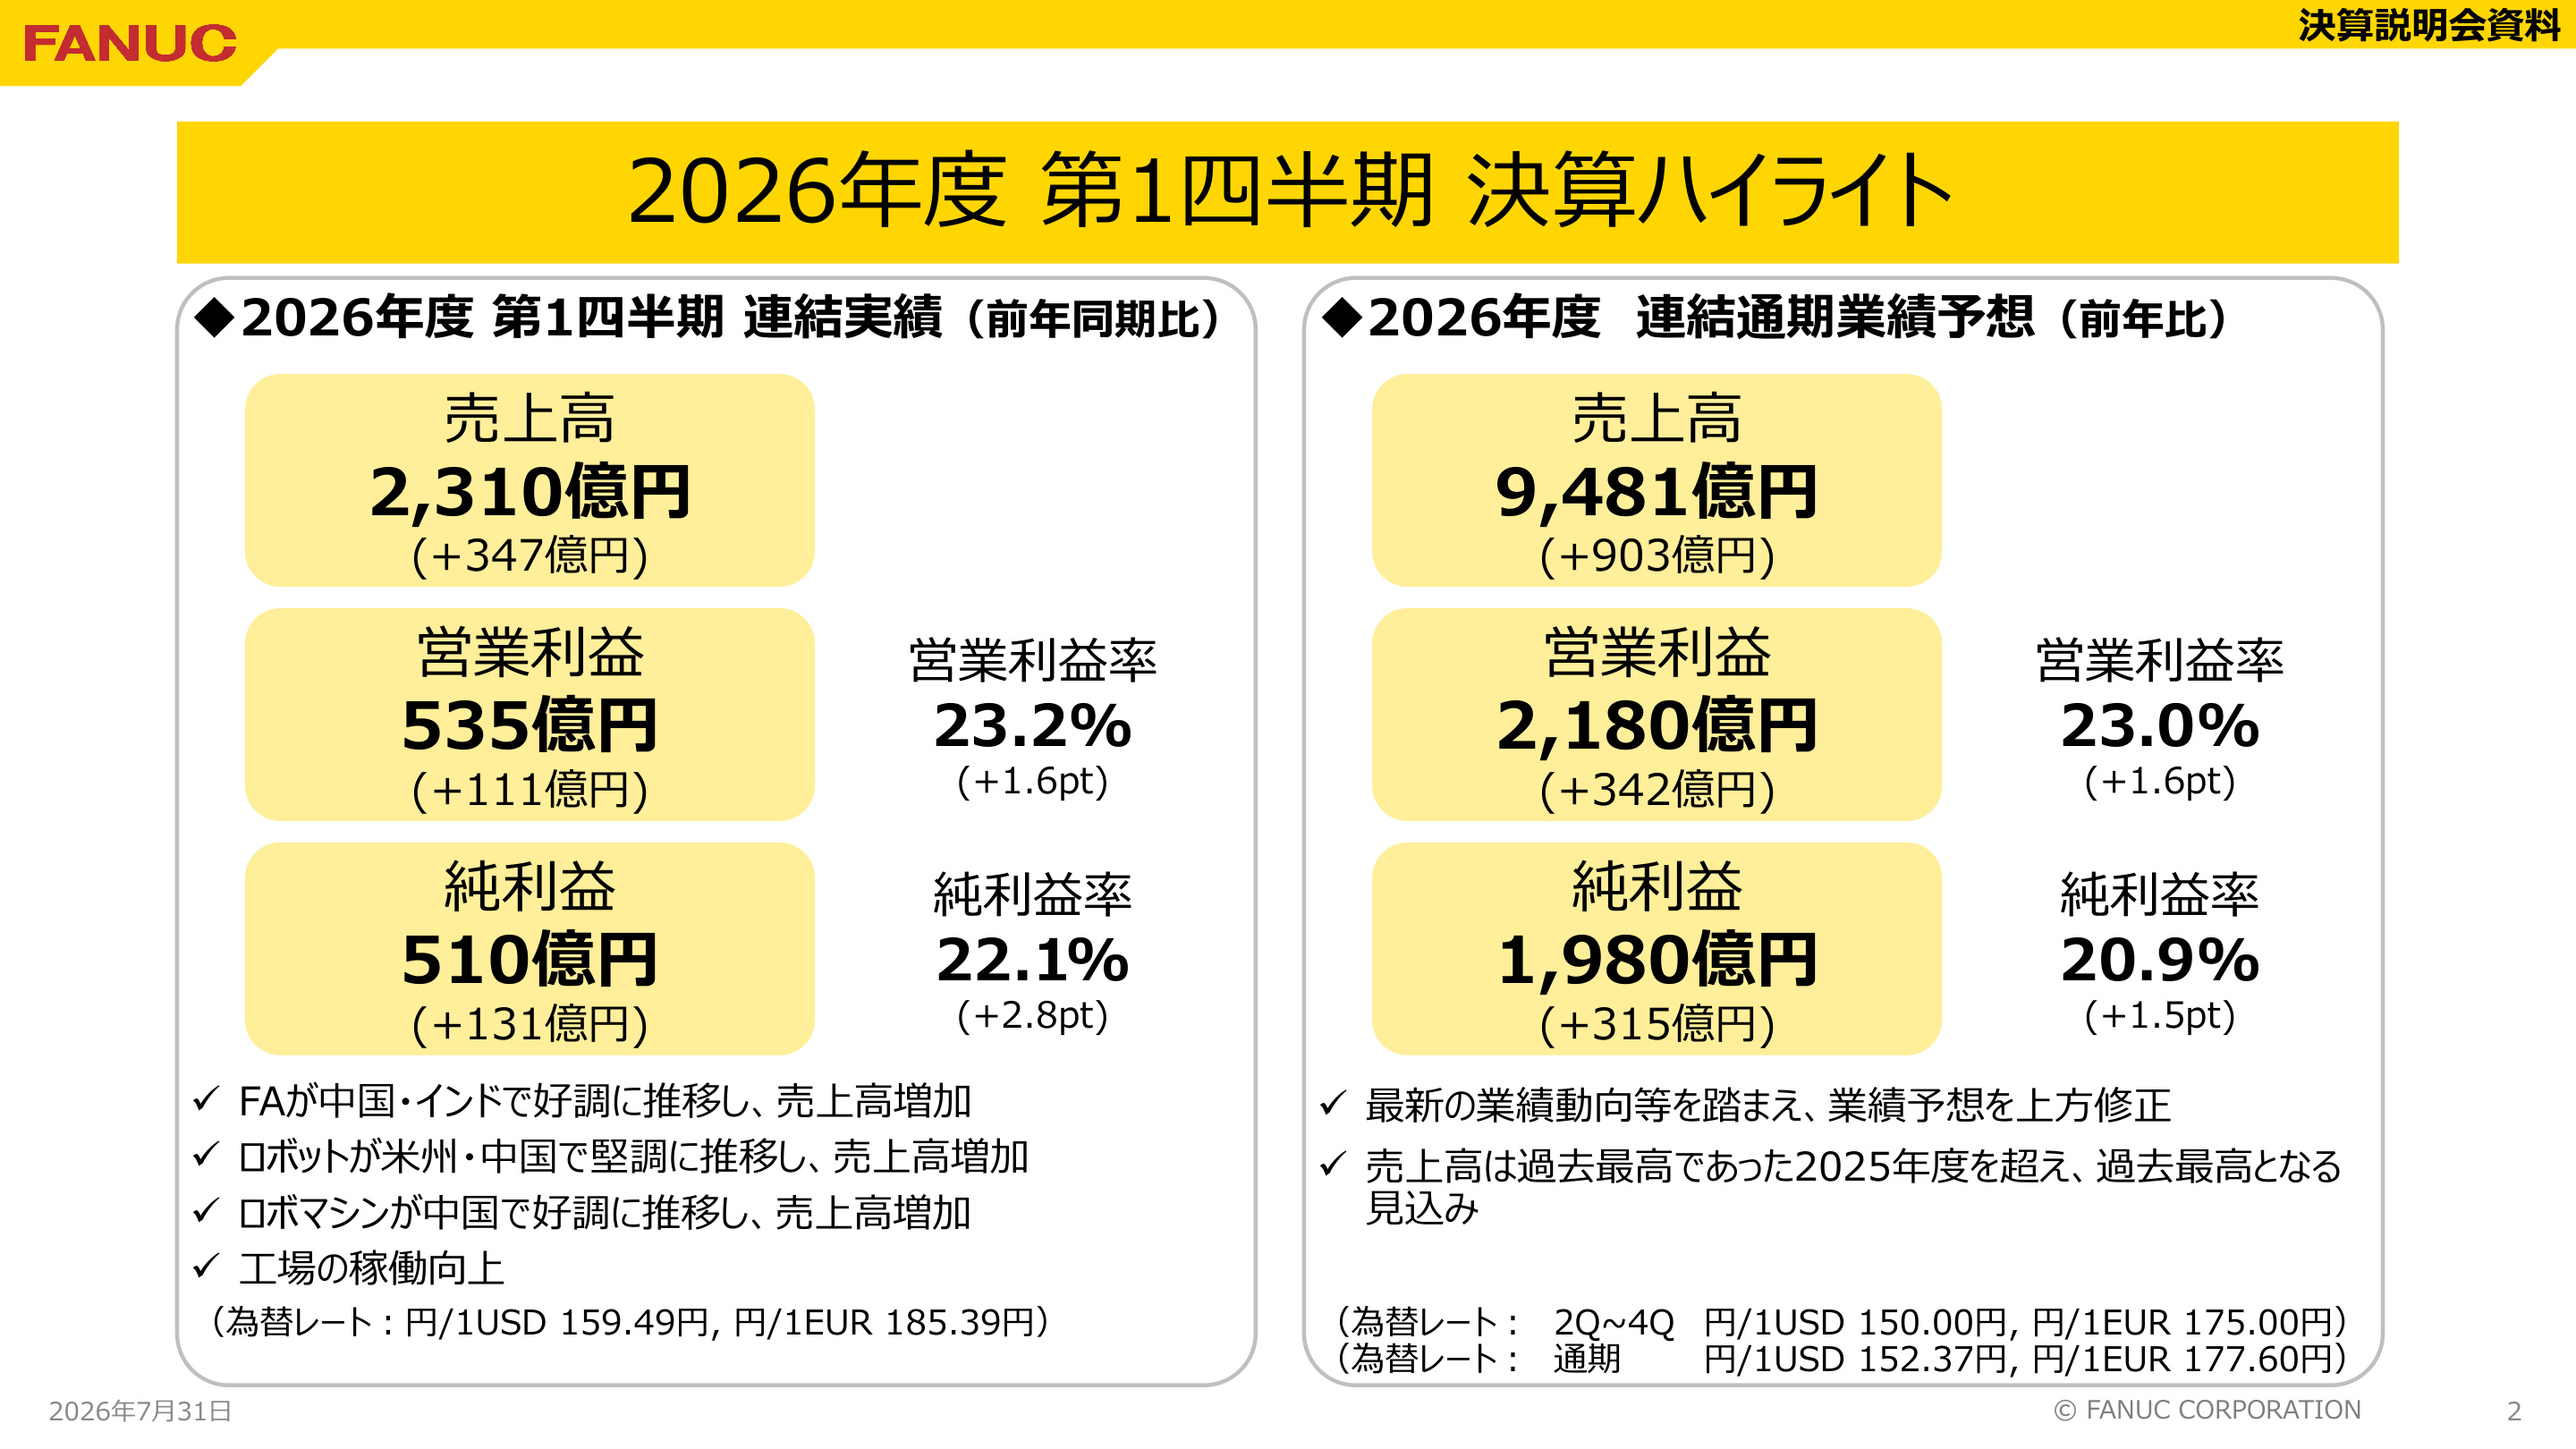
[Slide Commentary: Significance of Earnings Highlights]
The slide above (PAGE_1) summarizes the overall consolidated results and the revision of the full-year forecast. It highlights strong performance in the FA segment in China and India , robust robot demand in the Americas and China , and expansion of the Robomachine segment in the Chinese market. Furthermore, improved profitability due to higher factory utilization rates has bolstered the bottom line. The full-year forecast indicates that net sales are expected to surpass the record-high levels of FY2025 , underscoring the strong current momentum.
2. Profit Structure and Operating Income Variance Analysis
The increase in operating income of ¥11.1 billion from the same period last year (Q1 FY2025: ¥42.4 billion) to the current period (Q1 FY2026: ¥53.5 billion) is analyzed as follows:
- Increase due to higher sales : +¥8.1 billion (Direct increase in marginal profit from sales expansion)
- Change in cost of goods sold : +¥2.0 billion (Manufacturing cost improvements due to higher utilization)
- Impact of unrealized profit : -¥1.2 billion
- Increase in SG&A expenses : -¥1.2 billion (Higher expenses and personnel costs due to business expansion)
- Other (including FX effects) : +¥3.4 billion
Beyond sales growth, reduced manufacturing costs resulting from high utilization were a major driver in pushing the operating margin from 21.6% in the same period last year to 23.2% .
3. Consolidated Net Sales by Business Segment
All major segments achieved double-digit revenue growth compared to the same period last year.
- FA Segment : ¥57.4 billion (+15.5% YoY)
- CNC systems for machine tools remained strong, particularly in China and India.
- Robot Segment : ¥96.1 billion (+18.7% YoY)
- Driven by demand in the EV/automotive sector and general industry in the Americas and China.
- Robomachine Segment : ¥41.7 billion (+22.8% YoY)
- Significant growth in compact machining centers (ROBODRILL), primarily in China.
- Service Segment : ¥35.9 billion (+13.0% YoY)
- Maintenance and service demand remained steady in line with higher customer factory utilization.
4. Regional Analysis of Consolidated Net Sales
In terms of regional composition, the strong recovery in the Chinese market is particularly notable.
- China : ¥69.3 billion (+30.0% YoY)
- Rapid recovery across FA, Robomachine, and Robot segments, making it the largest market at 30.0% of total sales.
- Americas : ¥58.1 billion (+21.4% YoY)
- Maintained high sales levels, centered on robots, supported by persistent automation investment (25.1% of total).
- Europe : ¥38.2 billion (+10.9% YoY)
- Continued moderate recovery trend (16.5% of total).
- Asia (excluding China) : ¥35.7 billion (+7.0% YoY)
- Contributed by growth in the Indian market (15.5% of total).
- Japan : ¥27.6 billion (+8.4% YoY)
- Signs of a recovery in capital expenditure.
5. Leading Indicator: Dramatic Expansion in Consolidated Orders
Orders, the most critical indicator for future performance, showed a very strong expansion this quarter.
- Total Consolidated Orders : ¥281.9 billion (+36.9% YoY / +11.9% QoQ)
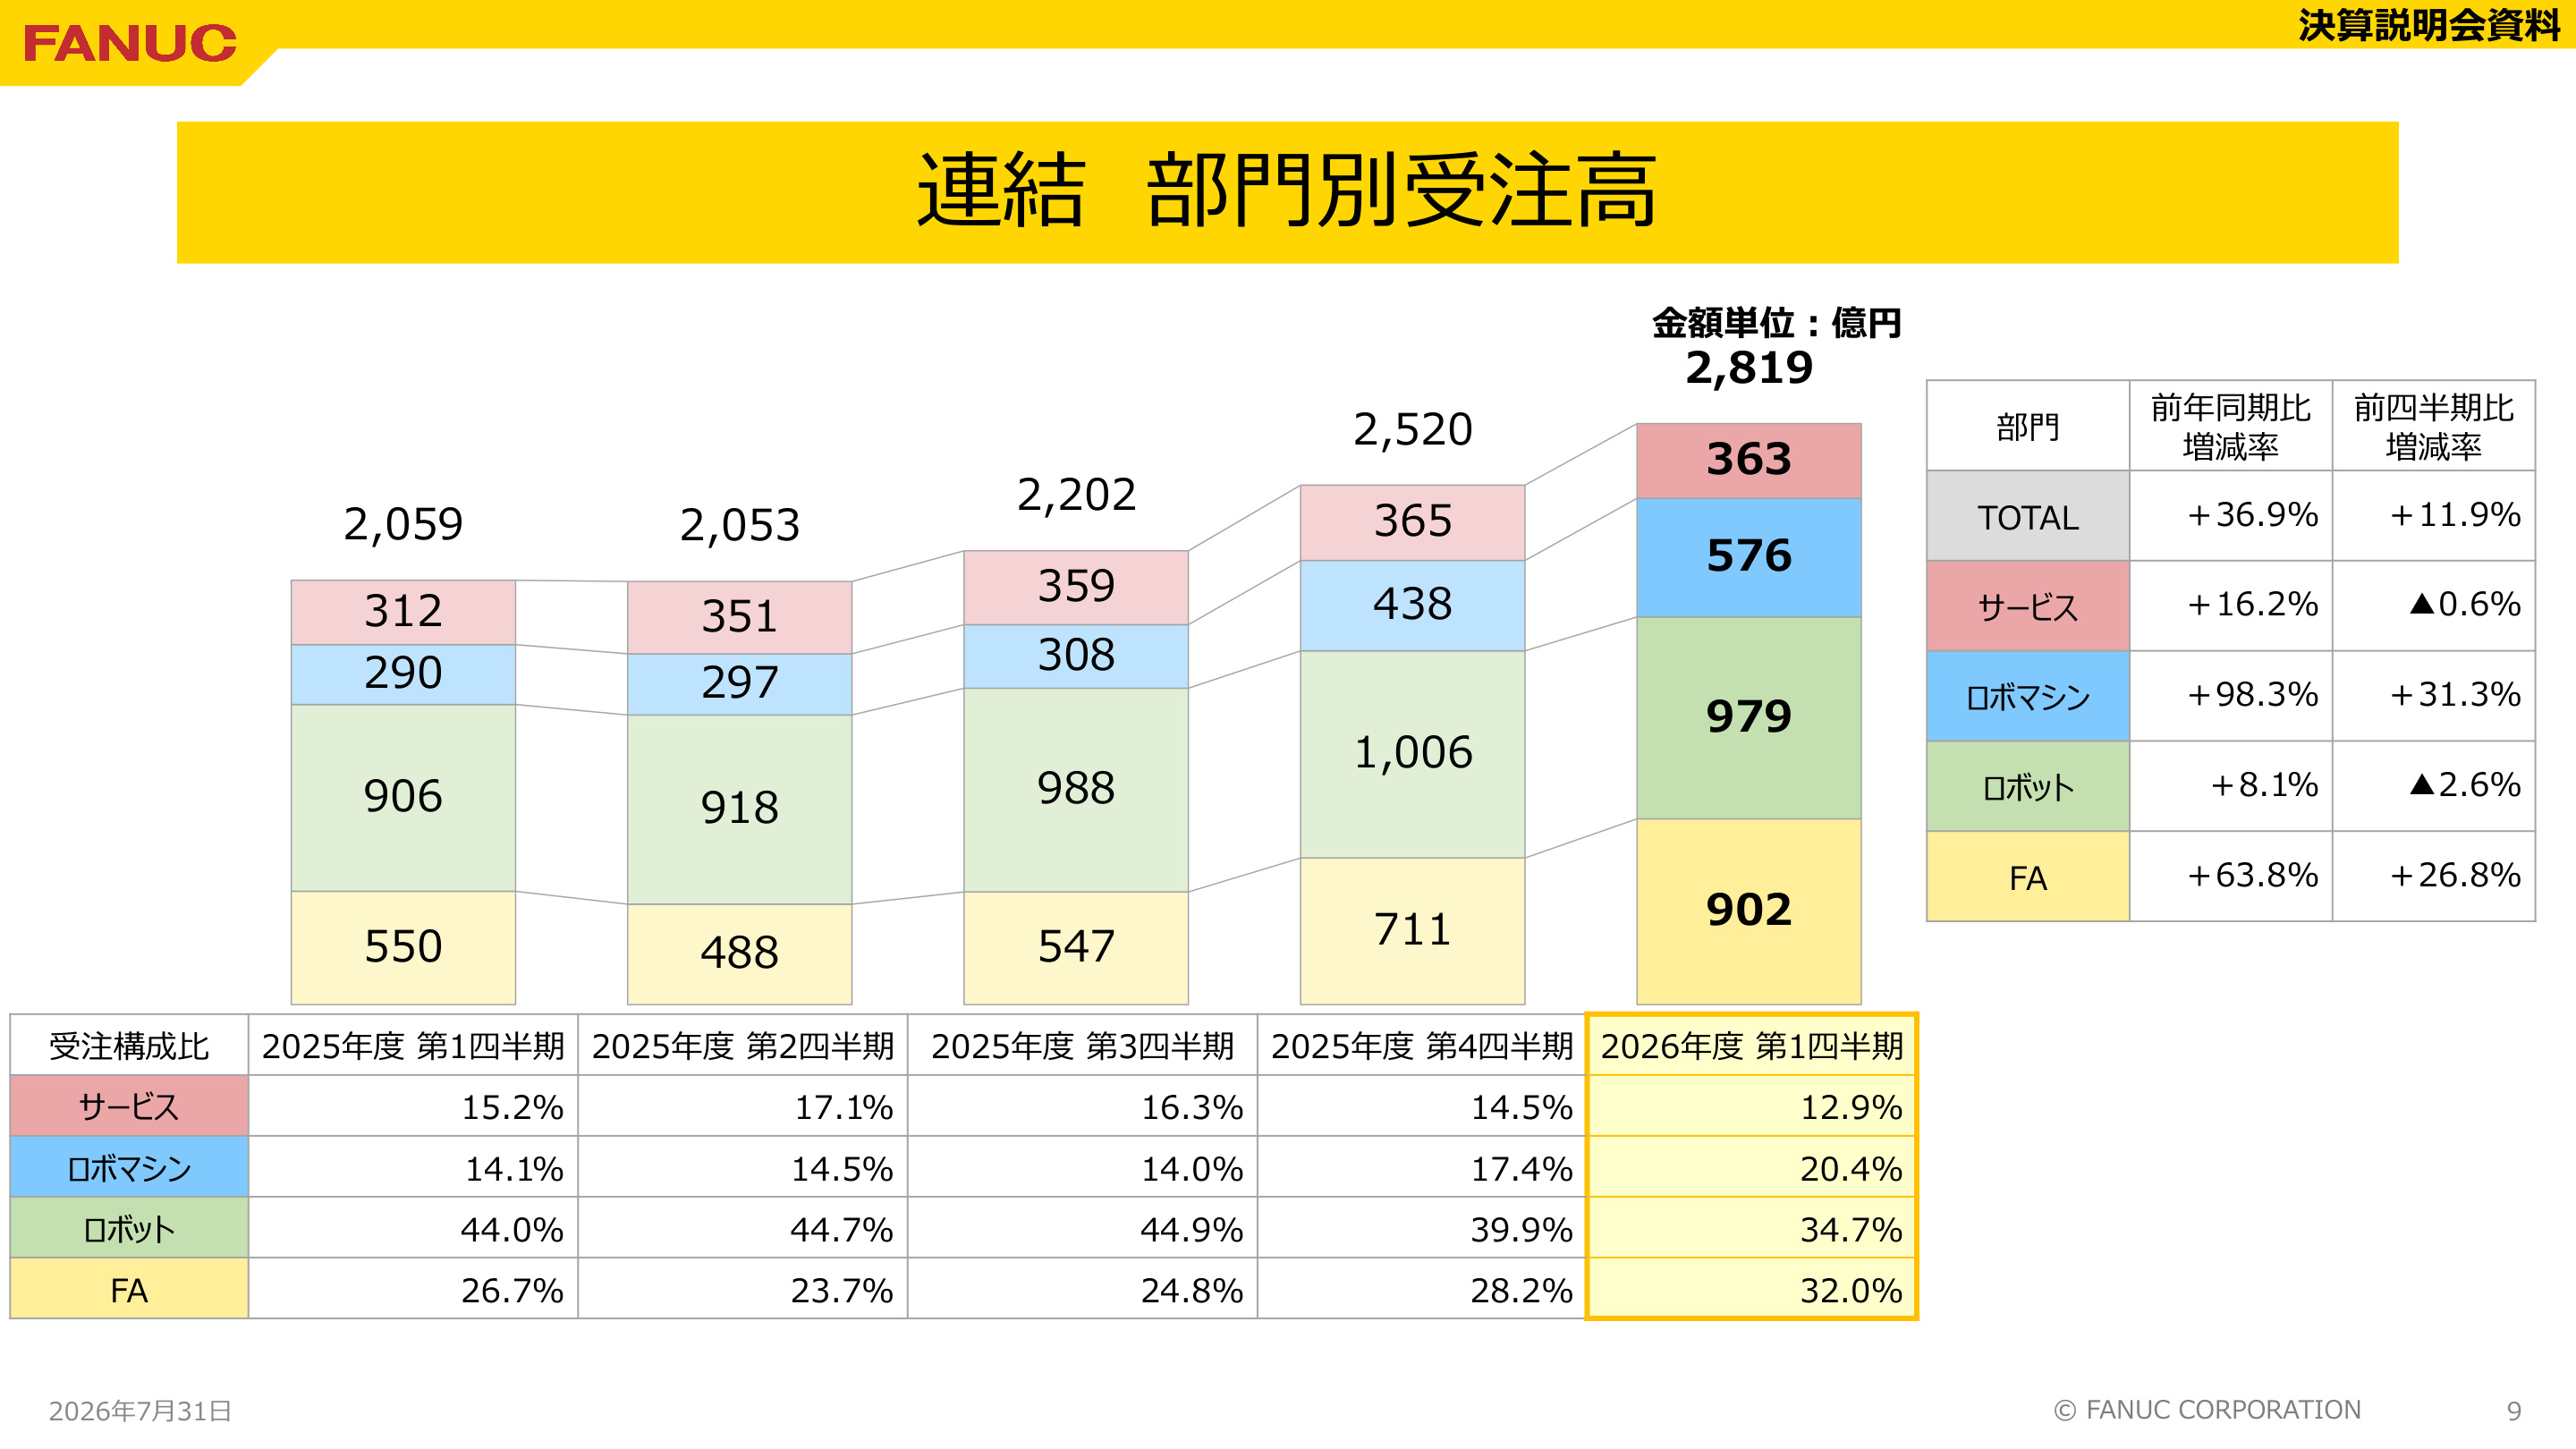
[Slide Commentary: Context of Orders by Segment]
The slide above (PAGE_8) shows the quarterly trend of orders by segment. This slide is crucial because it demonstrates that orders reached ¥281.9 billion, significantly exceeding net sales of ¥231.0 billion (BB ratio > 1) , thereby securing future revenue growth. Specifically, FA segment orders surged to ¥90.2 billion (+63.8% YoY) and Robomachine orders to ¥57.6 billion (+98.3% YoY) , confirming that the capital expenditure cycle has clearly bottomed out and entered a phase of robust expansion.
6. Regional Order Trends and Demand Environment
Looking at orders by region, the surge in demand across Asia is prominent.
- China Orders : ¥88.7 billion (+50.9% YoY / +12.3% QoQ)
- Asia (excl. China) Orders : ¥49.1 billion (+75.8% YoY / +33.3% QoQ)
- Japan Orders : ¥39.3 billion (+51.3% YoY / +14.6% QoQ)
- Europe Orders : ¥38.9 billion (+17.1% YoY / +3.6% QoQ)
- Americas Orders : ¥62.8 billion (+8.3% YoY / +2.7% QoQ)
With order growth exceeding 50% YoY in Japan, China, and other parts of Asia, it is evident that demand for equipment replacement in general machinery, electronic component processing, and the automotive sector is broadly rising.
7. Upward Revision of Full-Year Consolidated Earnings Forecast
Based on the strong Q1 performance and current order environment, the company has significantly revised its full-year consolidated earnings forecast.
- Net Sales : ¥948.1 billion (+¥38.5 billion from previous forecast / +10.5% YoY)
- Operating Income : ¥218.0 billion (+¥5.8 billion from previous forecast / +18.6% YoY)
- Ordinary Income : ¥271.2 billion (+¥14.2 billion from previous forecast / +19.2% YoY)
- Net Income : ¥198.0 billion (+¥13.1 billion from previous forecast / +18.9% YoY)
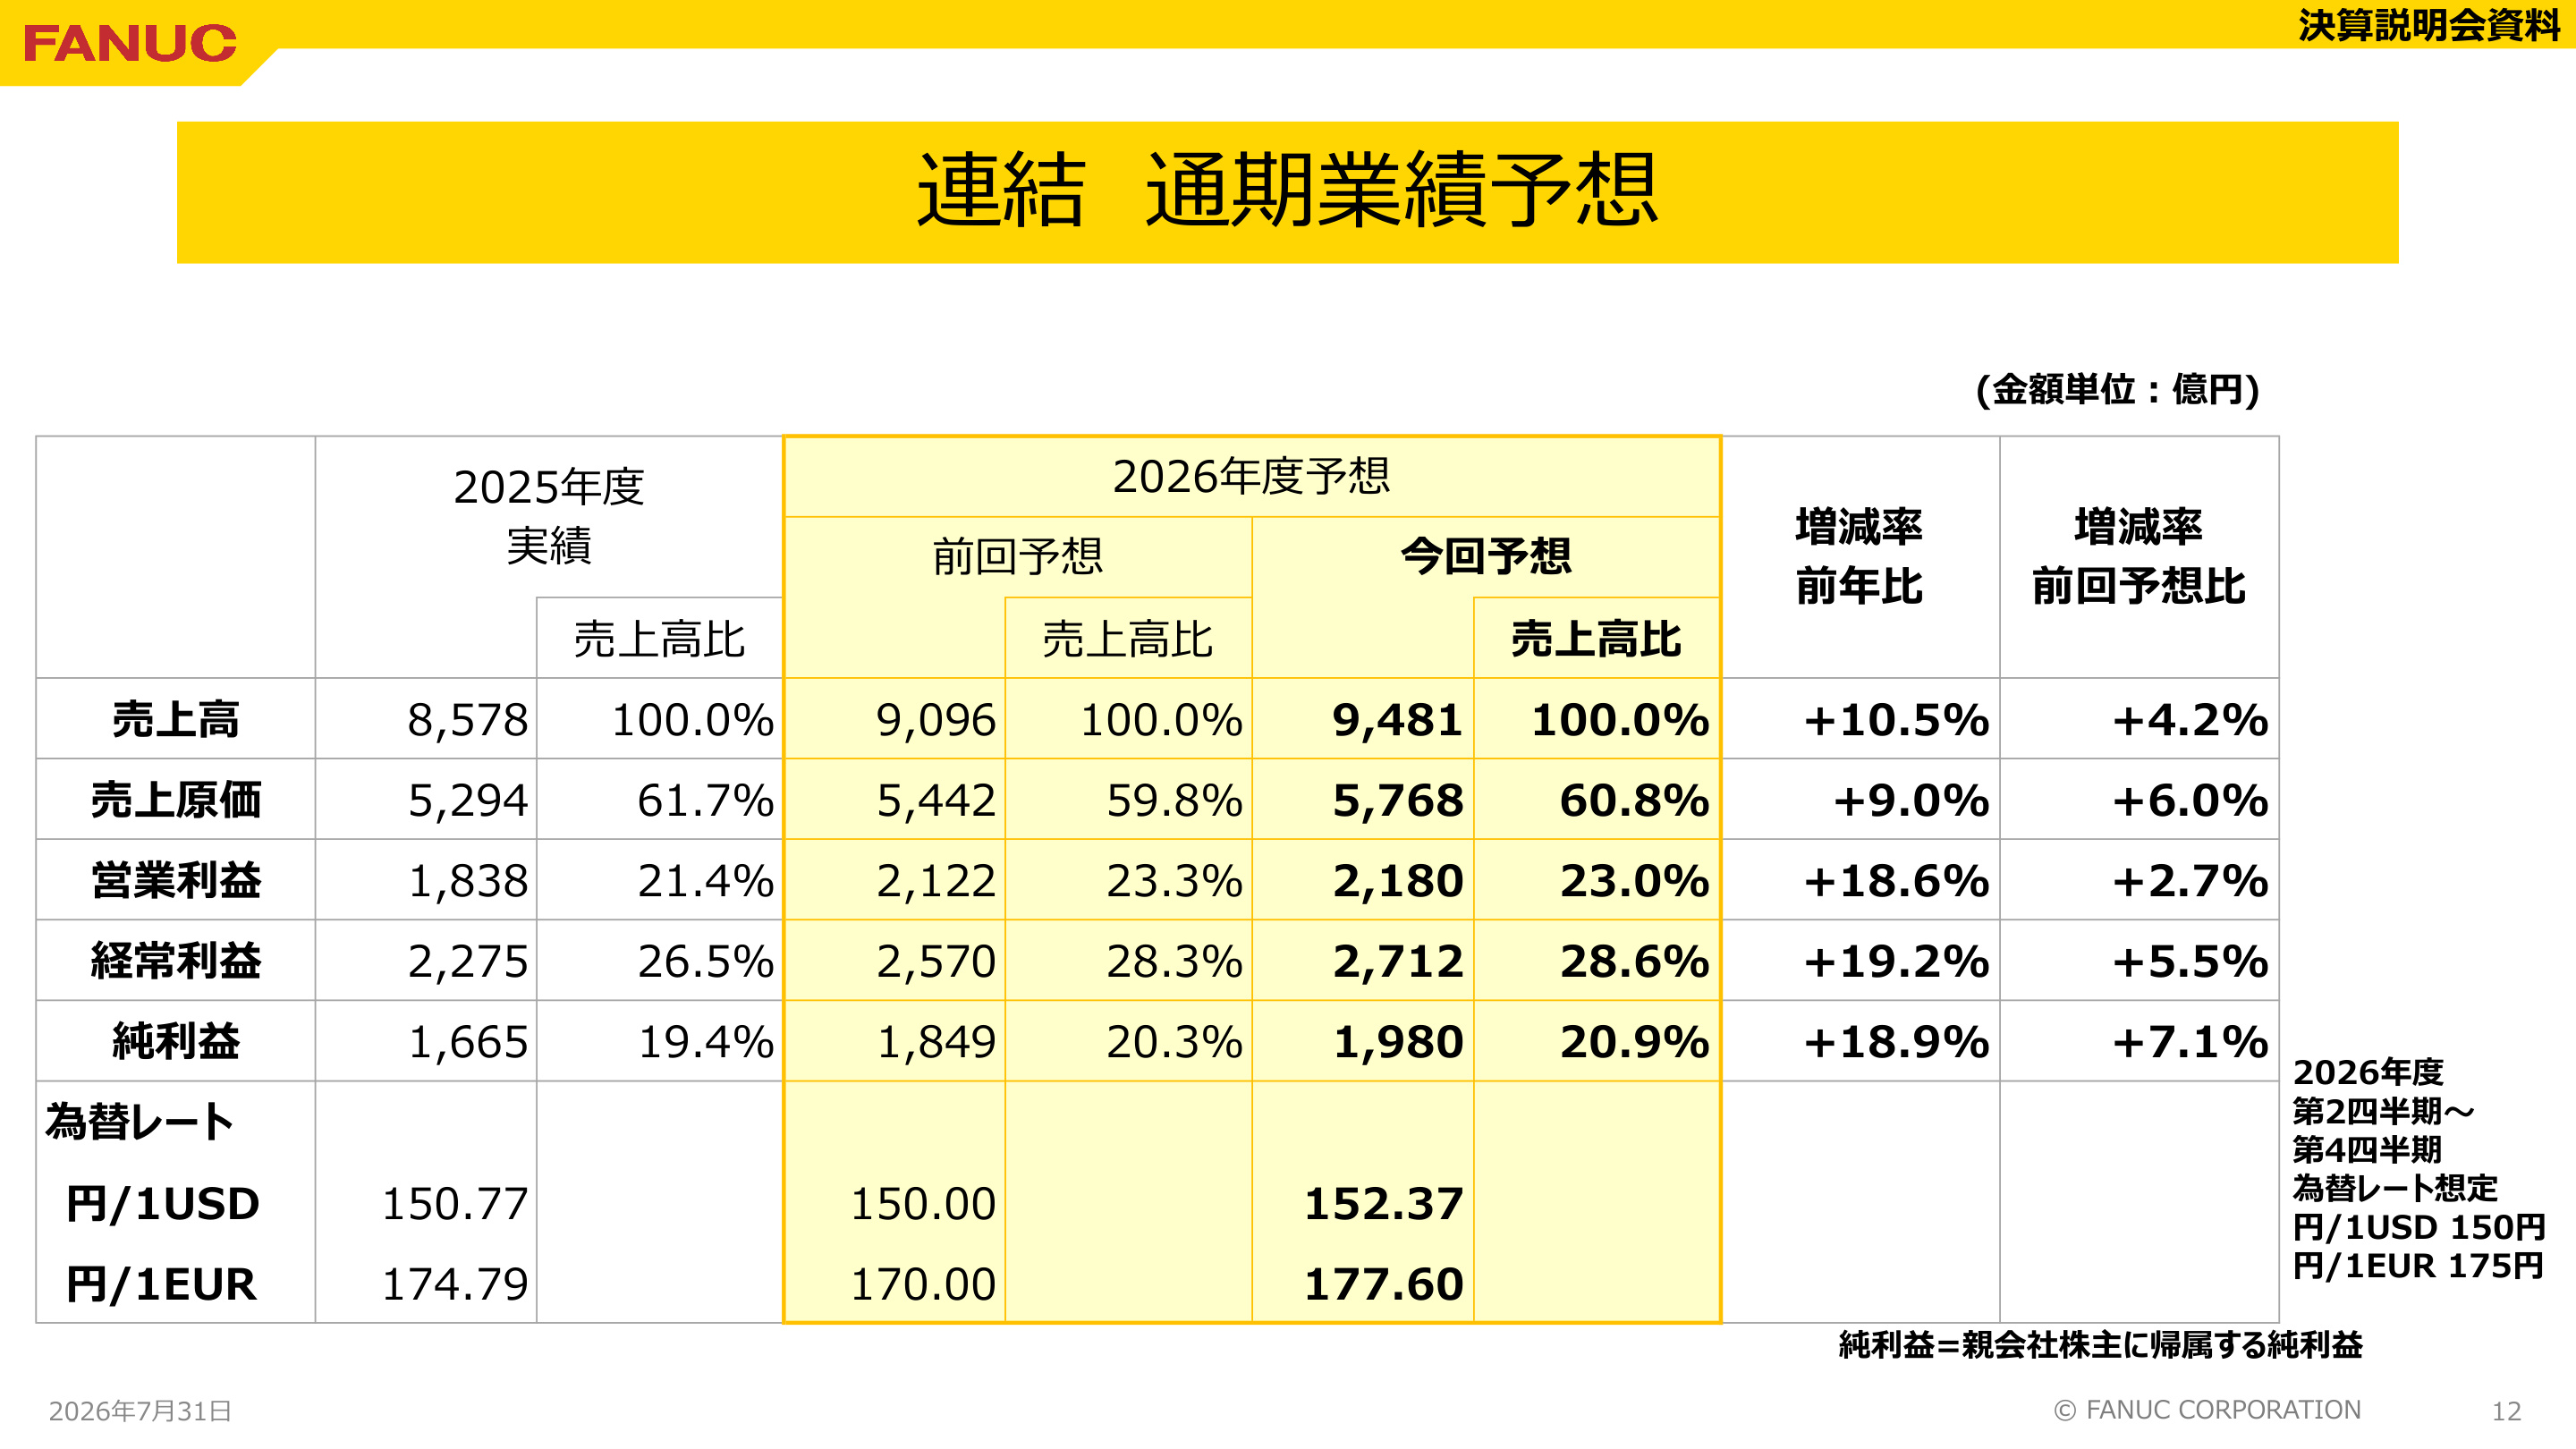
[Slide Commentary: Assumptions and Significance of Forecast Revision]
The slide above (PAGE_11) summarizes the details and assumptions of the revised full-year forecast. Net sales are now expected to reach ¥948.1 billion, comfortably surpassing the previous record high (FY2025: ¥857.8 billion). The assumed exchange rates have also been revised to more effective levels for the second quarter onwards: 1 USD = 150.00 JPY, 1 EUR = 175.00 JPY (full-year average: 1 USD = 152.37 JPY, 1 EUR = 177.60 JPY). The structure is one where not only currency tailwinds but also substantial demand growth are driving both sales and profits.
8. New Product and Technology Strategy: Fusion of Physical AI and Advanced Technology
The company held the "35th FANUC New Product Exhibition" (7,917 attendees), showcasing numerous innovative technologies to support the next generation of manufacturing.
- Physical AI CNC : Realizing autonomous machine tools using generative AI. Proposing AI client apps that enable natural language troubleshooting prompts and machining optimization.
- Next-Generation Robots via Collaboration with Google and NVIDIA : Deploying advanced physical AI robots, such as autonomous kitting using Google's "Gemini Enterprise" and automatic T-shirt folding using imitation learning with NVIDIA's AI technology for robotics.
- Evolution of Robomachines : Introducing the "ROBODRILL D116CS" compact machining center with expanded table stroke and the "ROBOSHOT SC Series" injection molding machine equipped with AI-based molding condition adjustment.
9. Capital Expenditure, R&D, and Lifetime Maintenance Services
Investments to maintain long-term competitiveness and the development of service systems are progressing steadily.
- Capital Expenditure : ¥7.4 billion in Q1 (continuing investment against the FY2025 total of ¥22.0 billion).
- R&D Expenses : ¥10.8 billion in Q1 (prioritizing development of advanced AI, CNC, and control technologies).
- Service Strategy (Lifetime Maintenance) : Based on the philosophy of "Zero Downtime Factories," the company provides maintenance services as long as its products are in operation. It maintains high customer engagement by deploying IoT solutions (e.g., FIELD system Basic Package) that enable predictive maintenance.
10. Summary and Future Outlook
In the first quarter of FY2026, FANUC demonstrated strong performance momentum, underpinned by a sharp recovery in FA and Robomachine demand in China and Asia , and resilient robot demand in the Americas .
The fact that orders exceeded ¥280 billion in a single quarter suggests that demand for automation, labor-saving investment, and equipment replacement in the manufacturing sector is recovering in earnest. Furthermore, it is noteworthy that the company is accelerating the value enhancement of its machine tools and robots through the integration of "Physical AI" via partnerships with companies like Google and NVIDIA , moving beyond mere hardware supply.
As the company aims to achieve record-high full-year sales, market attention will remain focused on global capital expenditure trends and the speed at which the order backlog is converted into revenue.
This content is not intended as investment advice or a recommendation. Any opinions expressed are solely the personal views of each article.