

Earnings Deep Dive: Sumida Corporation FY2026 Q2 Results – Impact of One-time Provisions and Robust Growth in Megatrend Sectors

Sentiment Analysis
Earnings Deep Dive: Sumida Corporation FY2026 Q2 Results
Based on the FY2026 Q2 Earnings Presentation released by Sumida Corporation (Securities Code: 6817), this report provides a detailed analysis of the company's performance, revenue structure, business environment, and long-term growth strategy.
1. Earnings Highlights and One-time Financial Impact of Quality Issues
Sumida Corporation’s performance for the second quarter (standalone and cumulative) showed steady growth in revenue, while operating profit saw a significant decline due to the booking of one-time loss provisions.
Key Metrics for Q2 (3-month period: FY26.2Q)
- Revenue : ¥41.43 billion (+15.8% YoY)
- Operating Profit : ¥401 million (-81.1% YoY)
- Profit Before Tax : -¥328 million (vs. ¥1.372 billion profit in the same period last year)
- Profit Attributable to Owners of the Parent : -¥486 million (vs. ¥1.082 billion profit in the same period last year)
Key Metrics for Cumulative (6-month period: FY26.2Q YTD)
- Revenue : ¥79.858 billion (+12.2% YoY)
- Operating Profit : ¥1.912 billion (-43.2% YoY)
- Progress against Full-Year Forecast : Revenue stands at 51.2% of the ¥156 billion full-year target, indicating steady progress.
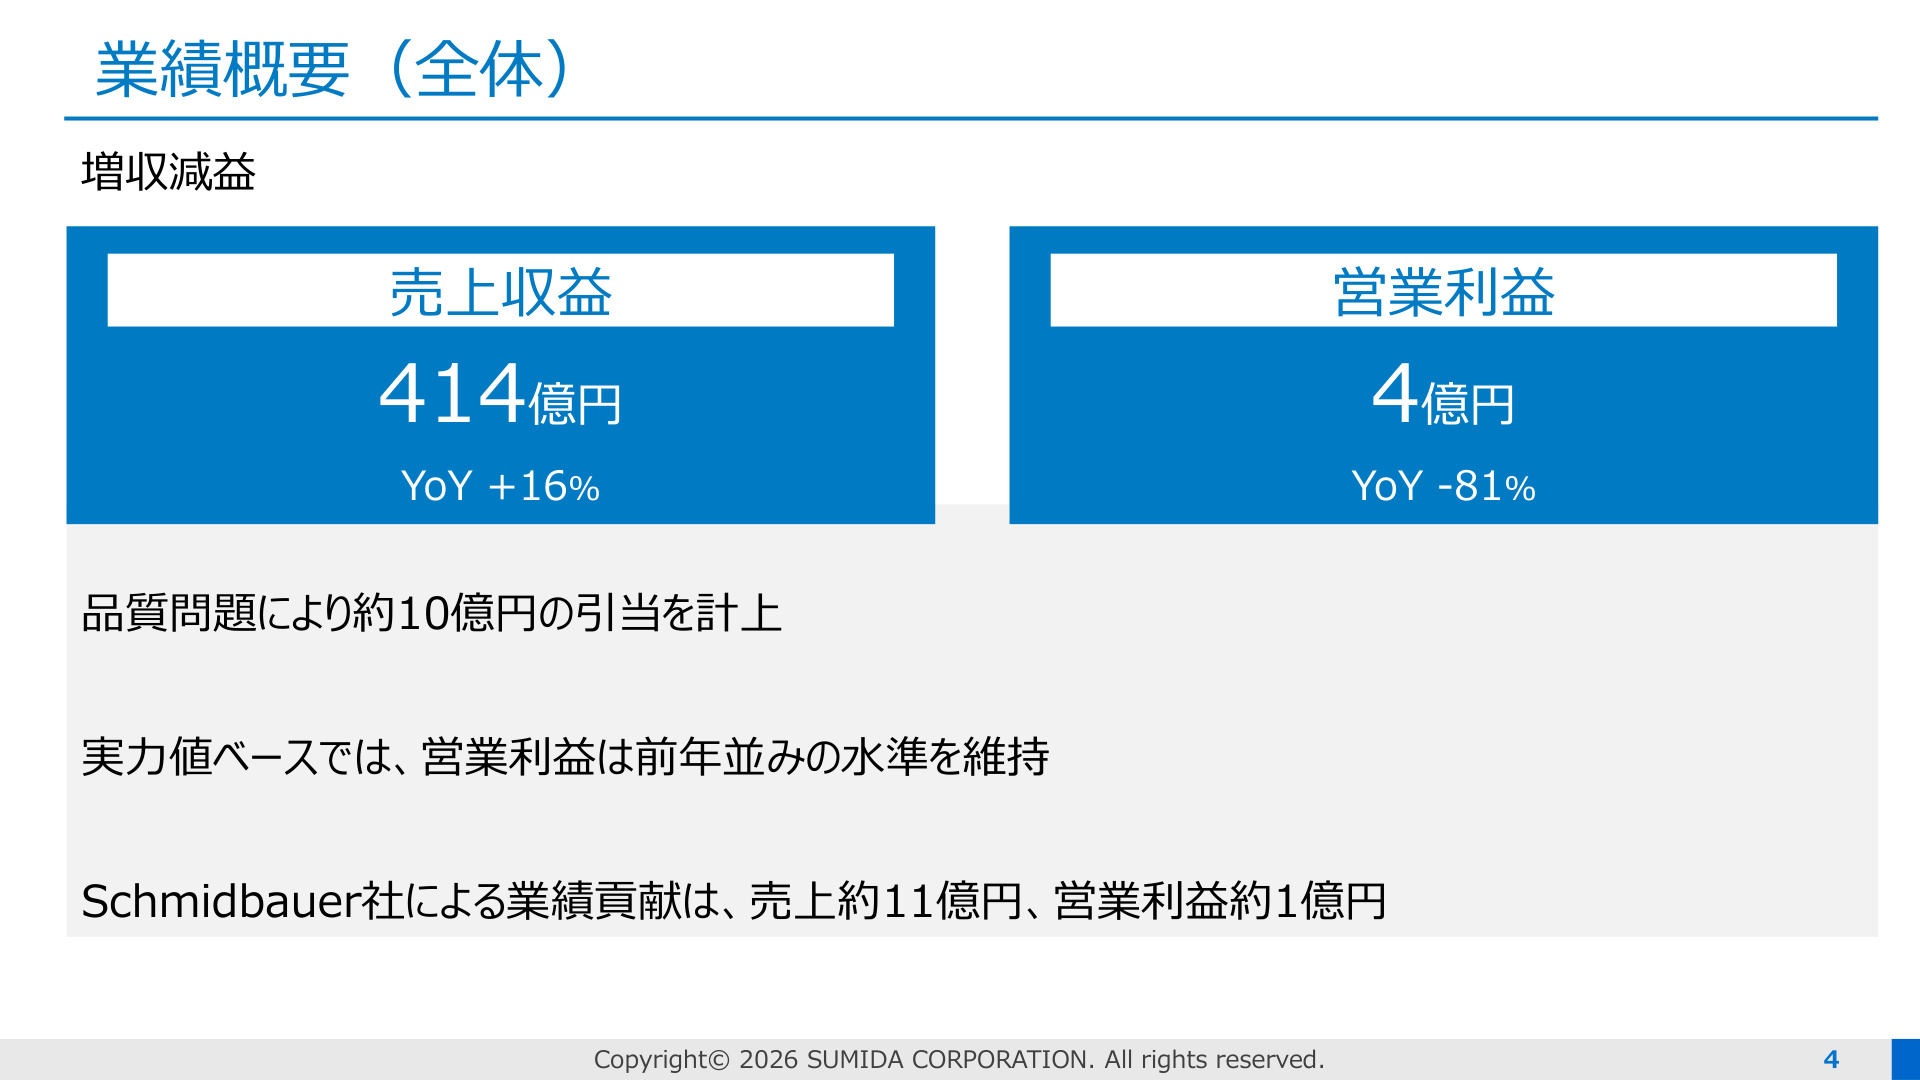
Slide Commentary: Overview of Earnings
The slide above () outlines the core of the company's Q2 performance. While revenue reached ¥41.4 billion (up 16% YoY) , marking double-digit growth, operating profit dropped sharply to ¥400 million (down 81% YoY) . This was primarily due to a one-time product compensation provision of approximately ¥1 billion related to quality issues in certain automotive products.
Crucially, this ¥1 billion provision covers inventory disposal, sorting, and future estimates. It is noted that excluding this impact, the underlying operating profit would have remained at a level comparable to the previous year (approximately ¥1.4 billion to ¥1.5 billion) . Furthermore, the consolidation of the recently acquired Schmidbauer contributed a net increase of approximately ¥1.1 billion in revenue and ¥100 million in operating profit.
2. Analysis of Operating Profit Fluctuations: One-time Costs vs. Operational Improvements
A detailed breakdown of the decline in operating profit from ¥2.128 billion in the previous year to ¥401 million highlights the contrast between structural operational efforts and external/one-time factors.
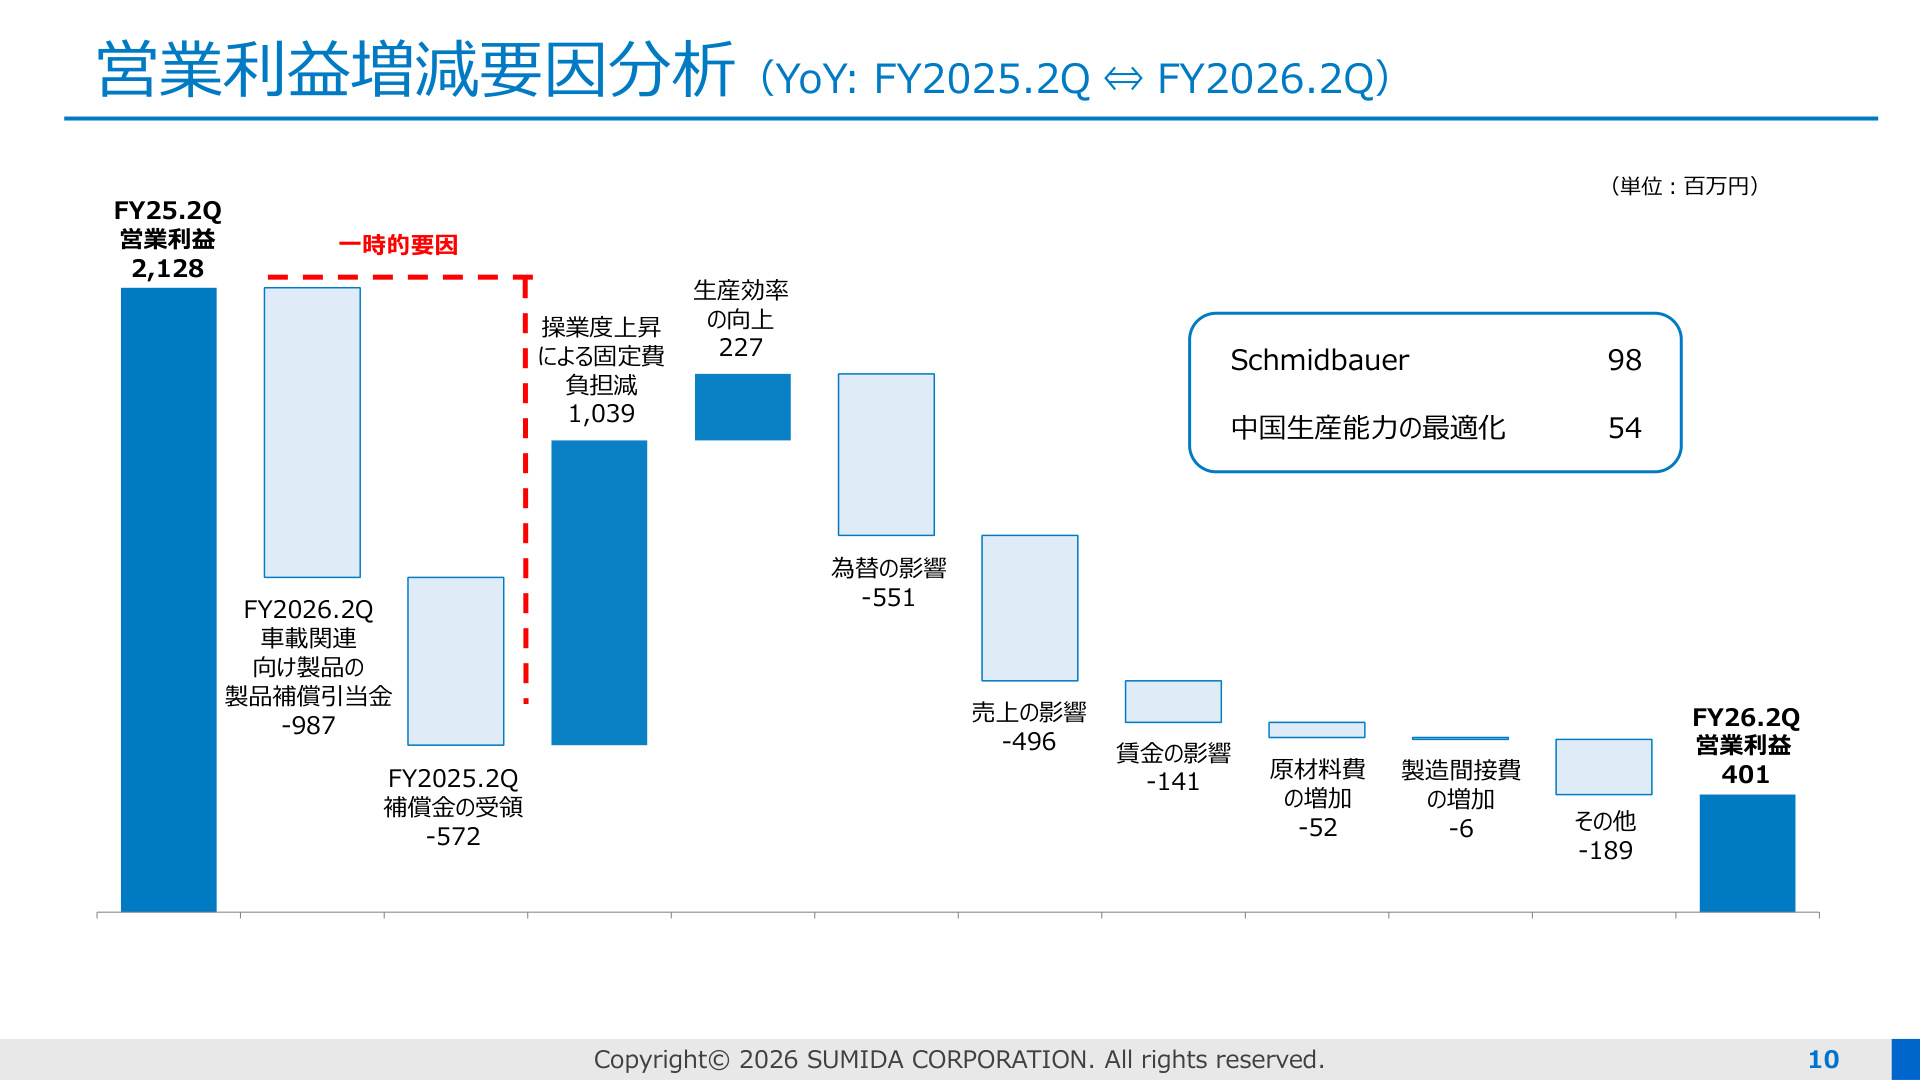
Slide Commentary: Analysis of YoY Operating Profit Changes
The waterfall chart in the slide above () details the profit transition from the same period last year.
-
One-time Costs and Non-recurring Factors (Negative Impact) :
- Product compensation provision for automotive products : -¥987 million
- Reversal of compensation received in the previous year : -¥572 million
- These special factors combined for a negative impact of approximately ¥1.56 billion .
-
Operational Gains (Positive Impact) :
- Reduced fixed cost burden due to higher capacity utilization : +¥1.039 billion
- Improved production efficiency : +¥227 million
- Contribution from Schmidbauer consolidation : +¥98 million
- Optimization of production capacity in China : +¥54 million
- Higher factory utilization and continuous production improvement activities generated over ¥1.4 billion in substantive profit improvements .
-
External Factors (Negative Impact) :
- Foreign exchange impact : -¥551 million
- Changes in sales mix/volume impact : -¥496 million
- Impact of wage increases : -¥141 million
In conclusion, the operating profit decline is primarily attributed to the one-time quality provision and the absence of last year's special gains. The cost performance and operational capacity of the manufacturing floor remain robust and are continuing to expand.
3. Regional/Market Trends and Expansion of Megatrend-related Revenue
Looking at sales trends by business segment and region, the company's focus on "Megatrend-related sectors" is a powerful driver of overall growth.
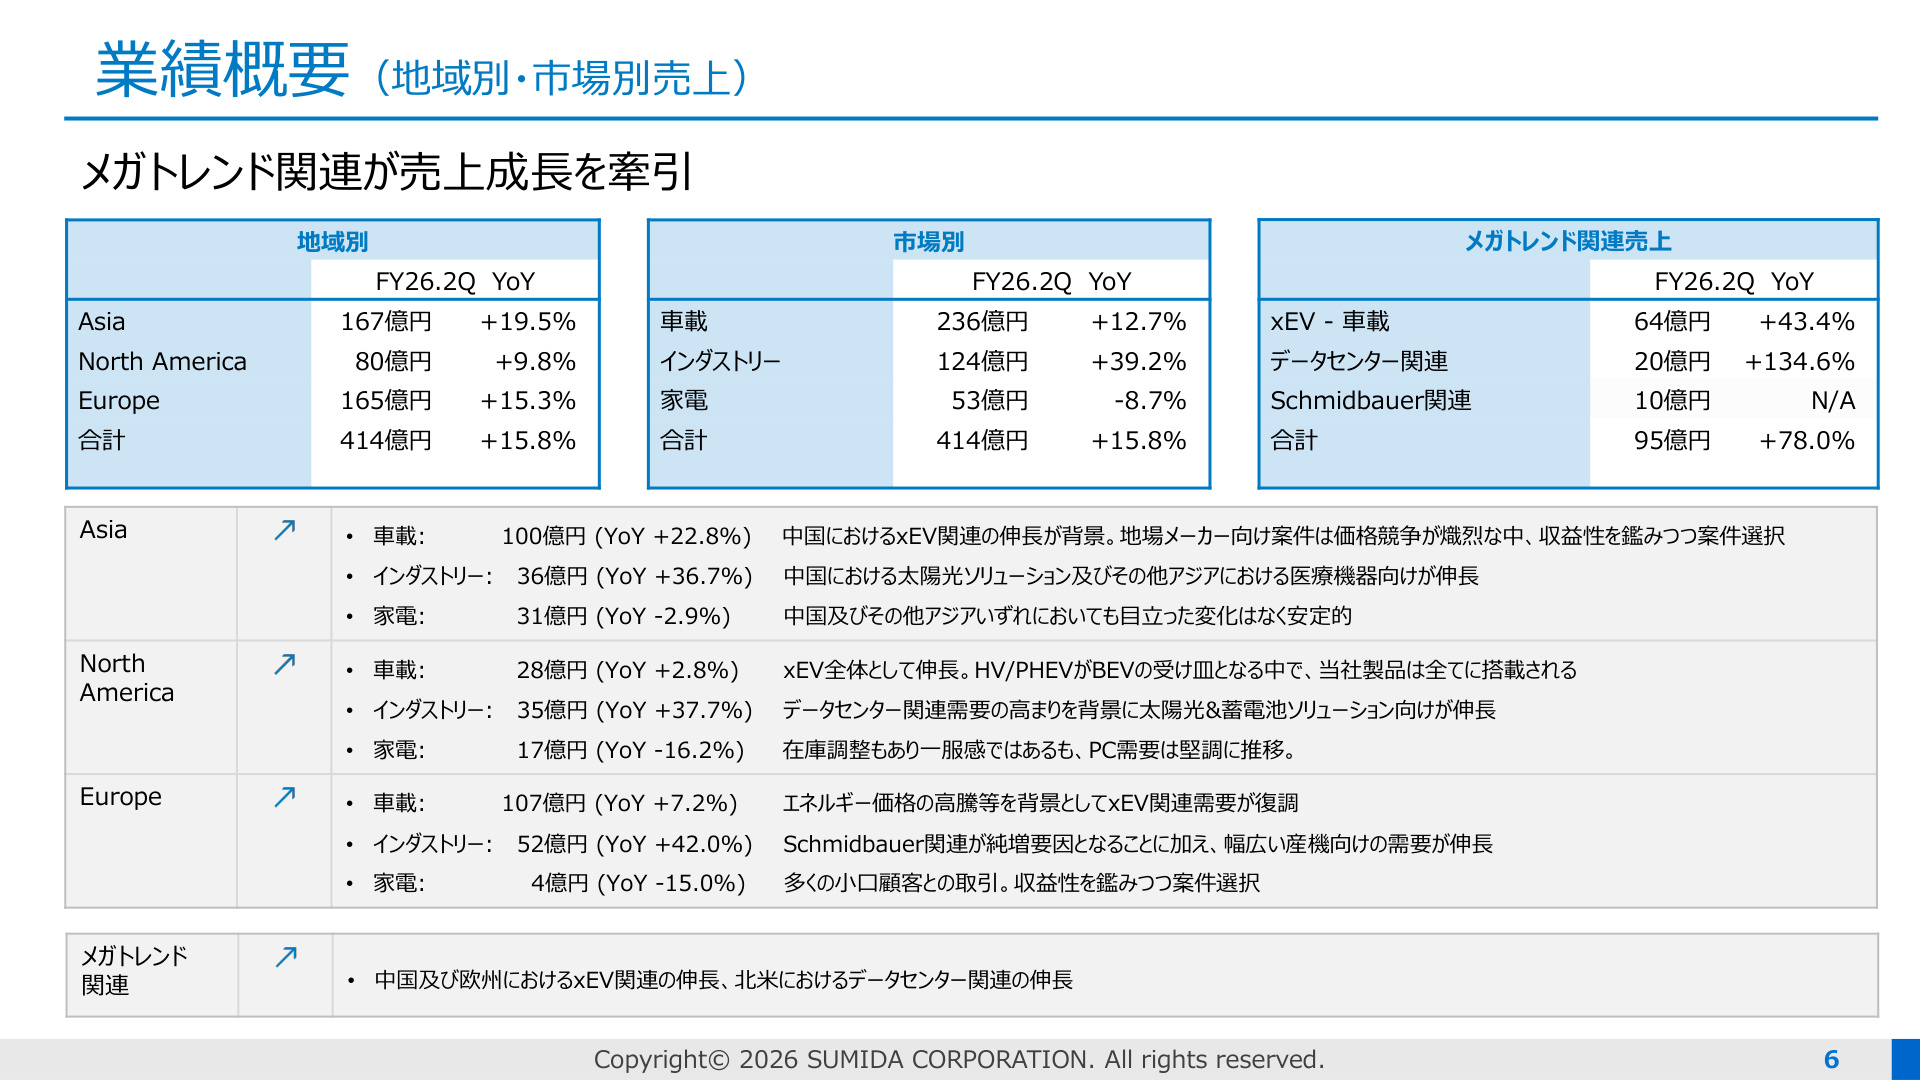
Slide Commentary: Revenue Growth Driven by Megatrends
The slide above () summarizes revenue composition and growth rates by region, market, and megatrend.
[Regional Trends]
- Asia : ¥16.7 billion (+19.5% YoY)
- Driven by xEV-related growth in China. Despite intense price competition, the company is selectively pursuing projects. Industrial and medical equipment sectors also grew.
- North America : ¥8.0 billion (+9.8% YoY)
- Significant expansion in solar and battery storage solutions, fueled by rapidly rising demand for data centers.
- Europe : ¥16.5 billion (+15.3% YoY)
- xEV demand is recovering amid high energy prices. In addition to the Schmidbauer contribution, demand for a wide range of industrial equipment increased.
[Market Trends]
- Automotive Market : ¥23.6 billion (+12.7% YoY)
- Industrial Market : ¥12.4 billion (+39.2% YoY)
- Home Appliance Market : ¥5.3 billion (-8.7% YoY)
[Breakdown of Megatrend-related Revenue (Total ¥9.5 billion / +78.0% YoY)]
Particularly noteworthy is the overwhelming growth in the megatrend sector:
- xEV - Automotive : ¥6.4 billion (+43.4% YoY)
- Data Center-related : ¥2.0 billion (+134.6% YoY)
- Schmidbauer-related : ¥1.0 billion (New addition)
Demand for high-efficiency power modules for xEVs and data centers (driven by AI and cloud adoption) is surging, confirming that the company's portfolio shift is bearing fruit.
4. Rebuilding Quality Assurance and Growth Strategy
In response to the quality issues that led to the one-time provision, the company is restructuring its governance and technical approach.
Rebuilding Quality Assurance
- Strengthening the "Three Actuals" principle (Genba, Genbutsu, Genjitsu) to enhance early risk detection and correction.
- Advancing technical standards and training technical personnel to improve design and manufacturing quality.
- Systematizing quality and technical data to enhance predictive maintenance and prevention.
The issue is limited to specific products, and it has been confirmed that there is no impact on other product lines.
Long-term Growth Drivers and Strategic Partnerships
- Joint Development with Infineon (Germany) :
- Announced joint development of Solid-State Transformers (SST) , a next-generation power conversion system.
- Combining Infineon’s power semiconductor technology (3.3kV CoolSiC™) with Sumida’s core materials, winding, thermal optimization, and insulation technologies.
- Aiming to enter high-growth markets such as AI data centers, smart grids, and megawatt charging stations to establish a position as a key player in next-gen energy infrastructure.
- New Project Wins :
- In 2025, the company secured approximately ¥88 billion in new projects (lifetime revenue basis: ¥43 billion automotive, ¥33 billion industrial, ¥11 billion home appliances), ensuring a solid foundation for long-term revenue.
5. Financial Position, Cash Flow, and Shareholder Returns
The company maintains appropriate liquidity and financial health.
Financial Position (as of June 30, 2026)
- Total Assets : ¥169.005 billion (+¥5.348 billion from previous year-end)
- Interest-bearing Debt : ¥59.043 billion (+¥2.662 billion from previous year-end)
- Net D/E Ratio : 0.83x (Stable from 0.81x at previous year-end)
- Current Ratio : 1.19 (Maintaining a healthy level)
Cash Flow (Cumulative Q2)
- Operating Cash Flow : ¥5.177 billion generated (vs. ¥5.95 billion in the same period last year)
- Free Cash Flow : ¥1.95 billion surplus secured (after ¥2.818 billion in capital expenditure)
Shareholder Returns (Dividends)
- FY2026 Interim Dividend : ¥26.0 per share , as initially planned.
- Annual Dividend Forecast : Maintained at ¥53.0 per share (Expected DOE 2.8%).
Despite the one-time loss, the company has clearly demonstrated its commitment to its initial shareholder return policy , supported by its operating cash flow generation and financial foundation.
6. Summary
Sumida Corporation’s FY2026 Q2 results included a one-time negative impact of approximately ¥1 billion in quality-related provisions . However, the results also confirmed double-digit revenue growth (+15.8%) supported by megatrend markets (xEV/Data Centers) and the maintenance of underlying profitability through increased factory utilization .
Moving forward, the company is expected to enhance corporate value over the long term by steadily strengthening its quality assurance system, advancing next-generation technology development with Infineon, and capturing high-growth demand in the industrial and data center sectors.
This content is not intended as investment advice or a recommendation. Any opinions expressed are solely the personal views of each article.