


Renesas Electronics Q2 FY2026 Earnings Deep Dive: Revenue Surpasses ¥400 Billion, Driven by Industrial, Infrastructure, and IoT Growth

StockClub
Published: Jul 31, 2026, 10:24 AM
Sentiment Analysis

Renesas Electronics Q2 FY2026 Earnings Deep Dive
Renesas Electronics Corporation (TSE: 6723) has announced its financial results for the second quarter of the fiscal year ending December 2026 (April–June 2026). The results show a significant increase in revenue both year-on-year and quarter-on-quarter , exceeding the company's previously announced guidance range. Notably, the Industrial, Infrastructure, and IoT business segment demonstrated robust growth of +40.0% year-on-year , serving as a powerful catalyst for the company's overall performance expansion.
This report provides a comprehensive analysis of the published PDF materials, broken down into 10 key topics. We cover everything from the overall financial picture and segment-specific performance to inventory trends, capacity utilization, structural reforms regarding the Takasaki factory closure, and the future business outlook.
1. Q2 FY2026 Financial Highlights (Non-GAAP)
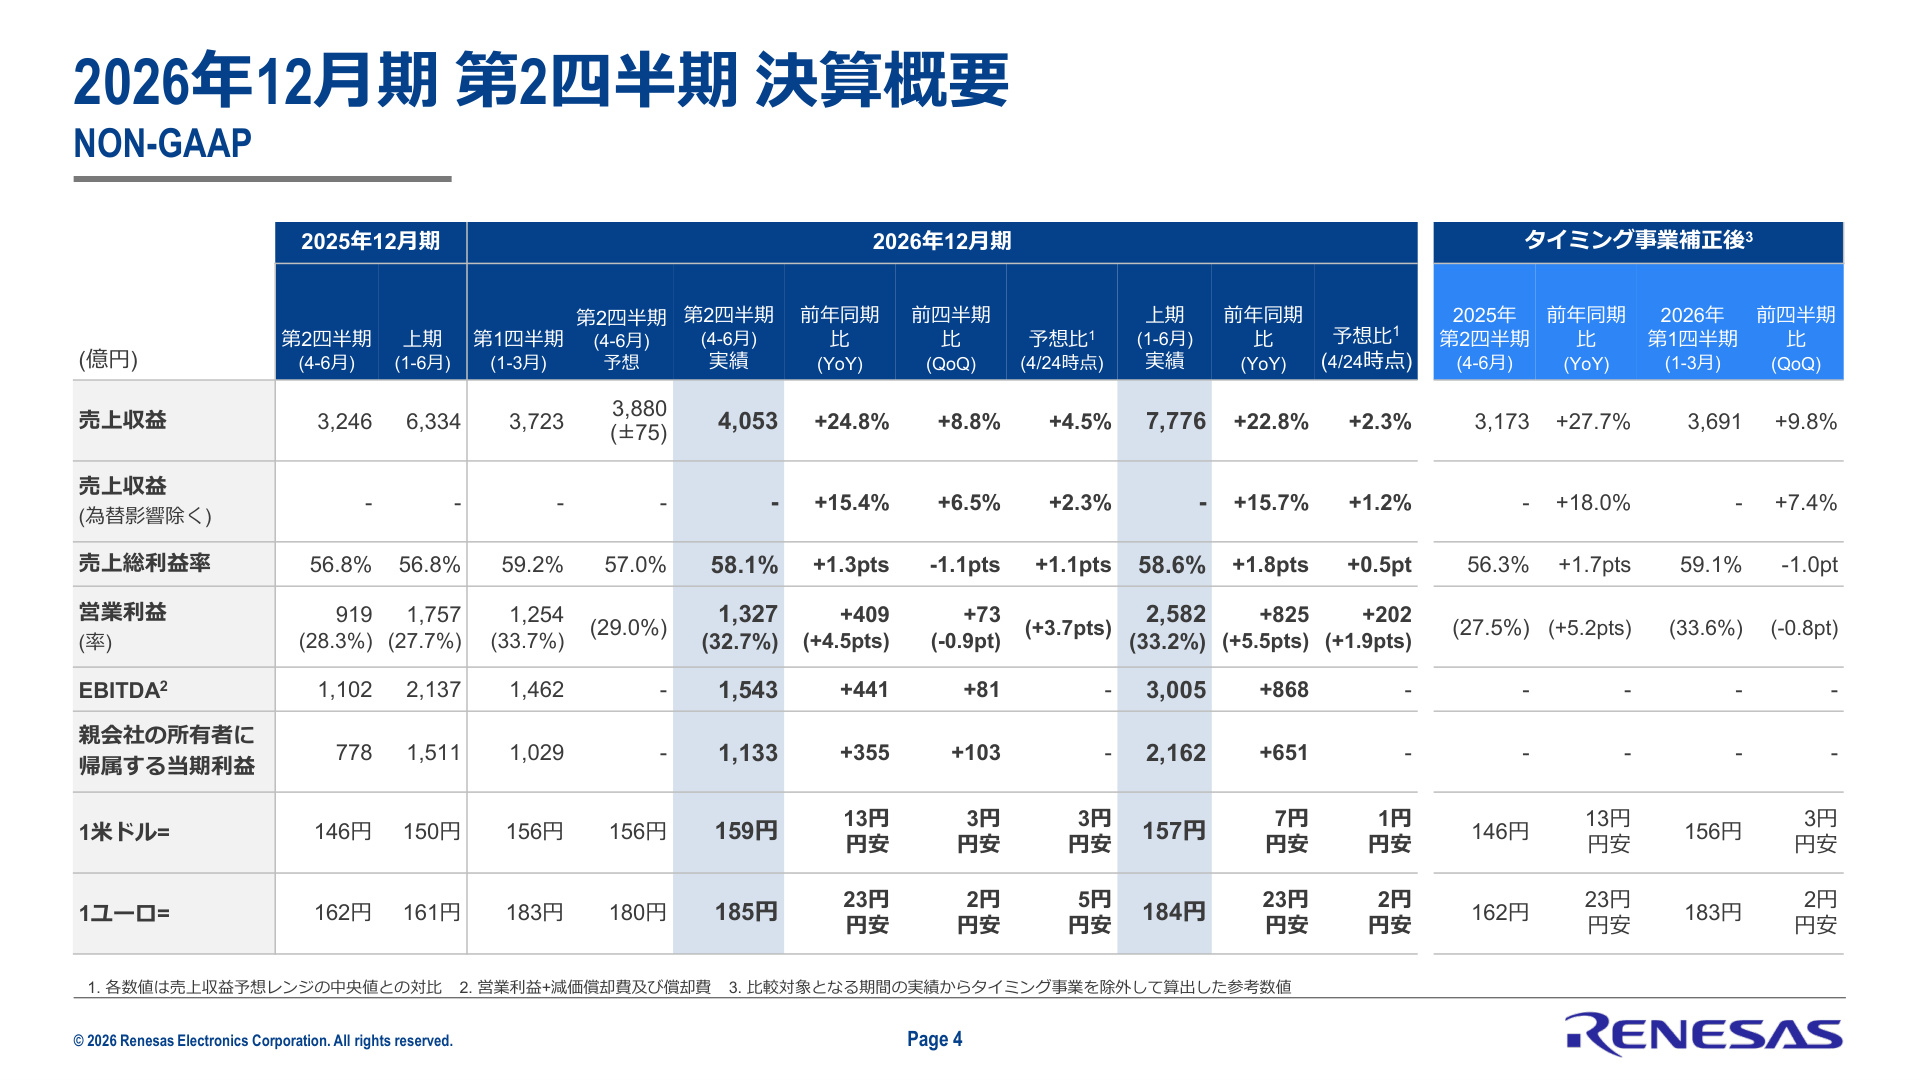
In the second quarter (April–June), Renesas recorded high growth rates in both revenue and profit. Revenue reached ¥405.3 billion (+24.8% YoY, +8.8% QoQ) , surpassing the median company forecast (¥388 billion) by 4.5% .
In terms of profitability, the gross margin was 58.1% (+1.1 points vs. forecast) and the operating margin was 32.7% (+3.7 points vs. forecast), with gross profit reaching ¥132.7 billion (+¥40.9 billion, +44.5% YoY) .
[Why this slide is important]
The slide above (Page 4) provides the most fundamental and critical data for an overview of the consolidated Non-GAAP performance. It covers comparisons with the same period last year (YoY) and the previous quarter (QoQ), as well as deviations from company forecasts.
Beyond the revenue-boosting effect of a weaker yen , the background to these figures includes improved product mix toward high-margin products and manufacturing cost reduction efforts that supported profit margins. While the exchange rate environment—¥159 to the US dollar (a ¥13 depreciation YoY) and ¥185 to the euro (a ¥23 depreciation YoY)—contributed positively, the high operating margin of over 30% is fundamentally supported by volume growth and an improved business structure.
2. Quarterly Revenue Trends and Growth Momentum
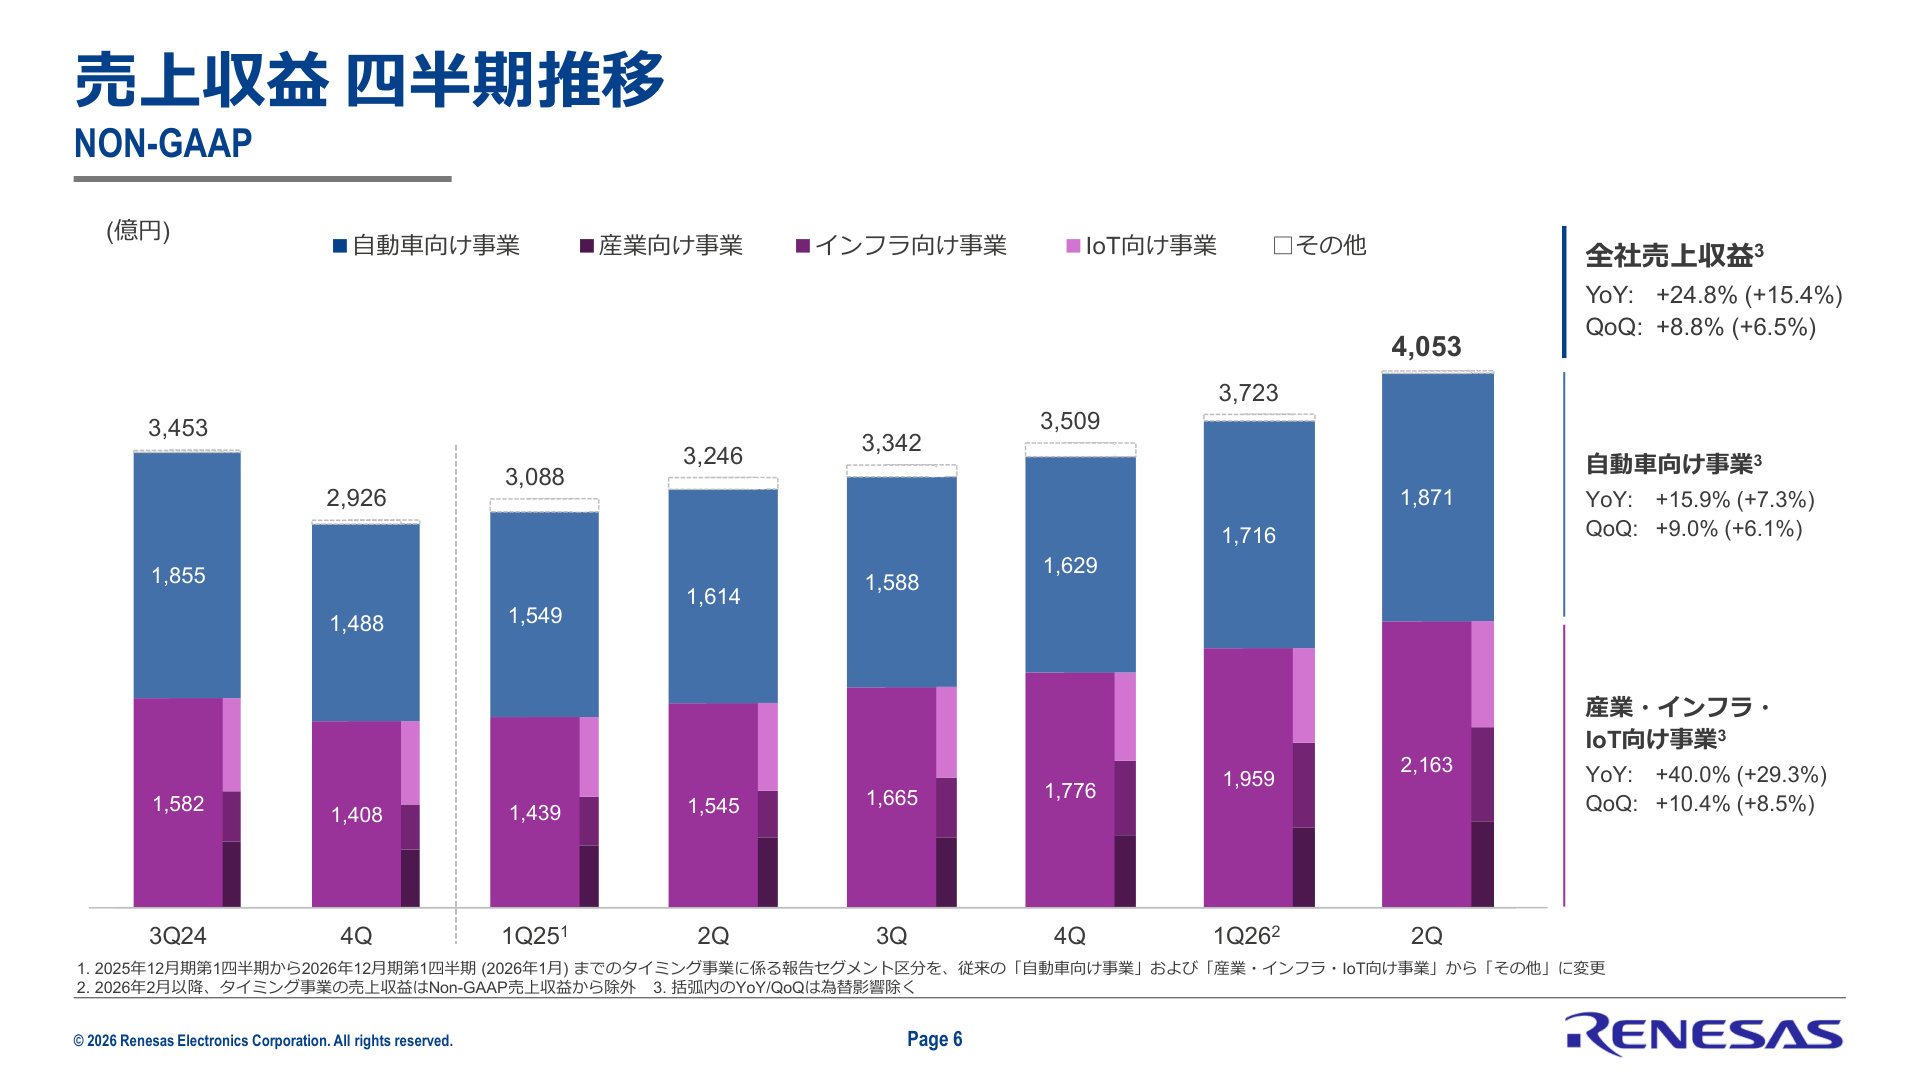
Looking at quarterly revenue trends, one can observe a clear shift from the bottoming out of the semiconductor market to a phase of recovery and expansion. From a low of ¥308.8 billion in Q1 FY2025, revenue has maintained an upward trend for five consecutive quarters .
[Why this slide is important]
The slide above (Page 6) visualizes quarterly revenue from Q3 2024 to Q2 2026, broken down by the two main segments: "Automotive" and "Industrial, Infrastructure, and IoT."
The key takeaway from this graph is that the recent surge in revenue is driven by the rapid recovery of the Industrial, Infrastructure, and IoT business . Even on a real basis excluding exchange rate effects (figures in parentheses), total company revenue recorded strong growth of +15.4% YoY and +6.5% QoQ , proving that the demand recovery is driven by core business strength rather than temporary currency fluctuations.
3. Segment Performance Analysis
The trends for the two core segments supporting Renesas' performance are as follows:
[Why this slide is important]
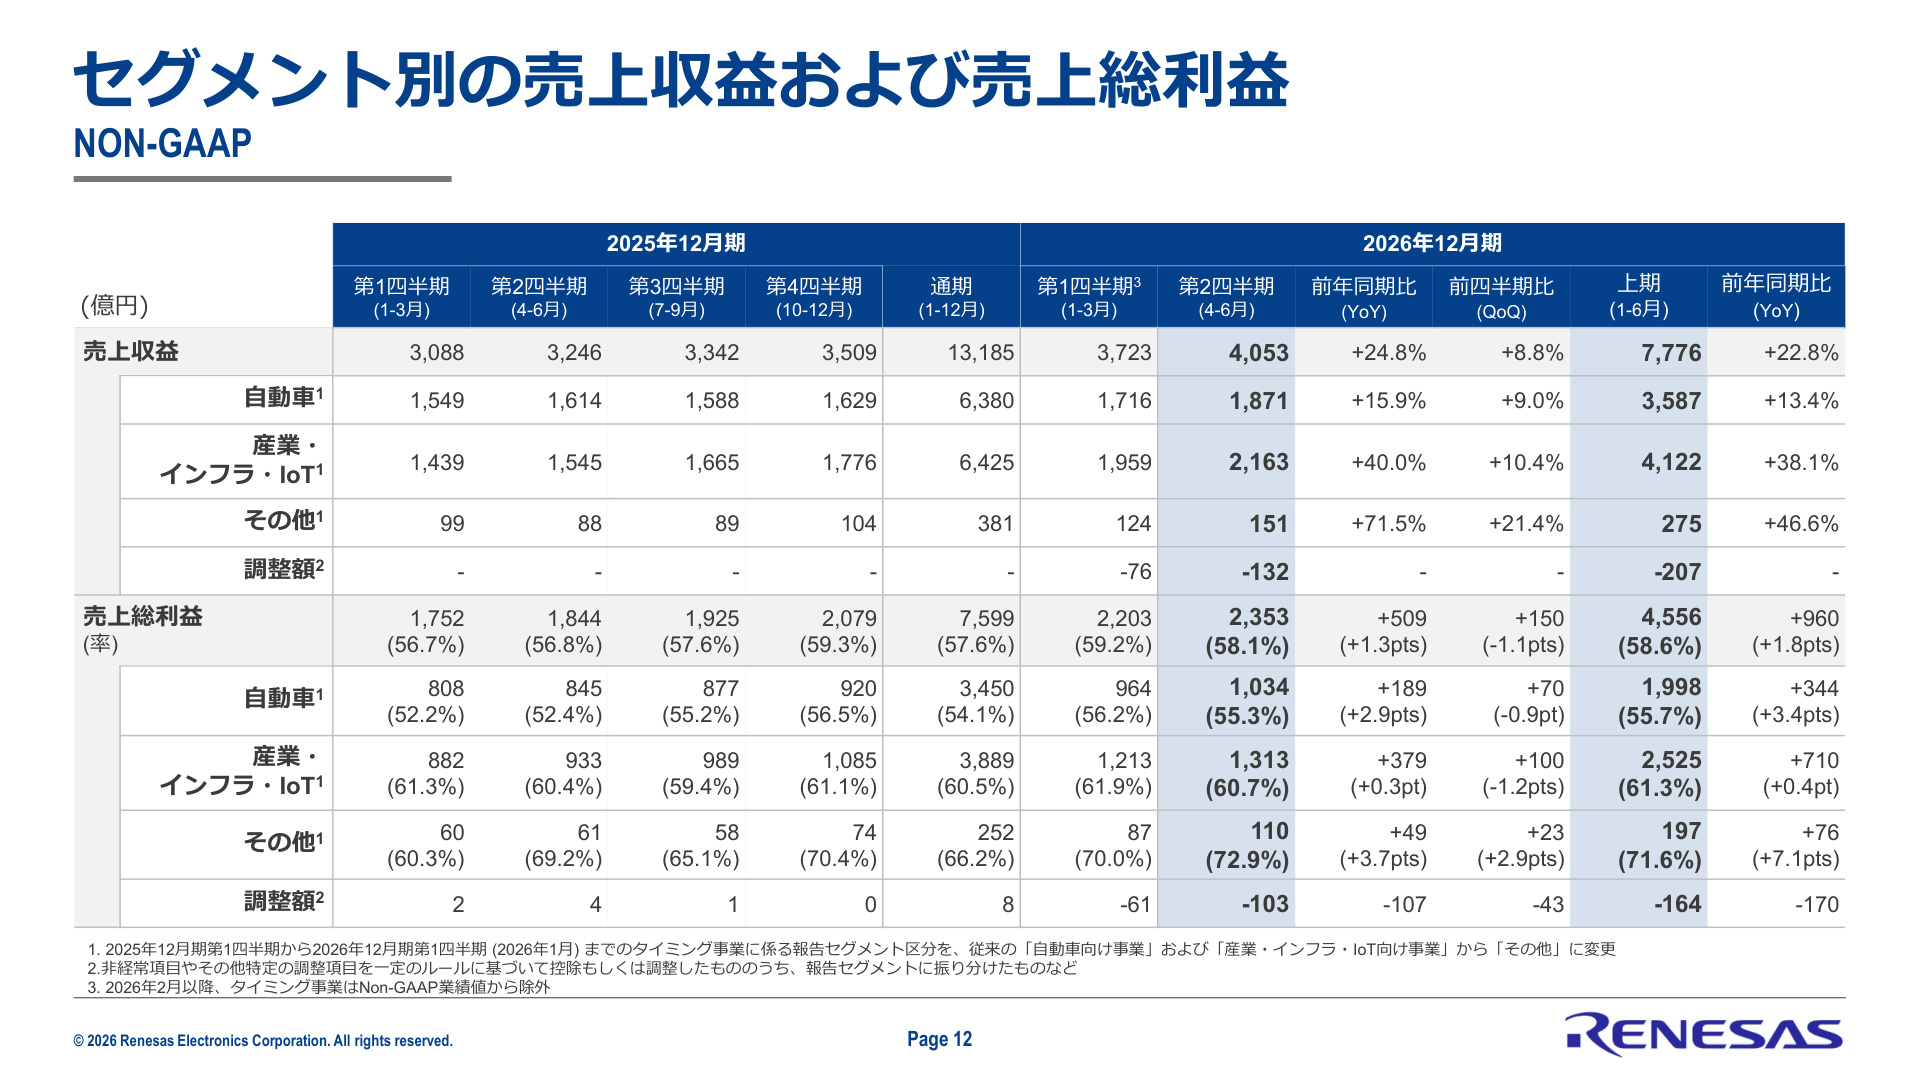
The slide above (Page 12) provides a detailed breakdown of revenue and gross profit fluctuations by segment. It is essential for structurally understanding the sources of the company's earning power.
① Industrial, Infrastructure, and IoT Business
- Revenue : ¥216.3 billion (+40.0% YoY, +10.4% QoQ)
- Gross Margin : 60.7% (+0.3 points YoY)
- Operating Profit : ¥69.0 billion (Operating Margin 31.9%)
Driven by increased demand for analog ICs and power semiconductors for data centers, as well as the recovery of industrial IoT equipment, this segment has made a significant leap forward, acting as the main engine accounting for more than half of total company revenue . With a gross margin exceeding 60%, its contribution as a high-profit segment is remarkable.
② Automotive Business
- Revenue : ¥187.1 billion (+15.9% YoY, +9.0% QoQ)
- Gross Margin : 55.3% (+2.9 points YoY)
- Operating Profit : ¥64.4 billion (Operating Margin 34.4%)
Demand for automotive domain control MCUs and power ICs for ECUs remained solid. The operating margin improved significantly by +11.1 points YoY, demonstrating excellent profitability (34.4% operating margin) in the automotive business as well .
4. Inventory Status and Channel Control
Inventory metrics (internal inventory and sales channel inventory), which are closely watched as leading indicators for semiconductor manufacturers, are being appropriately controlled.
- Days of Inventory (DOI) : While the inventory value increased in Q2 due to higher work-in-progress, the turnover days are being controlled within an appropriate range in line with revenue expansion.
- Weeks of Inventory (WOI) : As a result of very strong sell-through (actual demand) in both the Automotive and Industrial/Infrastructure/IoT segments, WOI showed a slight decrease (trending toward optimization) compared to the previous quarter, despite ongoing inventory replenishment to channels.
For Q3, the company plans to continue expanding finished goods and die bank inventory to meet robust market demand.
5. Front-end Utilization and CapEx Trends
On the production side, front-end utilization rates are being gradually increased in line with the recovery in demand. In particular, the increase in utilization of the 12-inch lines is notable, and the absorption of fixed manufacturing costs has contributed to the maintenance and improvement of gross margins.
Regarding Capital Expenditure (CapEx), after a temporary peak in Q1 (¥94 billion), it returned to normal investment discipline in Q2 at ¥22.6 billion (5.6% of revenue) . This demonstrates a commitment to avoiding unnecessary capacity expansion while focusing resources on advanced processes and high-efficiency lines.
6. Structural Reform: Phased Closure of Takasaki Factory and R&D Enhancement
As a key decision for mid-to-long-term profitability improvement and production system optimization, the phased production termination of the Takasaki factory was announced (Page 18).
- Background : To address structural environmental changes, including the aging of the 6-inch line, the end of maintenance support for manufacturing equipment and utilities, and the discontinuation of production material supplies.
- Plan : Production is scheduled to be phased out over the next 2–3 years , leading to the factory's closure.
- Maintenance of R&D Functions : The company plans to maintain and strengthen the technical capabilities and R&D functions currently housed at the Takasaki factory (analog ICs and power semiconductors for data centers and automotive) by keeping them at the current or nearby locations.
- Personnel Considerations : The basic policy is to maintain and secure employment, providing maximum support for career transitions and reassignments.
By phasing out the aging small-diameter (6-inch) line and shifting resources to high-efficiency production lines such as 12-inch, further improvements in gross margins are expected in the future.
7. Disaster Response: Impact of the Kumamoto Earthquake (As of July 30)
The impact of the "Reiwa 8 Kumamoto Earthquake" that occurred in July 2026 and the company's response have been reported (Page 19).
- Human Impact : Safety of all employees has been confirmed; no human casualties .
- Kawashiri Factory (Kumamoto City, Front-end site) : Safety checks in the cleanroom are complete, and impact assessments on equipment and work-in-progress are underway. Production is scheduled to resume sequentially from August 5 .
- Nishiki Factory (Kuma District, Back-end site) : Safety checks in the cleanroom are complete, and production resumed sequentially from the night of July 29 .
Through the rapid activation of the Business Continuity Plan (BCP), a system is in place to minimize the impact on the supply chain.
8. Q3 FY2026 Earnings Forecast
The Non-GAAP earnings forecast for the third quarter of FY2026 (July–September) sets ambitious targets reflecting solid market demand.
- Revenue : ¥430 billion ±¥7.5 billion (+28.7% YoY, +6.1% QoQ)
- Gross Margin : 57.5% (-0.1pt YoY, -0.6pt QoQ)
- Operating Margin : 32.5% (+1.6pt YoY, -0.2pt QoQ)
- Assumed Exchange Rates : 1 USD = ¥159, 1 EUR = ¥184
For Q3, the company expects revenue of approximately ¥430 billion and plans to maintain high profitability with an operating margin of 32.5% . Regarding exchange rate sensitivity, it was disclosed that a ¥1 fluctuation in the US dollar impacts Q3 revenue by approximately ¥2 billion and operating profit by approximately ¥900 million.
9. Strengthening Financial Health and Cash Flow
A review of the GAAP-based balance sheet (Page 14) shows further tightening and strengthening of the financial structure.
- Cash and Cash Equivalents : ¥376 billion (up from ¥295.9 billion at the end of December 2025)
- Net D/E Ratio : 0.28x (improved from 0.38x at the end of December 2025)
- Net Leverage Ratio : 1.5x (down from 2.0x at the end of December 2025)
By steadily repaying interest-bearing debt from past large-scale M&As while accumulating cash on hand, the equity ratio (equity attributable to owners of the parent) has risen to 62.5% , further increasing financial flexibility.
10. Progress Toward Long-Term Vision: "2035 Aspiration"
Renesas has established the "2035 Aspiration" (targeting a 6x increase in market capitalization) as its long-term vision (Page 20).
- Execution of Mid-term Plan : Organic revenue growth through MCU (share expansion), Analog & Power (portfolio expansion), and SoC strengthening.
- Closing the Valuation Gap : Achieving appropriate market valuation through improved capital efficiency and IR engagement.
- Multiple Expansion : Increasing valuation multiples in the stock market through transformation into a high-growth, high-profit business.
The Q2 FY2026 results confirm that the company is successfully balancing growth and profitability in the Industrial, Infrastructure, and IoT sectors in line with this long-term strategy.
Summary
In the second quarter of FY2026, Renesas Electronics achieved highly positive results, including surpassing ¥400 billion in revenue , reaching a high operating margin of 32.7% , and seeing strong growth in the Industrial, Infrastructure, and IoT sectors . The earnings report demonstrates the management's execution capabilities and the resilience of the business foundation, evidenced by structural reforms such as the closure of aging lines and a swift on-site response to the Kumamoto earthquake.
This content is not intended as investment advice or a recommendation. Any opinions expressed are solely the personal views of each article.