


TISI (3626) Q1 FY2027 Earnings Deep Dive: Robust Growth Trajectory Supported by Strong IT/SI Demand and Expanding Order Backlog

StockClub
Published: Jul 30, 2026, 09:57 AM
Sentiment Analysis
1. Executive Summary
TISI Corporation’s financial results for the first quarter of the fiscal year ending March 31, 2027 (April–June 2026) demonstrate a solid growth trajectory, successfully capturing the steady expansion in corporate demand for digital transformation (DX) and IT investment. The company reported year-on-year growth in both revenue and profit .
Revenue reached ¥150.111 billion (up 7.0% YoY) , while operating profit rose to ¥18.347 billion (up 12.2% YoY) . The operating profit margin improved to 12.2% (+0.5 percentage points YoY). Furthermore, net profit attributable to owners of the parent showed significant growth, reaching ¥14.009 billion (up 15.1% YoY) .
This report provides a multi-faceted analysis of the earnings highlights, revenue structure, segment performance, order environment, and full-year outlook based on the company's disclosures.
2. Q1 FY2027 Earnings Highlights and Profit Structure
The consolidated performance for the first quarter is summarized below. All key metrics—revenue, operating profit, and quarterly net profit—showed progress exceeding the same period of the previous year.
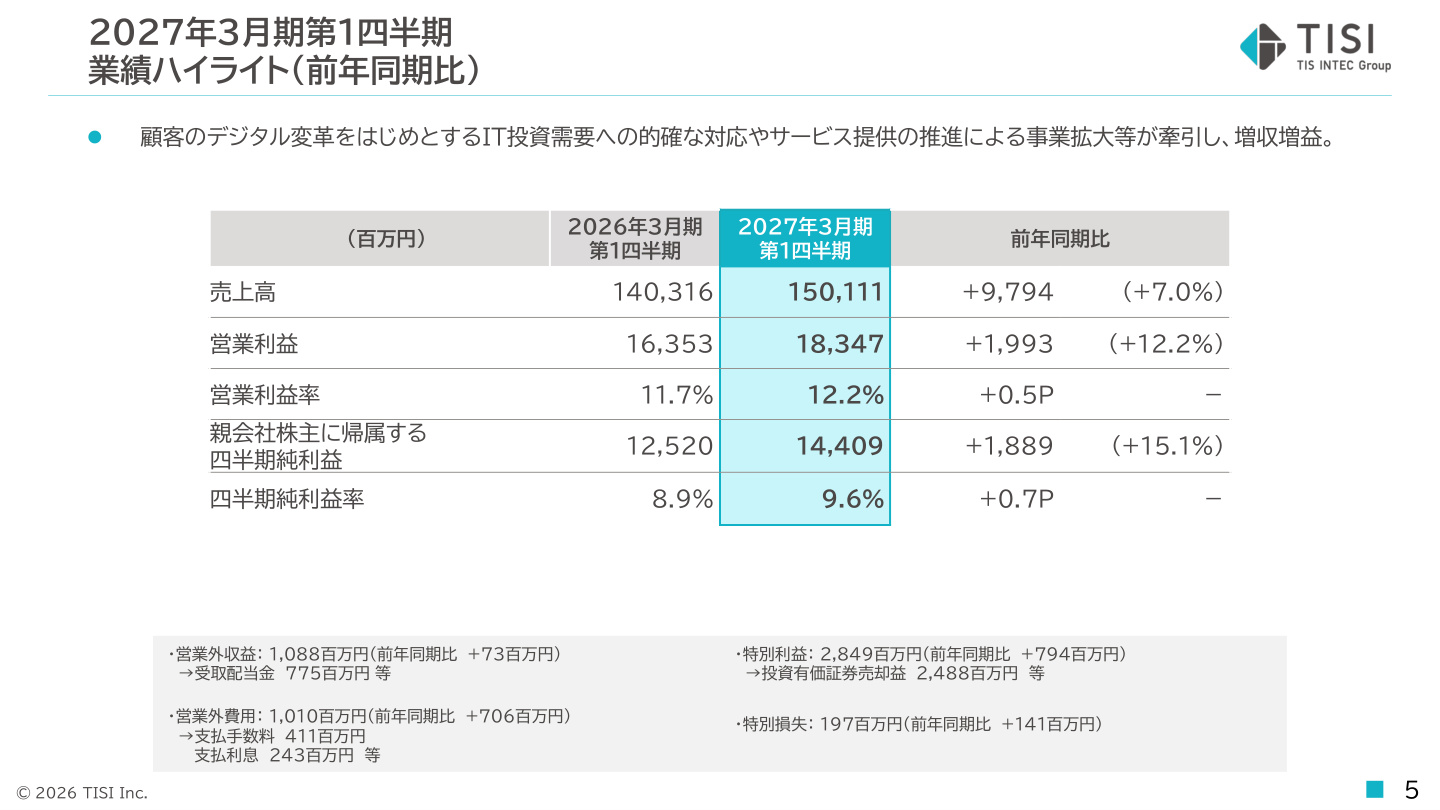
The slide above summarizes the earnings highlights for the first quarter. As indicated, revenue reached ¥150.111 billion (an increase of ¥9.794 billion, or +7.0% YoY) , reflecting success in capturing robust customer demand for IT investment, centered on digital transformation.
In terms of operating profit, the company recorded ¥18.347 billion (an increase of ¥1.993 billion, or +12.2% YoY) . With operating profit growing at a faster rate (12.2%) than revenue (7.0%), the operating profit margin reached 12.2% .
Additionally, aided by extraordinary income of ¥2.849 billion from the sale of investment securities, quarterly net profit reached ¥14.009 billion (an increase of ¥1.589 billion, or +15.1% YoY) . The quarterly net profit margin rose to 9.6% (+0.7 percentage points YoY), indicating a notable improvement in bottom-line profitability.
3. Analysis of Operating Profit Factors and Drivers of Profitability
Breaking down the fluctuations in operating profit reveals that both revenue growth and improved profitability contributed to the results.
- Revenue Growth Effect (+¥2.71 billion) : The increase in marginal profit resulting from higher revenue was the primary driver.
- Profitability Improvement (+¥0.11 billion) : Through the promotion of high-value-added projects, the gross profit margin improved to 27.6% (+0.1 percentage points YoY) . While the impact of unprofitable projects amounted to -¥0.13 billion , the company maintained and improved its overall high gross margin.
- Increase in SG&A Expenses (-¥0.84 billion) : SG&A expenses rose due to ongoing investments in human capital, R&D, and software, as well as a ¥1.0 billion increase in compensation-related investments (talent acquisition and treatment improvement) compared to the same period last year. Specifically, growth investments in SG&A accounted for +¥0.1 billion, policy promotion expenses for +¥0.41 billion, and merger-related costs for +¥0.19 billion.
The structure of absorbing cost increases—such as personnel expenses—through revenue growth and improved gross margins to achieve an operating profit increase of ¥1.99 billion demonstrates that efforts to secure high-quality projects and improve productivity are progressing smoothly.
4. Revenue Trends by Customer Industry
An analysis of revenue by customer industry shows that the financial sector, specific segments within the industrial sector, and the public sector are driving overall performance.
- Financial Sector (35.8% of revenue) :
- Cards : ¥25.397 billion (+8.5% YoY)
- Banks, etc. : ¥13.136 billion (+11.0% YoY)
- Insurance : ¥8.925 billion (+10.1% YoY)
- System renewal investments related to modernization and the promotion of cashless payments remain strong across financial institutions.
- Industrial Sector (54.6% of revenue) :
- Assembly Manufacturing : ¥14.8 billion (+18.5% YoY), recording high growth.
- Services : ¥43.983 billion (+3.8% YoY), forming a stable foundation.
- Process Manufacturing : ¥13.174 billion (-2.6% YoY), showing a slight decline in some areas.
- Public Sector (7.1% of revenue) :
- Public : ¥10.681 billion (+14.8% YoY), showing strong growth.
5. Performance by Key Segment
The performance of each business segment in the first quarter is as follows:
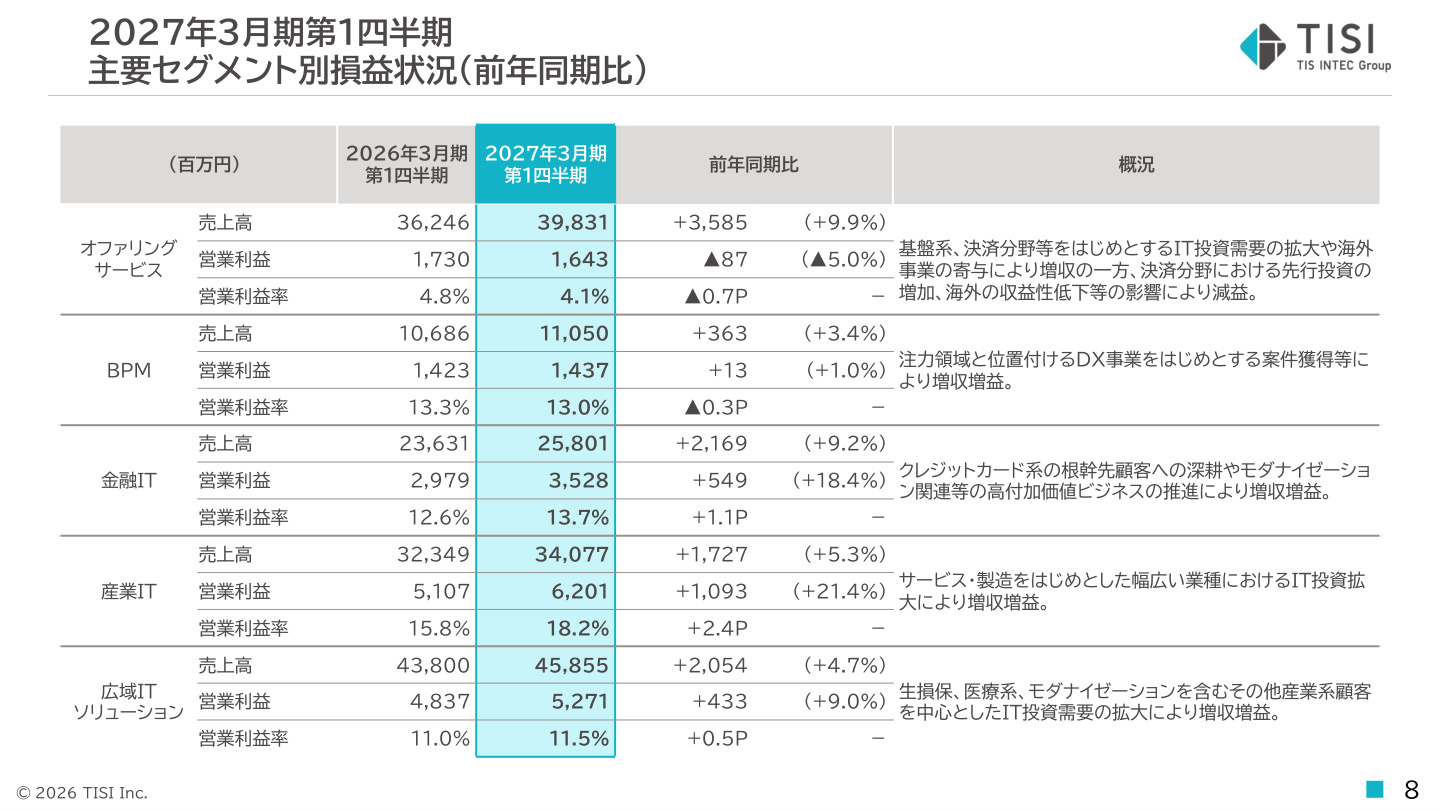
The slide above lists the profit and loss status by key segment, providing critical data for understanding the dynamics of the revenue structure for each business.
- Offering Services :
- Revenue: ¥39.831 billion (+9.9% YoY)
- Operating Profit: ¥1.643 billion (-5.0% YoY) (Operating margin: 4.1%)
- Overview : While revenue increased due to expanding IT investment demand in infrastructure and payment fields, as well as contributions from overseas business, profit declined due to increased upfront investment in the payment field and lower profitability in some overseas operations.
- BPM (Business Process Management) :
- Revenue: ¥11.050 billion (+3.4% YoY)
- Operating Profit: ¥1.437 billion (+1.0% YoY) (Operating margin: 13.0%)
- Overview : The company maintained growth in both revenue and profit, driven by project acquisition centered on the focus area of DX business.
- Financial IT :
- Revenue: ¥25.801 billion (+9.2% YoY)
- Operating Profit: ¥3.528 billion (+18.4% YoY) (Operating margin: 13.7%)
- Overview : Deepening relationships with core credit card clients and high-value-added business related to system modernization proved successful, leading to a significant profit increase (+18.4%).
- Industrial IT :
- Revenue: ¥34.077 billion (+5.3% YoY)
- Operating Profit: ¥6.201 billion (+21.4% YoY) (Operating margin: 18.2%)
- Overview : The company captured expanding IT investment across a wide range of industries, including services and manufacturing, achieving high profitability with an operating margin of 18.2%.
- Wide-Area IT Solutions :
- Revenue: ¥45.855 billion (+4.7% YoY)
- Operating Profit: ¥5.271 billion (+9.0% YoY) (Operating margin: 11.5%)
- Overview : Demand is expanding, centered on life/non-life insurance, medical, and modernization projects.
6. Order Environment and Future Revenue Backing (Orders Received and Order Backlog)
Order trends serve as a highly visible leading indicator for future performance.
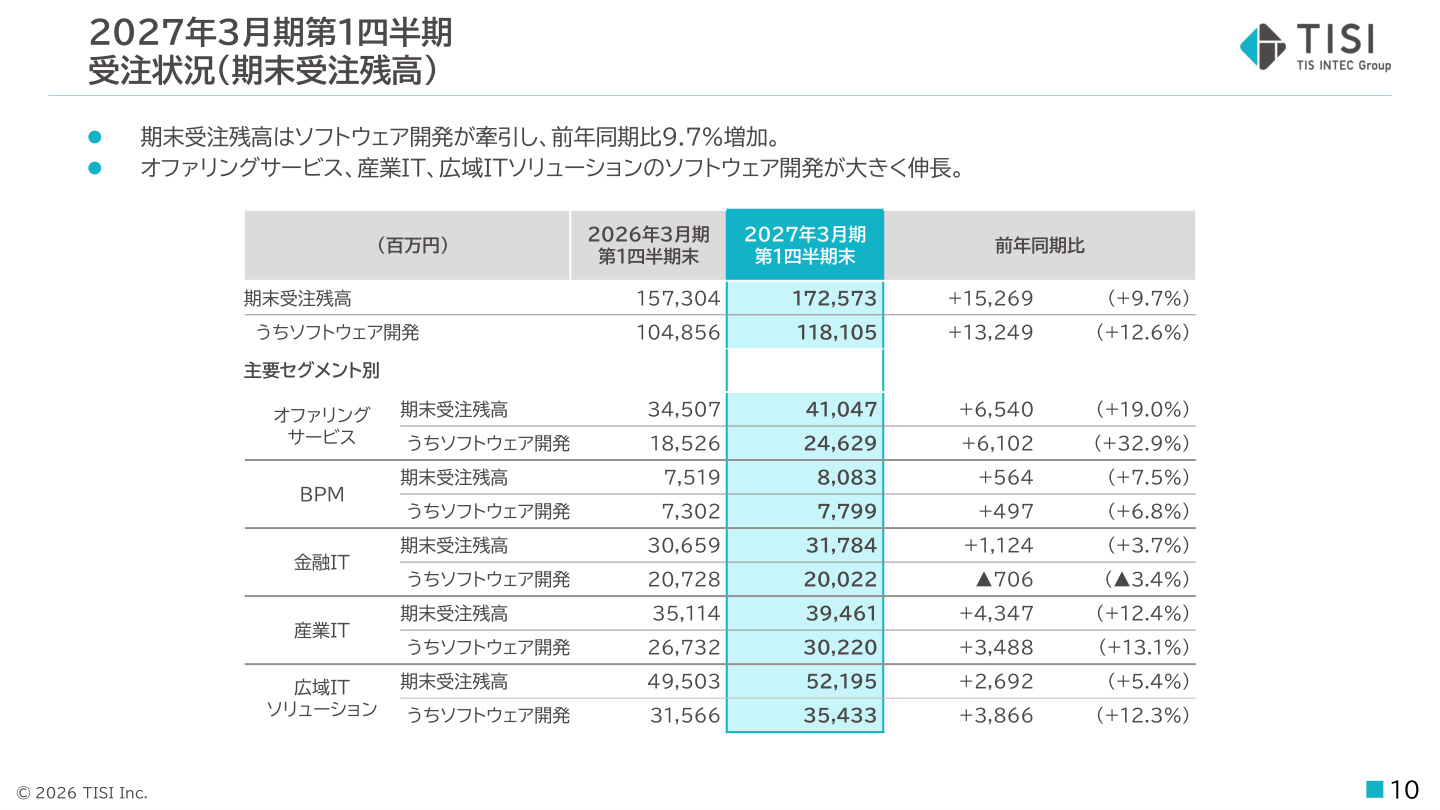
As shown in the slide above, the ending order backlog has expanded to ¥172.573 billion (+9.7% YoY) , indicating that the foundation for future revenue is extremely solid.
- Orders Received for the Period : ¥111.7 billion (+11.3% YoY) , showing strong growth.
- Notably, orders for core "Software Development" reached ¥78.919 billion (+12.5% YoY) .
- By segment, orders for Offering Services grew significantly to ¥27.158 billion (+41.9% YoY) , and Industrial IT to ¥27.961 billion (+15.1% YoY) .
- Composition of Ending Order Backlog : Software Development backlog reached ¥118.105 billion (+12.6% YoY) , an increase of over ¥13.2 billion from the same period last year. Offering Services (+19.0% YoY) and Industrial IT (+12.4% YoY) are driving the accumulation of the backlog, ensuring sufficient volume to support performance from the second quarter onward.
7. Full-Year FY2027 Earnings Forecast and Progress
There are no changes to the full-year consolidated earnings forecast for the fiscal year ending March 31, 2027, from the initial plan.
- Revenue : ¥620 billion (+3.9% YoY)
- Operating Profit : ¥81 billion (+6.3% YoY)
- Operating Profit Margin : 13.1% (+0.3 percentage points YoY)
- Net Profit Attributable to Owners of the Parent : ¥57 billion (+22.3% YoY)
- Earnings Per Share (EPS) : ¥271.70 (+32.6% YoY)
- ROE : 17.5% (+3.5 percentage points YoY)
The company is making progress as planned toward achieving the key management indicators of the Medium-Term Management Plan (2024-2026): "EPS CAGR of 10%" and "ROE exceeding 16%." In particular, net profit is expected to increase significantly by 22.3% YoY, partly due to the inclusion of ¥5 billion in extraordinary income based on the policy of selling investment securities.
In the full-year operating profit plan (an increase of ¥4.77 billion YoY), the company plans to raise the gross profit margin to 29.0% through revenue growth effects (+¥6.84 billion) and profitability improvements from high-value-added business (+¥4.31 billion), while absorbing ¥4.0 billion in compensation investments and growth investments (+¥1.45 billion).
8. Strategic Initiatives and Growth Strategies in the AI Era
TISI is moving beyond the operation and development of existing IT systems to accelerate business growth and create new value through the utilization of Generative AI and AI technologies.
- "IntegriA," an Integrated AI Support Brand :
- Established a system to provide end-to-end support from consulting (strategy formulation) to AI infrastructure/model development, organizational adoption, operation, and value creation.
- Organized a specialized team of over 400 people , including 200 AI/data scientists and 200 related consultants, aiming for ¥10 billion in revenue in 5 years through AI implementation support in the enterprise domain.
- Evolution of the Next-Generation Payment Platform "PAYCIERGE" :
- Combining "Vertical AI" specialized in the payment domain with expert talent and know-how, the platform is evolving into a sophisticated payment system with an eye toward expanding stock-based business.
- Strengthening approaches to cutting-edge themes such as stablecoins, on-chain finance, and agentic commerce.
9. Conclusion and Overall Assessment
TISI's Q1 FY2027 results are highly steady, achieving both revenue/profit growth and improved profit margins against the backdrop of active IT investment demand, particularly in Financial IT and Industrial IT.
The strong growth in orders received (+12.5%) and order backlog (+12.6%) in software development provides high transparency for achieving the full-year earnings forecast (operating profit of ¥81 billion). Furthermore, medium-to-long-term structural reform measures, such as the AI shift via "IntegriA" and the evolution of "PAYCIERGE," are being steadily promoted in parallel. In conclusion, these results demonstrate that the foundation for achieving the goals of the Medium-Term Management Plan is firmly in place.
This content is not intended as investment advice or a recommendation. Any opinions expressed are solely the personal views of each article.