

Coca-Cola Bottlers Japan Holdings Q2 2026 Earnings Deep Dive: First H1 Profit in Eight Years and Accelerated Shareholder Returns

StockClub
Published: Jul 30, 2026, 09:52 AM
Sentiment Analysis
Coca-Cola Bottlers Japan Holdings Q2 2026 Earnings Deep Dive: First H1 Profit in Eight Years and Accelerated Shareholder Returns
Coca-Cola Bottlers Japan Holdings Inc. has announced its financial results for the second quarter (first half) of 2026. Based on the company's disclosure materials, this report provides a comprehensive analysis of performance trends, drivers of profit fluctuations, segment and channel-specific developments, ongoing structural reforms, and future growth strategies and shareholder return policies.
1. H1 2026 Performance Highlights: First H1 Net Profit in Eight Years
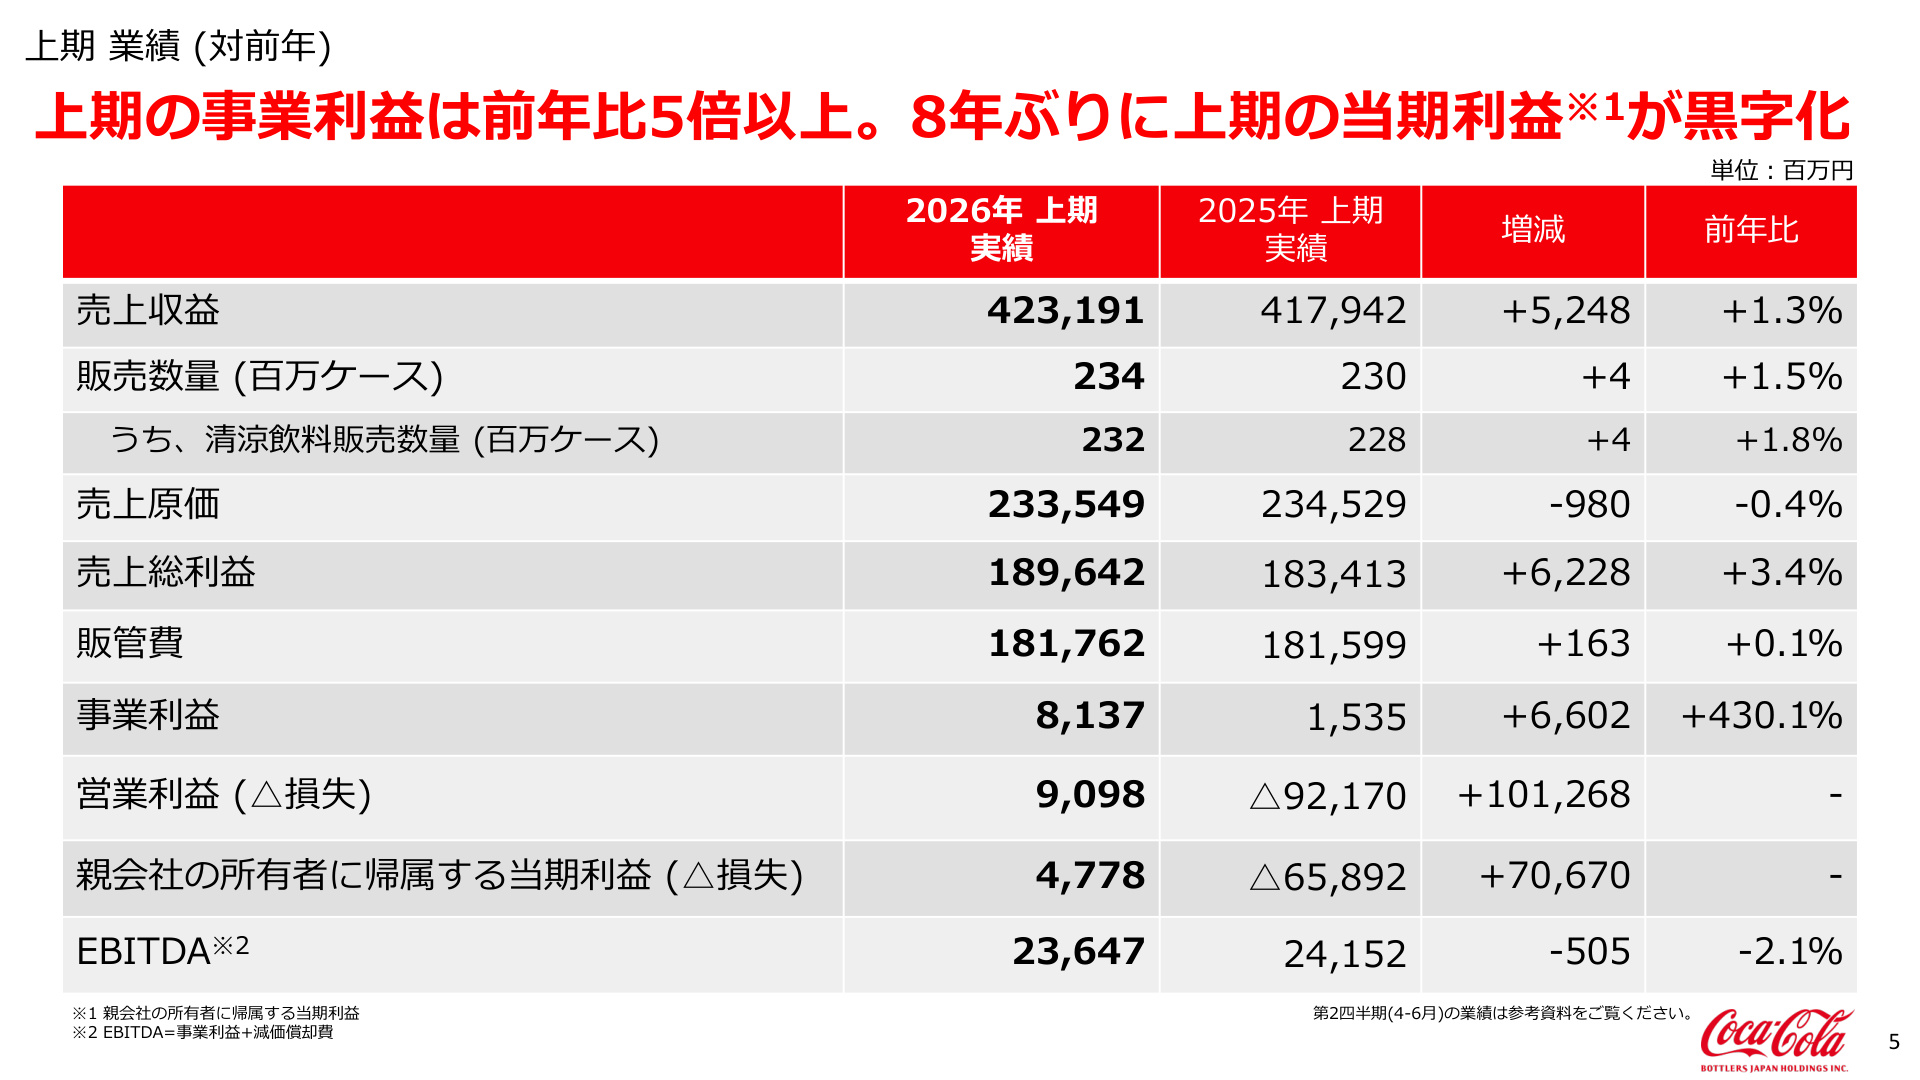
The results for the first half of 2026 showed significant improvements in profitability, with both revenue and profit exceeding the same period last year. Key financial figures are as follows:
- Revenue : 423.191 billion yen ( +1.3% YoY, +5.248 billion yen)
- Sales Volume : 234 million cases ( +1.5% YoY)
- Business Income : 8.137 billion yen ( +430.1% YoY, +6.602 billion yen)
- Operating Income : 9.098 billion yen (compared to a loss of 92.170 billion yen in the same period last year)
- Net Profit Attributable to Owners of the Parent : 4.778 billion yen (compared to a loss of 65.892 billion yen in the same period last year)
The slide below illustrates the overall profit and loss comparison for the first half of 2026.
[Slide Commentary: Background and Significance of H1 Financial Results]
The slide above (Page 4) clearly demonstrates the robust recovery achieved this term. Most notably, Business Income reached 8.137 billion yen, a more than five-fold increase (+430.1%) year-on-year , and the company achieved its first H1 net profit (attributable to owners of the parent) since 2018, totaling 4.778 billion yen .
The fact that gross profit grew by +3.4% (189.642 billion yen) against a revenue increase of +1.3% highlights a structure where cost control and price revisions have steadily improved the net sales price per case. Furthermore, by limiting the increase in SG&A expenses to +0.1% , the revenue growth directly translated into a dramatic surge in business income.
2. Analysis of Business Income Fluctuations: Top-line Impact and Transformation Initiatives
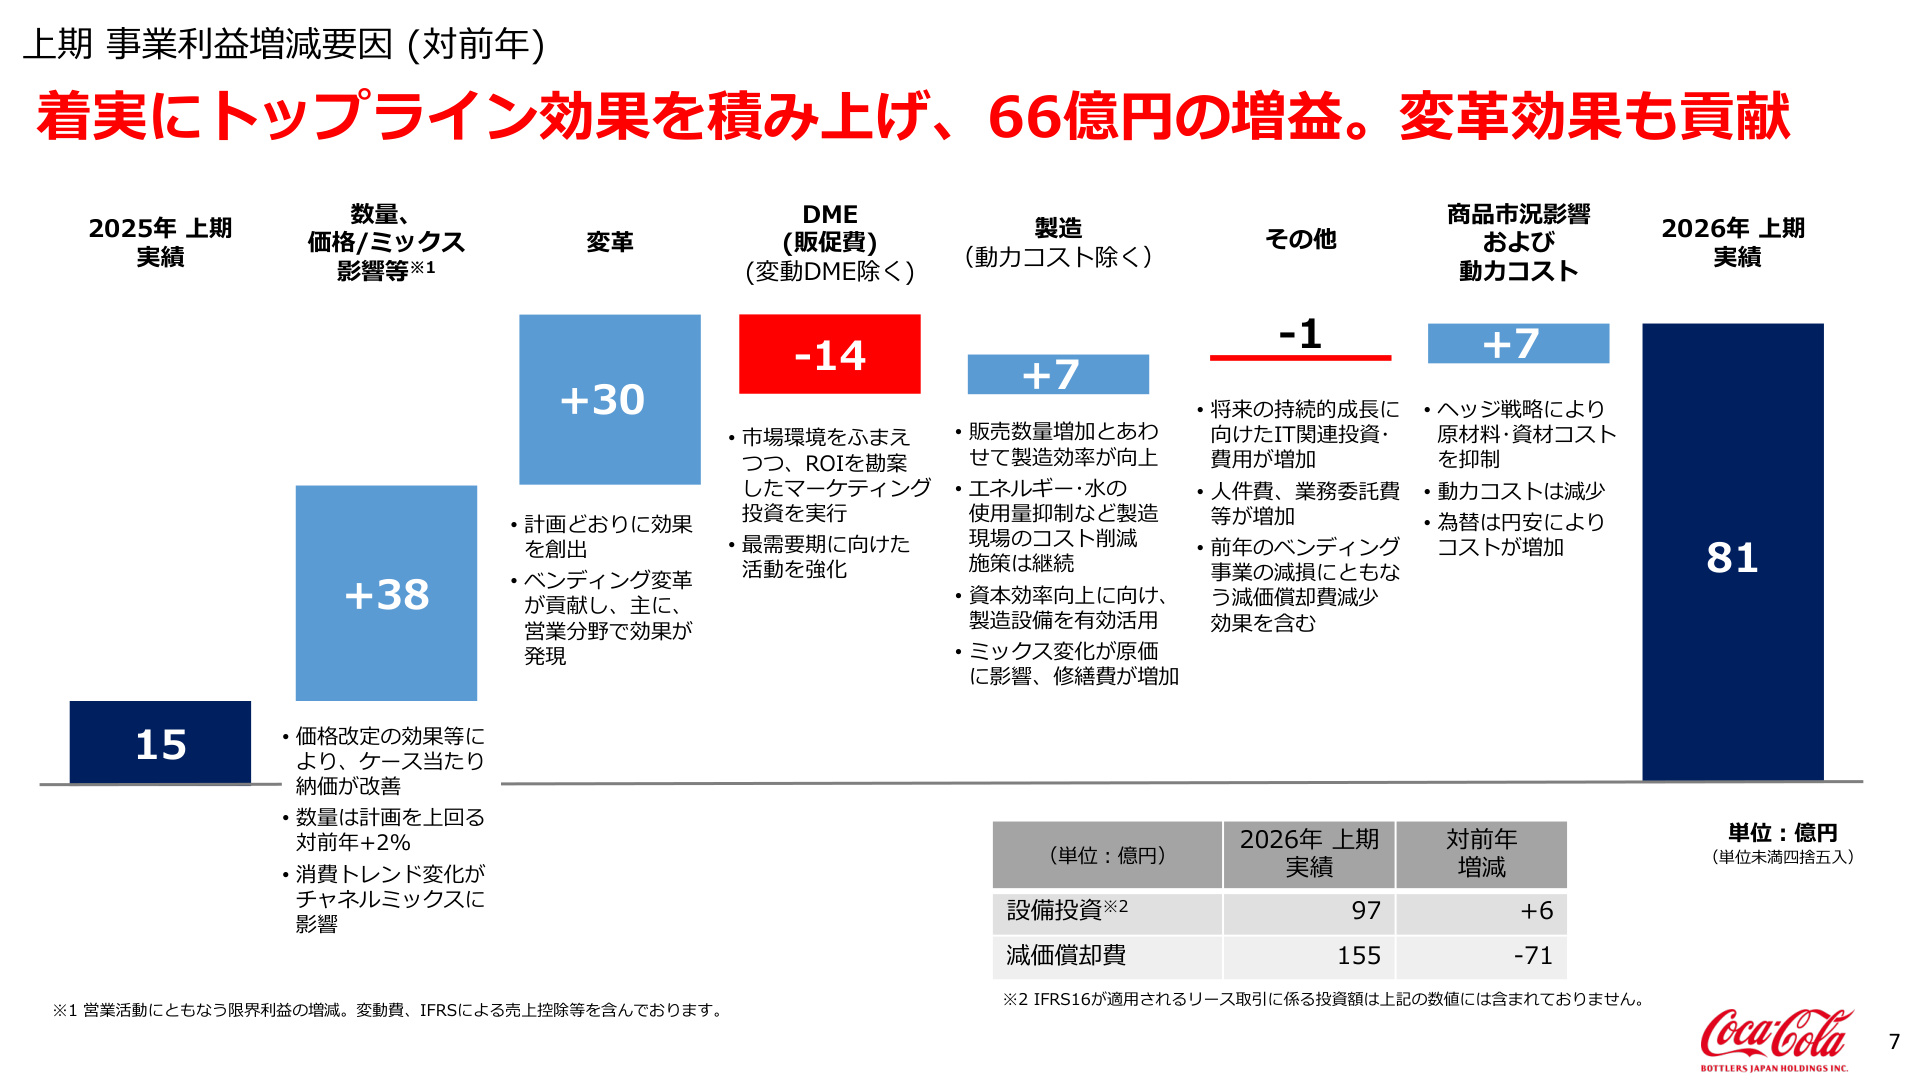
The increase in business income by 6.602 billion yen , from 1.535 billion yen in the same period last year to 8.137 billion yen, is driven by several factors.
[Slide Commentary: Waterfall Analysis of Business Income]
The slide above (Page 6) provides a waterfall chart breaking down profit fluctuations from the previous year. This analysis makes it clear that the company's earnings improvement is not merely due to favorable external conditions, but is the result of voluntary structural reforms and business transformation .
The breakdown of major positive and negative factors is as follows:
- Volume, Price/Mix, etc. (+3.8 billion yen) : In addition to a sales volume increase exceeding plans (+2% YoY), the net sales price per case improved due to ongoing price revisions.
- Transformation (+3.0 billion yen) : The "Vending Transformation," centered on the vending machine business, delivered planned results in sales operations, achieving fixed cost reduction and operational efficiency.
- Commodity Market and Utility Costs (+0.7 billion yen) : Despite cost increases due to the weak yen, effective hedging strategies for crude oil and raw materials, combined with lower utility costs, resulted in a positive contribution.
- DME (Direct Marketing Expenses) Fluctuations (-1.4 billion yen) : Expenses increased due to intensified market investment ahead of the peak summer season and marketing investments based on ROI.
- Manufacturing Costs (+0.7 billion yen) : Contributed by improved capacity utilization due to higher sales volume and cost reductions at manufacturing sites (e.g., reduced energy and water consumption).
- Other (-0.1 billion yen) : While IT-related investments for future sustainable growth and personnel/outsourcing costs increased, these were partially offset by a decrease in depreciation expenses.
The combination of top-line growth (+3.8 billion yen) and transformation effects (+3.0 billion yen) served as the pillars that absorbed various cost investments to achieve a significant profit increase.
3. Channel/Segment Trends and Market Share
Performance by Segment
- Vending Business : While revenue saw a slight decline to 186.432 billion yen (-1.7% YoY), segment profit turned dramatically into the black at 5.343 billion yen (compared to a loss of 1.389 billion yen in the same period last year). AI-driven product assortment optimization, marketing via the "Coke ON" app, and operational efficiency significantly contributed to margin improvement.
- OTC (Over-the-Counter) Business : Including supermarkets, drugstores, and convenience stores, the OTC channel saw revenue of 199.195 billion yen ( +2.6% YoY) and segment profit of 22.750 billion yen ( +8.3% YoY), maintaining growth in both revenue and profit.
- Food Service Business : Driven by the recovery of the dining-out market and business expansion with new and existing customers, revenue reached 22.952 billion yen ( +15.7% YoY) and segment profit hit 3.136 billion yen ( +10.0% YoY), marking double-digit growth.
Net Sales Price per Case and Market Share by Channel
Overall sales volume grew by +2% YoY. By channel, drugstores/mass retailers (D&D) grew by +4% , retail by +6% , online by +8% , and food service (FS) by +11% . Meanwhile, the net sales price per case increased across all channels (excluding online), with improvements of +77 yen in convenience stores (CVS), +85 yen in retail, and +40 yen in vending (VM).
In-store value share increased by +0.9 points YoY , demonstrating balanced growth while maintaining a "price premium" against the industry average.
4. Marketing Activities and Strengthening the Business Foundation
Category Strategy and Hit Products
- Sparkling Category (Volume +8% YoY) : The "Coca-Cola" brand led the growth, supported by limited-edition packaging and activations aligned with the FIFA World Cup.
- Energy Drinks (Monster Energy) : Sequential rollout in the vending machine channel began in June. As a high-unit-price product, early market penetration ahead of the peak season is underway, with future profit contributions expected.
- Green Tea and New Products : The price revision for green tea in March improved the net sales price per case for "Ayataka" by +150 yen YoY. Furthermore, the introduction of new products like "Aquarius The Zero" and the new "Georgia Cafe Water" continues to strengthen core categories.
Supply Chain and IT Infrastructure Optimization
Preparations are proceeding smoothly for the launch of three Integrated Distribution Centers (IDC) in the Kanto area by the end of the year, which will centralize and streamline logistics. The company is promoting the optimization of supply costs by consolidating sales and logistics hubs, while also proceeding with the introduction and stable operation of new systems to improve the accuracy of S&OP (Sales and Operations Planning) processes.
5. Future Outlook and Accelerated Shareholder Returns
To achieve full-year plans and enhance corporate value in the medium-to-long term, several key initiatives are scheduled for the second half.
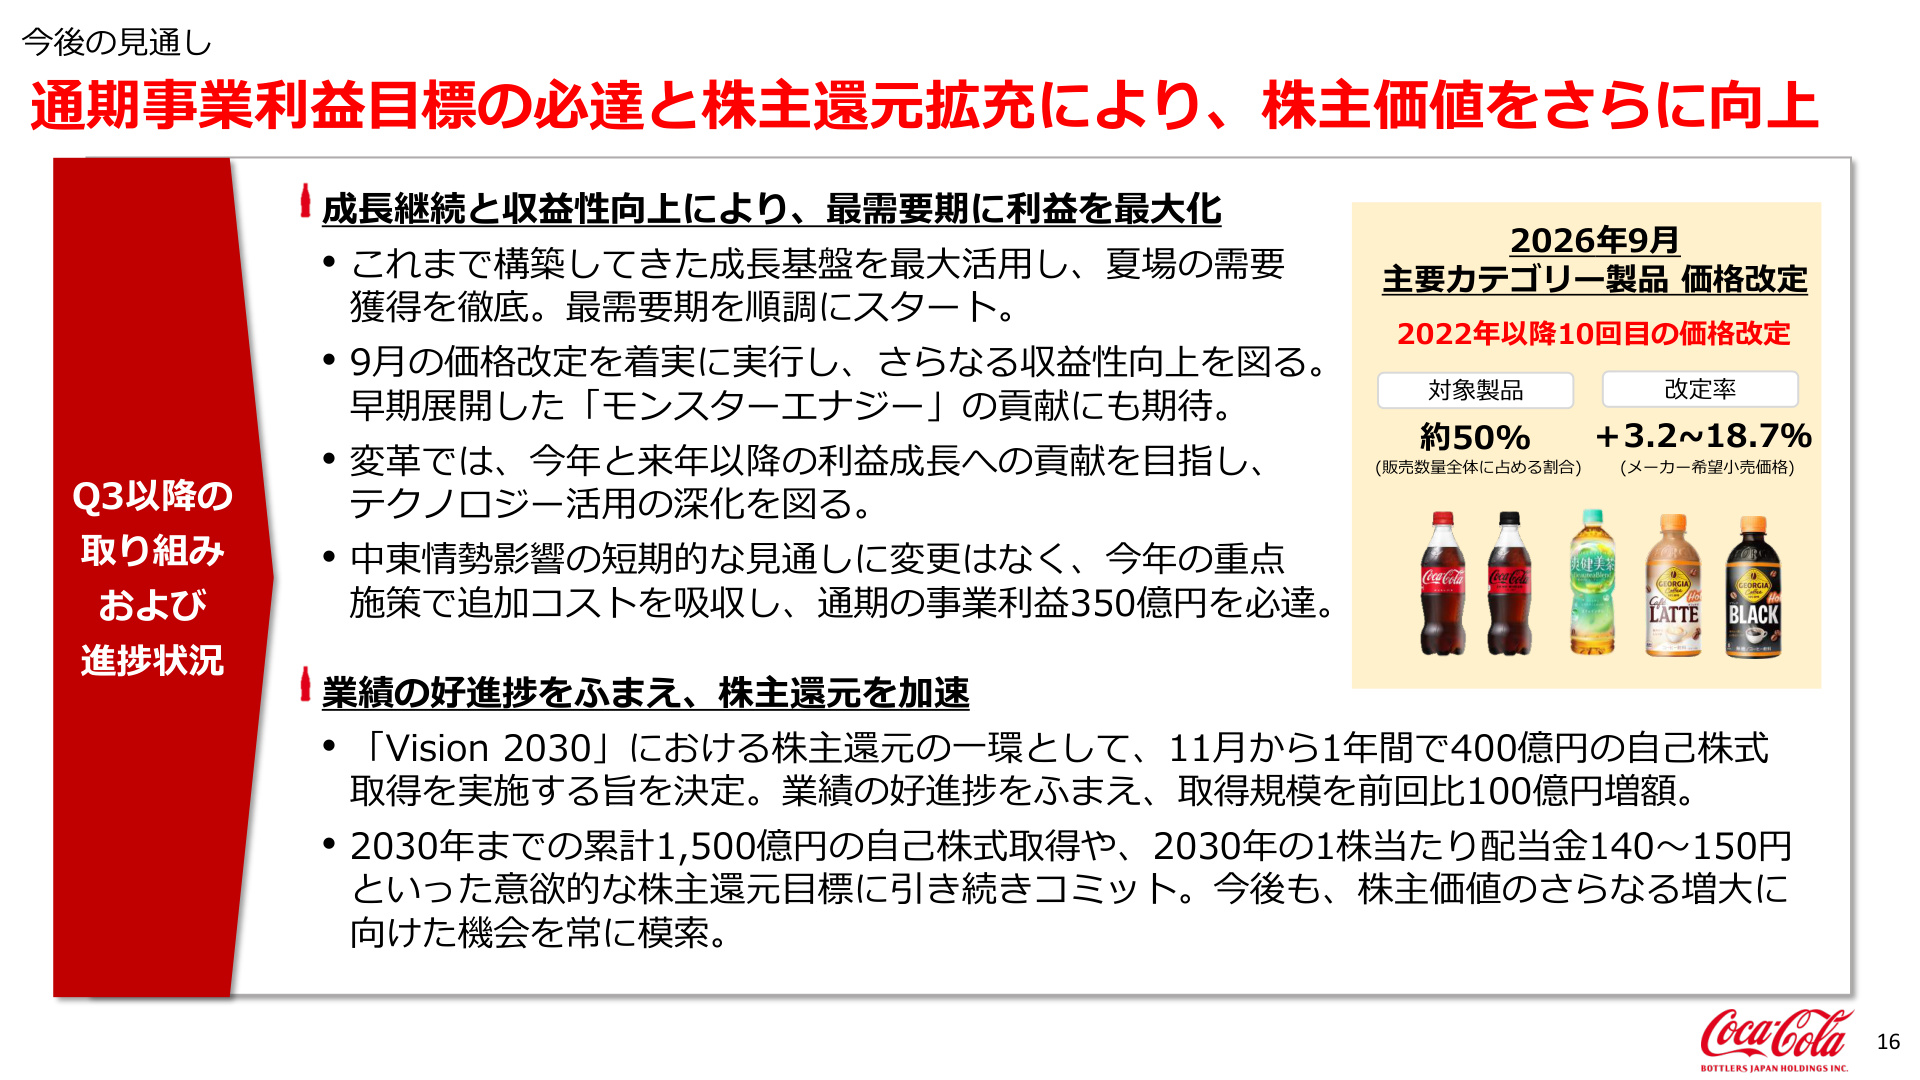
[Slide Commentary: Future Outlook and Increased Share Buybacks]
The slide above (Page 15) presents the key initiatives for the second half and a significant decision regarding shareholder returns.
First, to ensure sustainable profitability, price revisions for major category products will be implemented in September 2026 . This marks the 10th price revision since 2022, covering products equivalent to approximately 50% of total sales volume, with revisions ranging from +3.2% to +18.7% based on manufacturer suggested retail prices . Major items such as "Coca-Cola," "Georgia," and "Kenko-sozai" are included, which are expected to absorb cost increases due to Middle Eastern tensions and support the full-year target.
A major topic for investors is the dramatic acceleration of shareholder returns . As part of the shareholder return policy outlined in "Vision 2030," the company has decided to implement a share buyback program of 40 billion yen over one year starting in November 2026 . This is a 10 billion yen increase from the previously announced plan of 30 billion yen, reflecting management's strong confidence in the solid progress of H1 results and future profit growth.
The company has set a medium-to-long-term goal of cumulative share buybacks of 150 billion yen and an annual dividend of 140–150 yen per share by 2030, and this decision serves as a major catalyst toward achieving those targets.
6. Summary and Conclusion
In its Q2 2026 earnings, Coca-Cola Bottlers Japan Holdings presented the following achievements and direction:
- Rapid Earnings Recovery : Business income reached 8.137 billion yen, more than five times the previous year, achieving over 60% of the full-year business income target (35 billion yen) in the first half. H1 net profit also turned positive for the first time in eight years.
- Reform of Profit Structure : The dramatic turnaround of the vending business and improved net sales prices through price revisions and cost optimization (e.g., IDC logistics centers) have borne fruit.
- Additional Price Revisions : Implementing price revisions in September 2026 for approximately 50% of total volume to absorb the impact of raw material and logistics costs.
- Strengthened Shareholder Returns : Based on strong performance, the company decided on a 40 billion yen share buyback program , an increase of 10 billion yen.
By maintaining and promoting top-line growth and transformation initiatives through the peak summer season and beyond, the company has demonstrated its commitment to achieving the full-year business income target of 35 billion yen and enhancing medium-to-long-term shareholder value in line with "Vision 2030."
This content is not intended as investment advice or a recommendation. Any opinions expressed are solely the personal views of each article.