

Nippon Sanso Holdings: Q1 FY2027 Earnings Deep Dive – Strong Results Driven by Pricing Strategy and Global M&A, with a Clear Roadmap for Growth

StockClub
Published: Jul 29, 2026, 09:55 AM
Sentiment Analysis
Nippon Sanso Holdings Corporation’s Q1 FY2027 financial results (announced July 29, 2026) demonstrate significant year-on-year growth in both revenue and profit . Despite a challenging external environment marked by Middle East tensions and rising costs, the company successfully leveraged localized pricing management, the realization of M&A synergies, and a recovery in demand for generative AI and semiconductors.
This report provides a multi-faceted analysis of the company’s earnings structure, segment-specific performance drivers, capital expenditure portfolio for future growth, and the progress of its medium-term management plan, " Next Innovation 2030 ," based on the supplementary earnings materials.
1. Q1 Consolidated Financial Highlights and Earnings Analysis
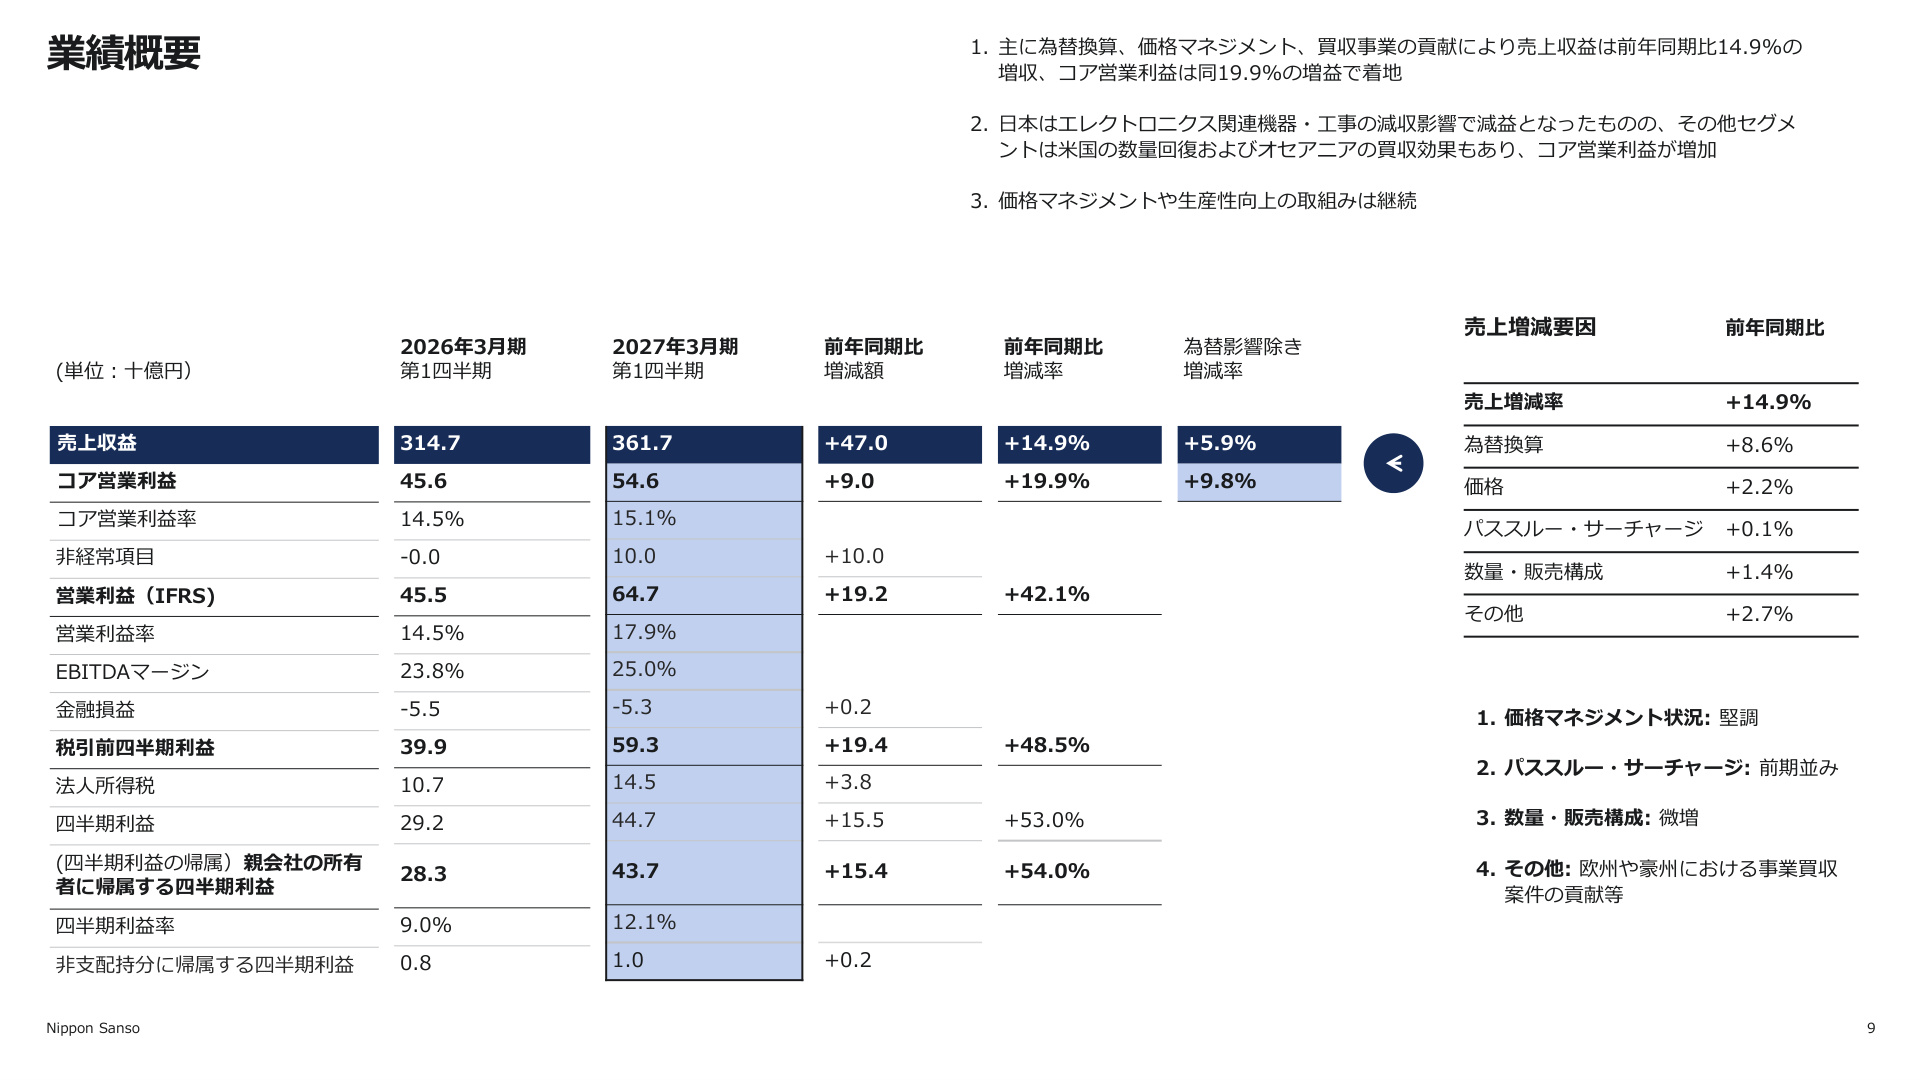
In the first quarter, the company achieved strong results, exceeding the previous year's figures across revenue, core operating profit, and net profit. Key financial indicators are as follows:
- Revenue : ¥361.7 billion (+14.9% YoY / +5.9% excluding FX impact)
- Core Operating Profit : ¥54.6 billion (+19.9% YoY / +9.8% excluding FX impact)
- Core Operating Profit Margin : 15.1% (+0.6pt from 14.5% in the previous year)
- Operating Profit (IFRS) : ¥64.7 billion (+42.1% YoY)
- Quarterly Profit (Attributable to Owners of the Parent) : ¥43.7 billion (+54.0% YoY)
- EBITDA Margin : 25.0% (+1.2pt from 23.8% in the previous year)
The following slide details the Q1 earnings performance and the factors contributing to revenue fluctuations.
Why this slide matters: Analyzing the quality of profit growth
This slide proves that Nippon Sanso Holdings' earnings expansion is not merely a result of "FX tailwinds" (yen depreciation), but is driven by the company’s proactive pricing management and organic business growth .
Breakdown of the revenue increase (+14.9% YoY):
- FX Translation Impact : +8.6% (Positive contribution from a weaker yen)
- Pricing Management : +2.2% (Appropriate price pass-through for inflation and rising costs)
- Volume and Sales Mix : +1.4% (Volume recovery in the U.S. and electronics demand)
- Other (M&A effects, etc.) : +2.7% (Contribution from business acquisitions in Europe and Oceania)
- Pass-through/Surcharges : +0.1%
Even excluding FX impacts, revenue grew by 5.9% and core operating profit by 9.8%, reflecting strong momentum. The core operating profit margin expanded from 14.5% to 15.1%. Furthermore, IFRS operating profit, which includes non-recurring items (such as a ¥1.0 billion gain on the sale of head office land), rose by 42.1%, signaling a steady strengthening of the company's financial position.
2. Deep Dive into Regional and Segment Trends
As a global operator, the company faces distinct market environments and performance drivers in each region.
① Japan Segment: Gas business remains resilient despite decline in equipment and construction
- Revenue : ¥96.7 billion (-0.7% YoY / -0.9% excluding FX)
- Segment Profit : ¥12.0 billion (-9.7% YoY / -10.0% excluding FX)
- Profit Margin : 12.5% (vs. 13.7% last year)
In the gas business, revenue increased due to higher shipment volumes of electronic materials gases and effective pricing management. However, the segment saw a slight decline in overall revenue and profit due to timing shifts and a decrease in electronics-related equipment and construction projects. By industry, electronics accounts for 33% and steel/metals for 24%.
② U.S. Segment: Broad-based profit growth through volume recovery and productivity gains
- Revenue : ¥99.1 billion (+18.0% YoY / +5.6% excluding FX)
- Segment Profit : ¥14.9 billion (+30.8% YoY / +16.6% excluding FX)
- Profit Margin : 15.1% (Significant improvement from 13.6% last year)
In addition to a full-scale recovery in shipment volumes, continuous pricing management and rigorous cost control/productivity improvements proved successful. Both gas and equipment performed well, achieving a high profit margin of 15.1% and an EBITDA margin of 28.2%.
③ Europe Segment: Contribution from home care acquisition and price optimization
- Revenue : ¥97.8 billion (+18.8% YoY / +5.4% excluding FX)
- Segment Profit : ¥18.9 billion (+18.4% YoY / +4.9% excluding FX)
- Profit Margin : 19.4% (EBITDA margin of 32.5%)
Although shipment volumes for manufacturing slowed, the segment maintained steady growth in revenue and profit through price optimization and the addition of revenue from the Spanish home care business acquired in the previous fiscal year. Its ability to maintain high profitability remains a core strength.
④ Asia & Oceania Segment: Explosive growth via M&A and electronic materials gases
- Revenue : ¥58.8 billion (+39.2% YoY / +21.2% excluding FX)
- Segment Profit : ¥7.1 billion (+106.9% YoY / +74.7% excluding FX)
- Profit Margin : 12.1% (Sharp increase of +4.0pt from 8.1% last year)
The full-year contribution from the industrial gas business acquisition in Oceania, combined with increased shipments of electronic materials gases driven by generative AI and data center demand, acted as a powerful growth engine. Segment profit more than doubled year-on-year.
⑤ Thermos Segment: High profit margins maintained through heatwave demand and new products
- Revenue : ¥9.1 billion (+5.5% YoY)
- Segment Profit : ¥1.8 billion (+10.3% YoY)
- Profit Margin : 20.8%
Driven by record-breaking heat in Japan, demand for thermal mugs and sports bottles increased, and the aggressive rollout of new products helped secure a high profit margin exceeding 20%.
3. Capital Expenditure and Portfolio Supporting Sustainable Growth
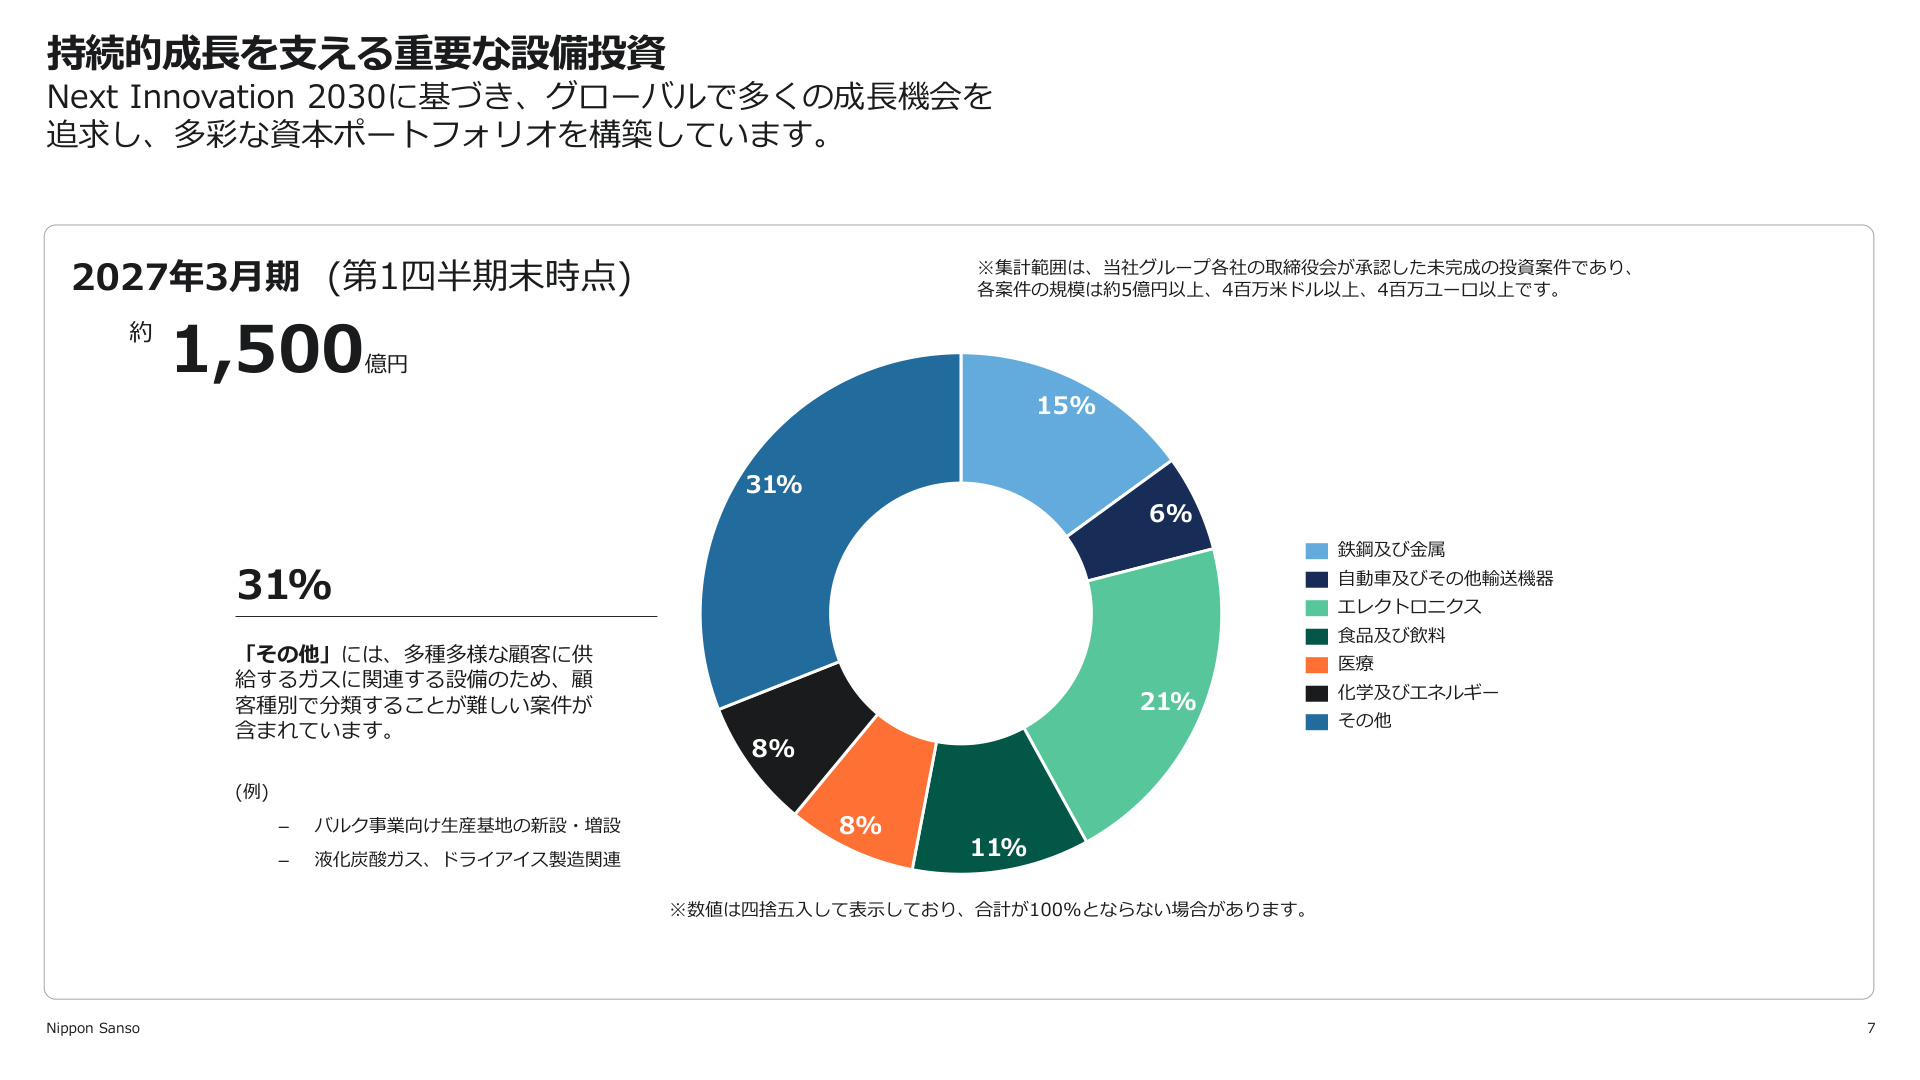
To ensure long-term growth, the company is focusing capital expenditure on growth areas under disciplined capital allocation. As of the end of Q1, the total value of ongoing large-scale capital investment projects stands at approximately ¥150 billion .
The following slide illustrates the portfolio showing where the company is prioritizing its investments.
Why this slide matters: Visualizing future revenue sources
This pie chart demonstrates the company’s portfolio management, which diversifies against industry-specific economic risks while precisely allocating resources to high-growth markets.
Breakdown of investment by industry:
- Electronics : 21% (Strengthening supply systems for ultra-high-purity gases for semiconductors/generative AI)
- Steel and Metals : 15% (Renewal and efficiency improvements of large on-site plants)
- Chemicals and Energy : 11% (Including decarbonization and low-carbon solutions)
- Food and Beverage : 8% / Medical : 8% / Automotive and Transport : 6%
- Other (Bulk, Liquid Carbon Dioxide, etc.) : 31%
In Q1 alone, the company invested ¥28.5 billion , steadily executing projects that anticipate global electronics demand and the transition to a green society while maintaining strict risk assessment.
4. Goals and Progress of the Medium-Term Management Plan "Next Innovation 2030"
The company has formulated a new medium-term management plan, " Next Innovation 2030 ," starting in April 2026, with clear growth targets for the fiscal year ending March 2030.
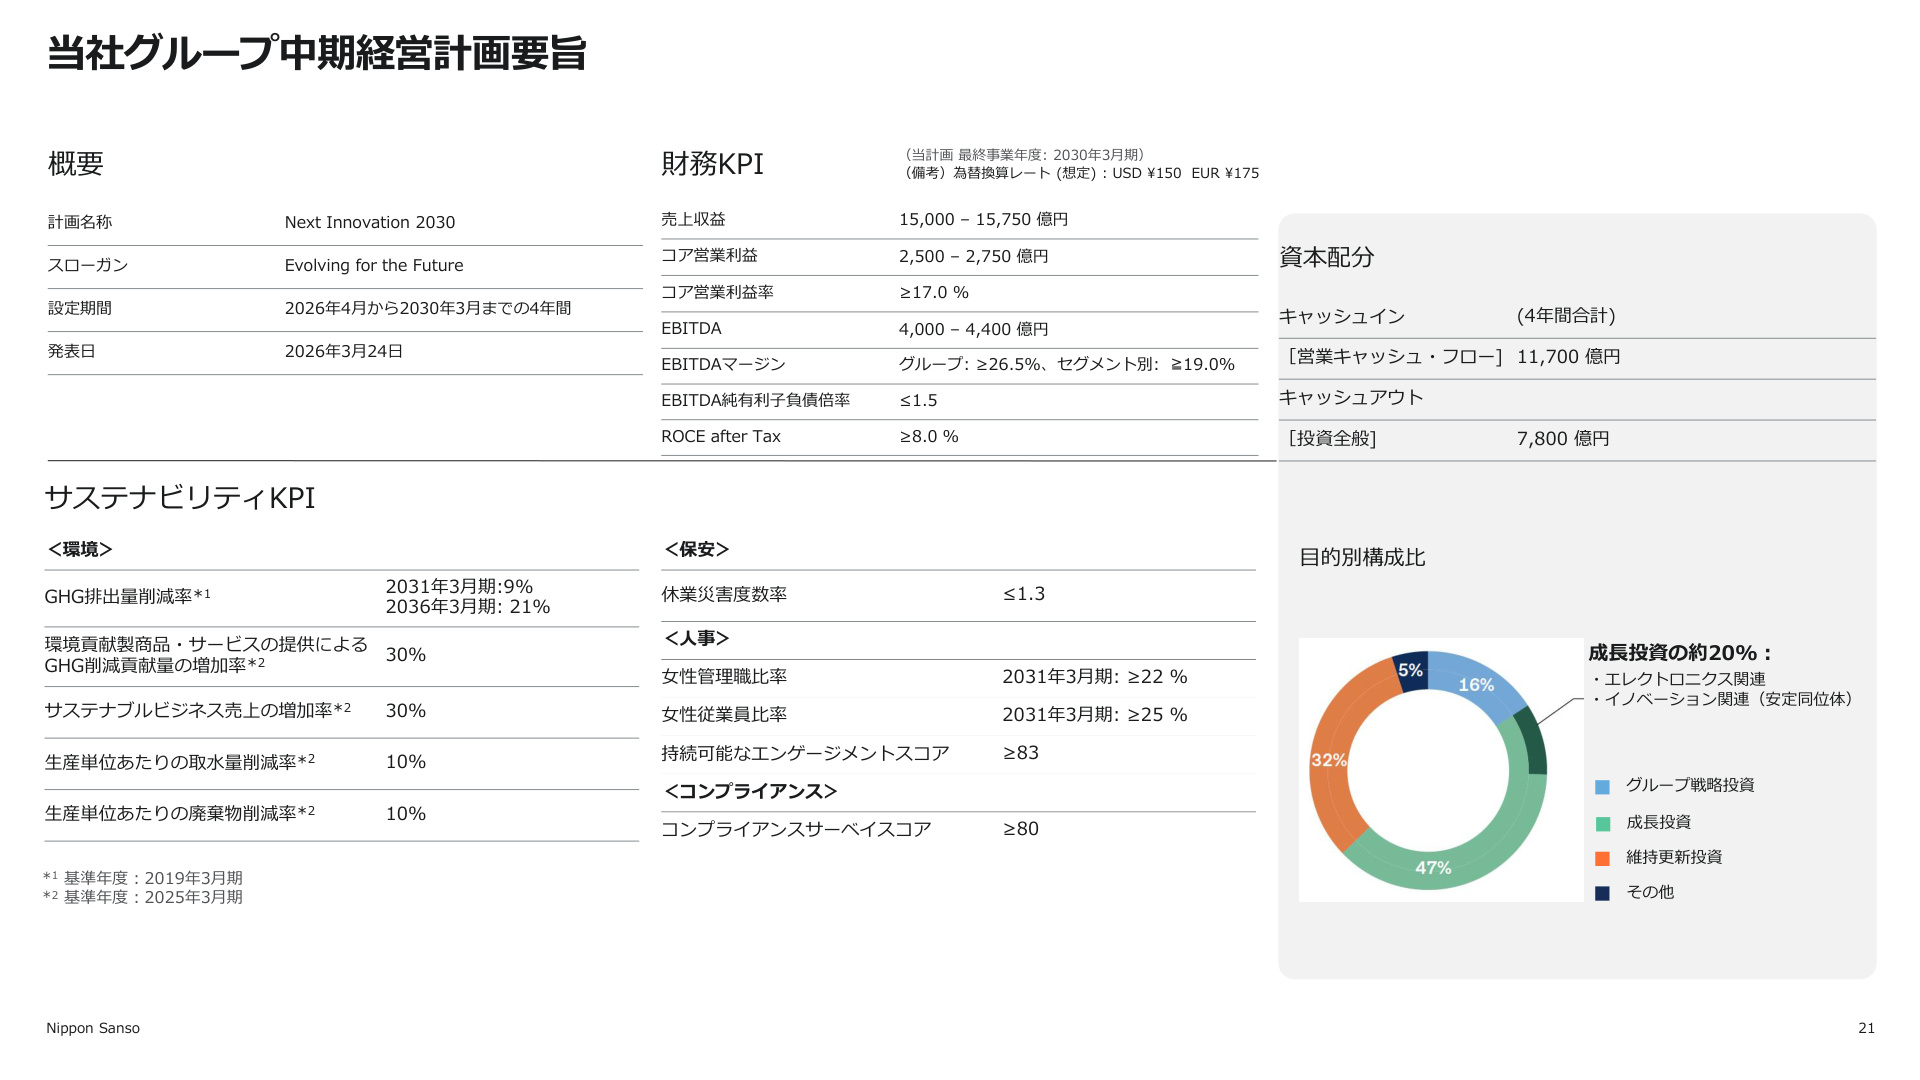
Why this slide matters: Roadmap for long-term corporate value enhancement
This slide defines the fundamental strategy, including the financial scale Nippon Sanso Holdings aims to achieve and the non-financial (ESG) guidelines necessary for sustainable management.
[Key Financial Targets (FY ending March 2030)]
- Revenue : ¥1.5 trillion – ¥1.575 trillion
- Core Operating Profit : ¥250 billion – ¥275 billion
- Core Operating Profit Margin : 17.0% or higher
- EBITDA Margin : 26.5% or higher (Group-wide)
- ROCE after Tax : 8.0% or higher
- Net Debt/EBITDA Ratio : 1.5x or lower
[Capital Allocation]
Out of the projected 4-year operating cash flow of ¥1.17 trillion , ¥780 billion is earmarked for total investment. The plan allocates approximately 20% of growth investment to electronics and innovation areas.
[Sustainability/ESG Goals]
- GHG Emission Reduction : 9% reduction by FY2031, 21% reduction by FY2036 (vs. 2019)
- Increase in reduction contribution via environmentally friendly products : +30%
- Diversity : Female manager ratio of 22% or higher and female employee ratio of 25% or higher by FY2031.
5. Full-Year Forecast, Cash Flow, and Financial Soundness
① FY2027 Full-Year Forecast
Full-year forecasts remain unchanged from the plan announced on May 11, 2026.
- Revenue : ¥1.38 trillion (+1.5% YoY)
- Core Operating Profit : ¥208 billion (+2.4% YoY)
- Profit (Attributable to Owners of the Parent) : ¥131 billion (+5.7% YoY)
- Assumed FX Rates : 1 USD = ¥150.00, 1 EUR = ¥175.00
Progress in Q1 is solid, with 26.2% of revenue and 26.3% of core operating profit achieved. Given that the effective USD rate (160.72 yen in Q1) is weaker than the assumption (150 yen), and considering business expansion in Asia and the U.S., the company is on a very steady pace.
② Cash Flow and Financial Position
- Operating Cash Flow : ¥54.7 billion (+31.3% YoY)
- Free Cash Flow : ¥38.2 billion (Significant expansion of +¥16.2 billion YoY)
- Adjusted Net D/E Ratio : 0.56x (Improved from 0.59x at the end of the previous fiscal year)
- Net Debt/EBITDA Ratio : 2.1x (Maintaining sound financial health)
Summary
Nippon Sanso Holdings' Q1 FY2027 results demonstrate that its three strategic pillars— "thorough pricing management," "steady integration of global M&A," and "capturing demand in the electronics sector" —are functioning effectively, even amidst global inflation and geopolitical risks. A positive cycle has been established, using abundant operating cash flow to reinvest in future growth markets, marking a strong start toward the "Next Innovation 2030" medium-term management plan.
This content is not intended as investment advice or a recommendation. Any opinions expressed are solely the personal views of each article.