


Tokuyama Corporation: Q1 FY2027 Earnings and Full-Year Forecast Deep Dive Report

StockClub
Published: Jul 29, 2026, 09:54 AM
Sentiment Analysis
Tokuyama Corporation: Q1 FY2027 Earnings and Full-Year Forecast Deep Dive Report
This report provides a detailed analysis of the Q1 FY2027 (ending March 31, 2027) financial results and full-year earnings forecast for Tokuyama Corporation (Securities Code: 4043), based on the company's official disclosures.
Despite facing headwinds such as surging raw material and fuel costs and supply constraints for certain chemical products , Tokuyama achieved revenue growth this quarter. This was driven by the consolidation of the Tokuyama Life Science (TLS) Group and expansion in growth areas such as semiconductor-related products . While profitability was impacted by rising costs, the company projects an increase in net income attributable to owners of the parent for the full year and plans a dividend increase for the fourth consecutive year .
1. Q1 Earnings Highlights
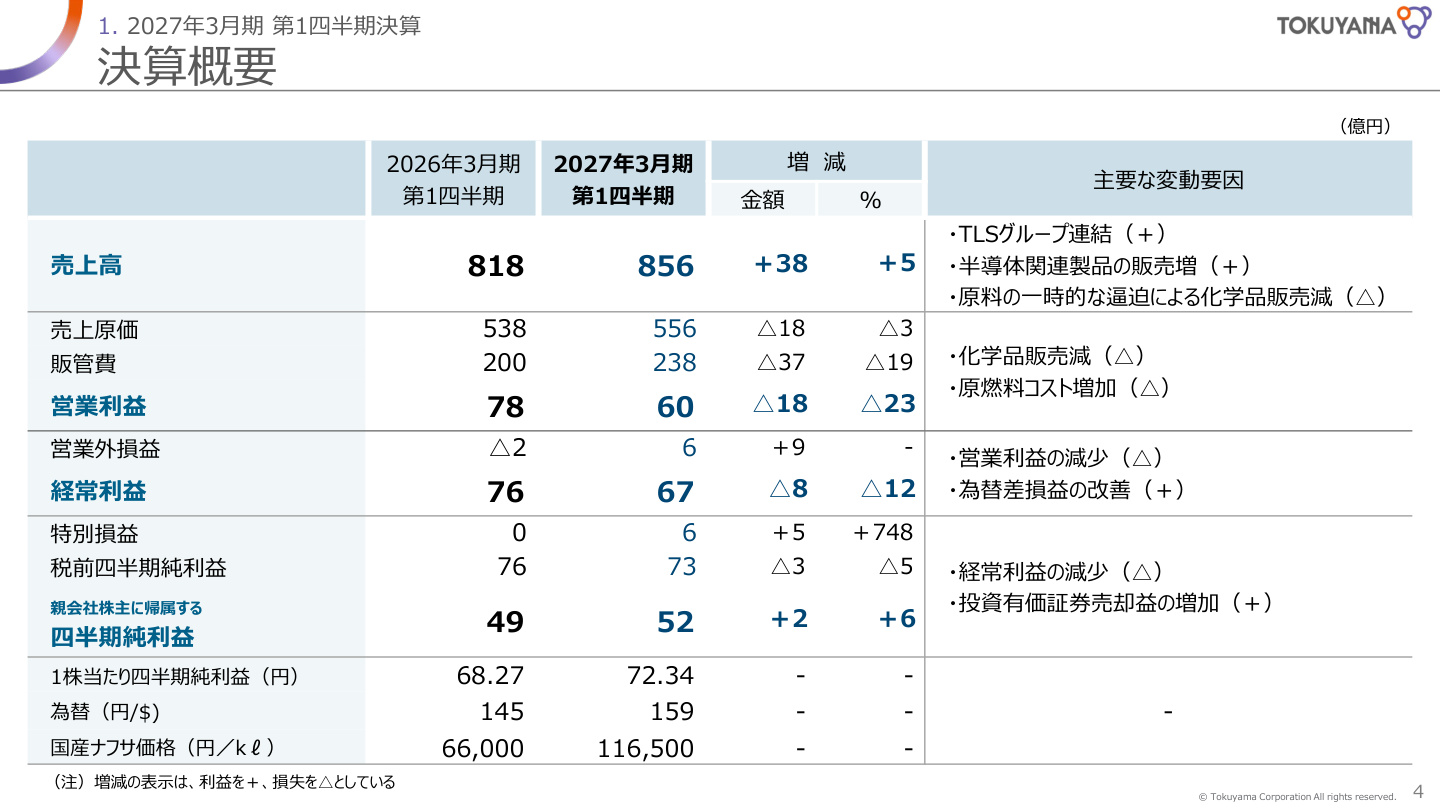
In the first quarter of FY2027, net sales rose 5.0% year-on-year to 85.6 billion yen . However, operating profit fell 23.2% to 6.0 billion yen , ordinary profit declined 12.3% to 6.7 billion yen , and net income attributable to owners of the parent increased 6.1% to 5.2 billion yen .
Analysis of Slide Data and Background
The earnings summary slide above clearly illustrates the shift in the company's revenue structure:
- Revenue Growth Drivers : Although the Chemicals segment saw a decline in sales volume due to temporary raw material shortages, this was strongly offset by the contribution of the TLS Group , which was consolidated in the second half of the previous fiscal year, and expanded sales of semiconductor-related products , resulting in a total revenue increase of 3.8 billion yen .
- Operating Profit Decline : The 1.8 billion yen decrease in operating profit was primarily driven by rising prices for raw materials and fuels, including naphtha , lower sales volumes in chemicals, and increased manufacturing costs.
- Net Income Growth : Despite the decline at the operating and ordinary profit levels, the company recorded extraordinary income (e.g., gain on sale of investment securities, +0.6 billion yen) , allowing net income attributable to owners of the parent to reach 5.2 billion yen (up 0.2 billion yen year-on-year) .
- Exchange Rates and Raw Material Indicators : The Q1 results were based on an exchange rate of 159 JPY/USD (vs. 145 JPY/USD in the same period last year) and a domestic naphtha price of 116,500 JPY/kl (vs. 66,000 JPY/kl last year), reflecting the significant impact of yen depreciation and soaring naphtha prices on financial figures.
2. Waterfall Analysis of Operating Profit
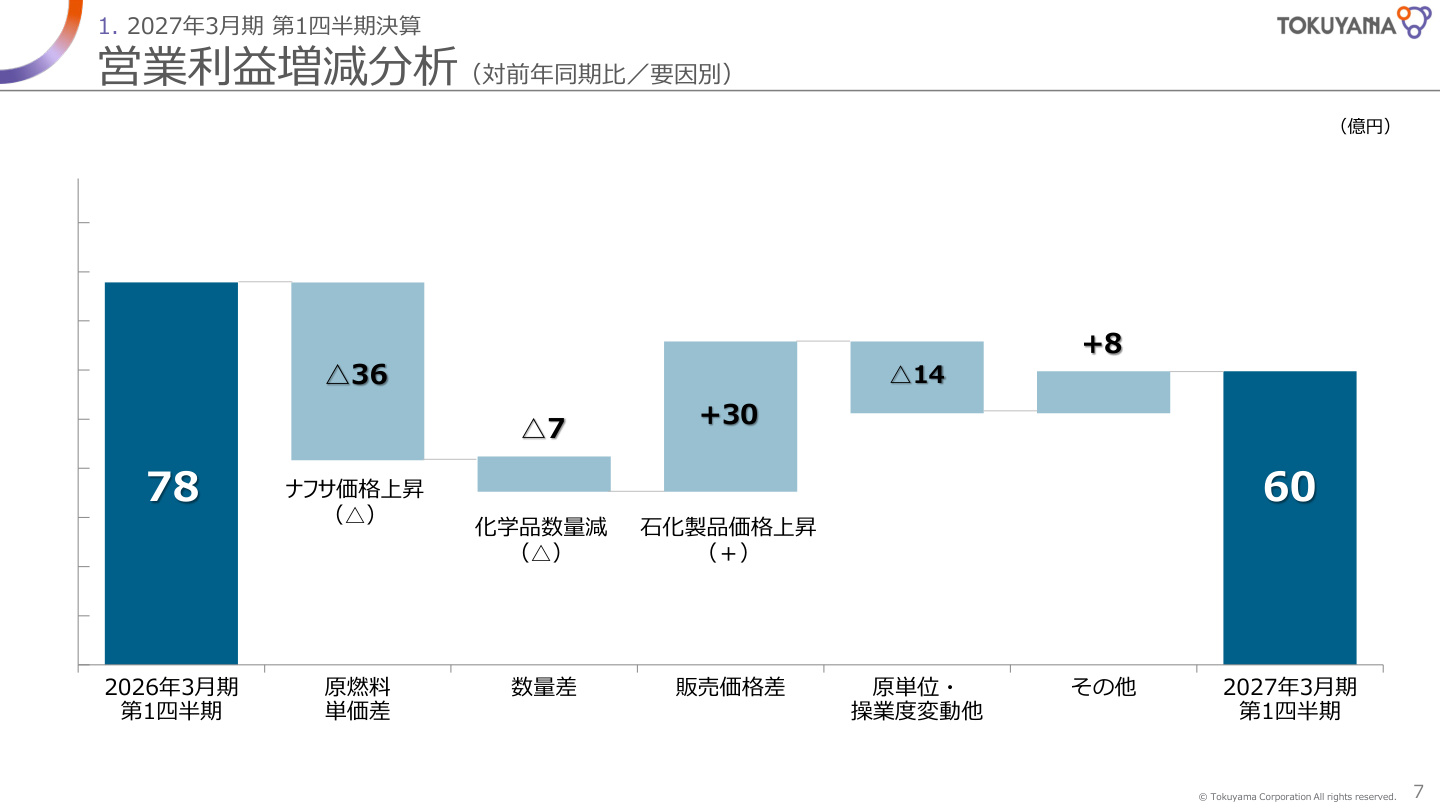
We analyze the factors behind the 1.8 billion yen decline in operating profit from 7.8 billion yen in the same period last year to 6.0 billion yen.
Analysis of Slide Data and Detailed Narrative
This waterfall chart is critical for understanding the company's pricing power against external headwinds:
- Raw Material/Fuel Price Variance (-3.6 billion yen) : The primary pressure was the sharp rise in domestic naphtha prices . The surge from 66,000 JPY/kl to 116,500 JPY/kl resulted in a direct 3.6 billion yen increase in costs across the company and its group.
- Volume Variance (-0.7 billion yen) : Sales volume declined due to temporary supply adjustments in the Chemicals segment.
- Sales Price Variance (+3.0 billion yen) : To counter the surge in costs, the company aggressively implemented price revisions and passed costs on to customers , particularly in petrochemical products. This generated a 3.0 billion yen positive effect , successfully offsetting the majority of the cost increases.
- Unit Consumption/Operating Rate/Other (-1.4 billion yen) : Profit was weighed down by lower manufacturing efficiency, reduced operating rates due to production adjustments, and rising logistics and material costs.
- Other (+0.8 billion yen) : Cost-cutting measures and improved performance at subsidiaries provided support.
Ultimately, the inability to fully absorb the surge in raw material costs (-3.6 billion yen) through price pass-throughs (+3.0 billion yen) was the primary cause of the operating profit decline.
3. Segment Performance
① Chemicals Segment (Lower Revenue and Profit)
- Net Sales : 24.6 billion yen (-10.0% YoY)
- Operating Profit : 0.5 billion yen (-81.8% YoY)
- Trends : Caustic soda profit declined due to lower volume and higher costs. Vinyl chloride resin maintained year-ago levels through domestic price revisions despite higher costs. Soda ash and calcium chloride suffered from rising manufacturing and logistics costs.
② Cement Segment (Flat YoY)
- Net Sales : 16.0 billion yen (±0.0% YoY)
- Operating Profit : 2.5 billion yen (+1.2% YoY)
- Trends : Despite a decline in domestic shipments due to sluggish construction demand, profit was maintained through earnings improvement measures at consolidated subsidiaries and rigorous cost-cutting.
③ Electronic & Advanced Materials Segment (Higher Revenue and Profit)
- Net Sales : 22.3 billion yen (+5.2% YoY)
- Operating Profit : 3.1 billion yen (+11.2% YoY)
- Trends : Polycrystalline silicon for semiconductors saw profit growth due to reduced inventory valuation losses, despite lower volume. IC chemicals (e.g., high-purity IPA) saw increased volume. Fumed silica and thermal interface materials also performed steadily, driving overall company earnings.
④ Life Science Segment (Significant Revenue and Profit Growth)
- Net Sales : 14.6 billion yen (+61.3% YoY)
- Operating Profit : 2.6 billion yen (+55.0% YoY)
- Trends : Driven by the new consolidation of the TLS Group . Dental materials performed well, particularly overseas, aided by the weak yen. APIs and intermediates for generic drugs also saw steady shipment growth.
⑤ Environmental Business Segment (Lower Revenue, Operating Loss)
- Net Sales : 1.0 billion yen (-26.8% YoY)
- Operating Profit : -0.0 billion yen (vs. -0.1 billion yen in the same period last year)
- Trends : While the waste gypsum board recycling business improved, lower shipments of ion-exchange membranes and equipment led to a small operating loss.
4. FY2027 Full-Year Forecast and Growth Story
With greater clarity on olefin procurement (volume and price), the company has released its full-year earnings forecast for FY2027 .
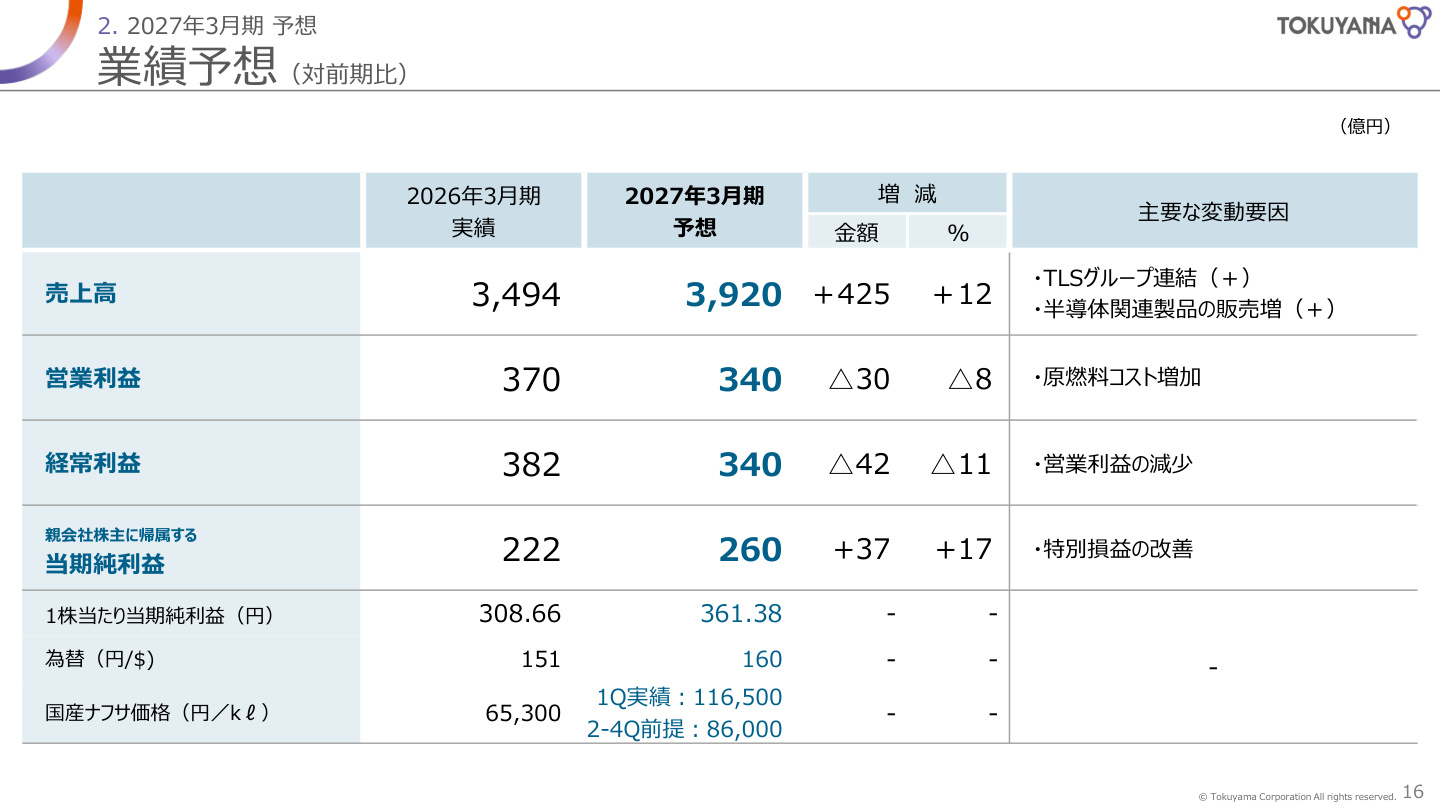
Analysis of Slide Data and Forecast Highlights
- Full-Year Forecast Figures :
- Net Sales : 392.0 billion yen (+12.2% YoY)
- Operating Profit : 34.0 billion yen (-8.2% YoY)
- Ordinary Profit : 34.0 billion yen (-11.2% YoY)
- Net Income : 26.0 billion yen (+17.0% YoY)
- Assumptions : Exchange rate of 160 JPY/USD ; Naphtha price of 116,500 JPY/kl (Q1 actual) and 86,000 JPY/kl (Q2-Q4 assumption) .
- Outlook : While raw material costs will continue to pressure operating profit, the company expects a 12% revenue increase due to the full-year contribution of the TLS Group and expansion in semiconductor materials. With improvements in extraordinary items, the company targets a record-level net income of 26.0 billion yen (+17%) .
5. Capital Policy and Investment Plan
① Shareholder Returns (4th Consecutive Dividend Increase)
Tokuyama aims for a DOE (Dividend on Equity) of 4% by FY2030 . For FY2027, the company plans:
- Interim Dividend : 60 yen
- Year-end Dividend : 72 yen
- Annual Dividend : 132 yen ( +12 yen increase from the previous year)
- Payout Ratio : 36.5% ; DOE : 3.4%
② Accelerated Growth Investment
- Capital Expenditure : 46.1 billion yen (+13.3 billion yen YoY)
- Depreciation : 23.8 billion yen; R&D Expenses : 21.3 billion yen
- Key Projects : Construction of the polycrystalline silicon plant in Vietnam , expansion of high-purity IPA recycling facilities , introduction of aluminum nitride filler production equipment , and cullet fuel conversion .
6. Conclusion
Tokuyama’s Q1 FY2027 results demonstrated resilience. While rising raw material costs pressured profits, the company successfully utilized price pass-throughs and growth in high-value-added segments like Life Science and semiconductor materials. With a full-year net income target of 26.0 billion yen, a planned dividend increase to 132 yen, and 46.1 billion yen in growth investments, the company is steadily executing its portfolio shift toward electronic materials and healthcare.
This content is not intended as investment advice or a recommendation. Any opinions expressed are solely the personal views of each article.