


CS Lumber: Deep Dive Analysis of FY2026 Financial Results and Growth Strategy

StockClub
Published: Jul 28, 2026, 09:58 AM
Sentiment Analysis
1. FY2026 Financial Overview: Steady Business Structural Transformation Amidst Market Headwinds
CS Lumber Co., Ltd. (Securities Code: 7808) reported its full-year financial results for the fiscal year ended May 2026, with net sales of ¥20,381 million (down 1.4% YoY), operating profit of ¥1,134 million (down 36.1% YoY), ordinary profit of ¥1,002 million (down 40.4% YoY), and profit attributable to owners of the parent of ¥693 million (down 40.1% YoY).
Despite facing a challenging external environment characterized by a decline in new housing starts and intensifying price competition, the company’s core pre-cut business faced significant pressure. However, growth in other segments, such as construction contracting and real estate leasing, provided a crucial buffer for the overall performance.
The following table summarizes the financial highlights for the fiscal year ended May 2026.
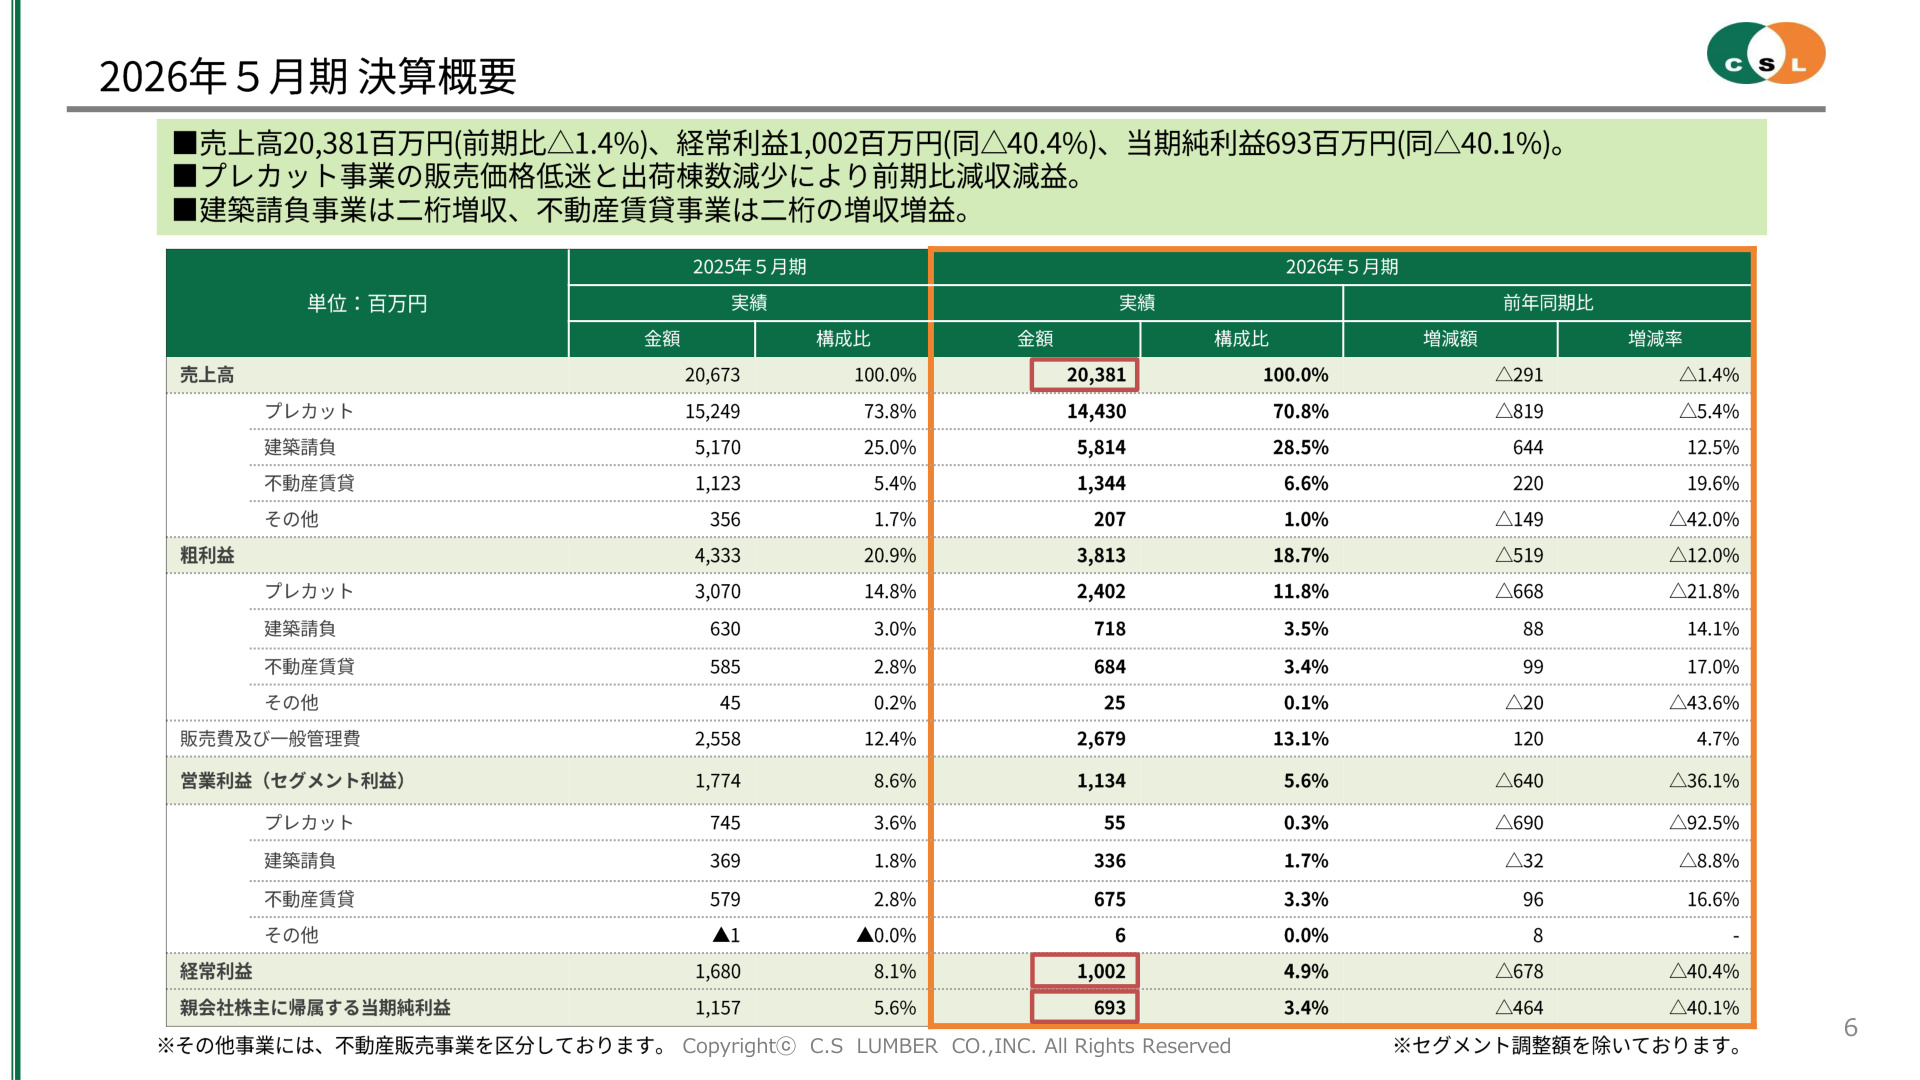
[Slide 6: Overview and Significance of FY2026 Financial Results] This slide presents the fundamental data visualizing performance by segment for FY2026. While overall net sales saw only a marginal decline, the drop in operating profit to ¥1,134 million reflects a stark contrast in performance between segments. In particular, the core Pre-cut Business acted as a drag on overall results, recording net sales of ¥14,430 million (down 5.4% YoY) and segment profit of ¥55 million (down 92.5% YoY). Conversely, the Construction Contracting Business achieved net sales of ¥5,814 million (up 12.5% YoY), and the Real Estate Leasing Business posted net sales of ¥1,344 million (up 19.6% YoY) and segment profit of ¥675 million (up 16.6% YoY), both achieving double-digit growth. This indicates a successful shift toward a diversified business portfolio, reducing reliance on the pre-cut business alone.
2. Detailed Segment Analysis
(1) Pre-cut Business: Profit Squeeze Due to Market Deterioration and Lower Shipment Volume
In the pre-cut business, the number of units shipped fell to 5,106 (down 6.9% YoY) due to the slowdown in the housing market. By construction method, traditional post-and-beam construction dropped to 3,815 units (down 6.5% YoY), and 2x4 construction fell to 1,291 units (down 8.1% YoY). Total floor area shipped also remained sluggish at 212,000 tsubo (down 4.5% YoY). Furthermore, the decline in sales prices following the drop in lumber prices exacerbated the situation, significantly eroding the gross profit margin per unit and forcing segment profit down to ¥55 million .
(2) Construction Contracting Business: Progress in Large-Scale Projects and Area Expansion
In the construction contracting business, net sales expanded to ¥5,814 million (up 12.5% YoY) as projects reached completion. Notably, the company strengthened its focus on large-scale wooden facilities (over 50 tsubo), with 20 units started and contract amounts reaching ¥2,693 million (up 27.6% YoY), demonstrating steady progress in scaling up projects. Although segment profit decreased slightly to ¥336 million (down 8.8% YoY) due to labor costs, the company maintains a stable order backlog of ¥1,251 million .
(3) Real Estate Leasing Business: Accelerated Growth as a High-Profit Stable Foundation
Driven by aggressive acquisition of new properties, the number of leased and managed units in the real estate leasing business expanded to 66 (an increase of 11 units YoY). The portfolio consists of 23 childcare facilities, 3 nursing care facilities, and 40 others (apartments, welfare facilities, etc.), generating extremely high occupancy rates and stable rental income. With net sales of ¥1,344 million (up 19.6% YoY) and segment profit of ¥675 million (up 16.6% YoY), this segment has become a powerful pillar supporting the company's total operating profit.
3. Analysis of Operating Profit Variance and Financial Position
It is critical to understand the impact of specific factors on the ¥640 million decrease in operating profit, which fell from ¥1,774 million in the previous fiscal year to ¥1,134 million .
The following waterfall chart illustrates the detailed variance factors.
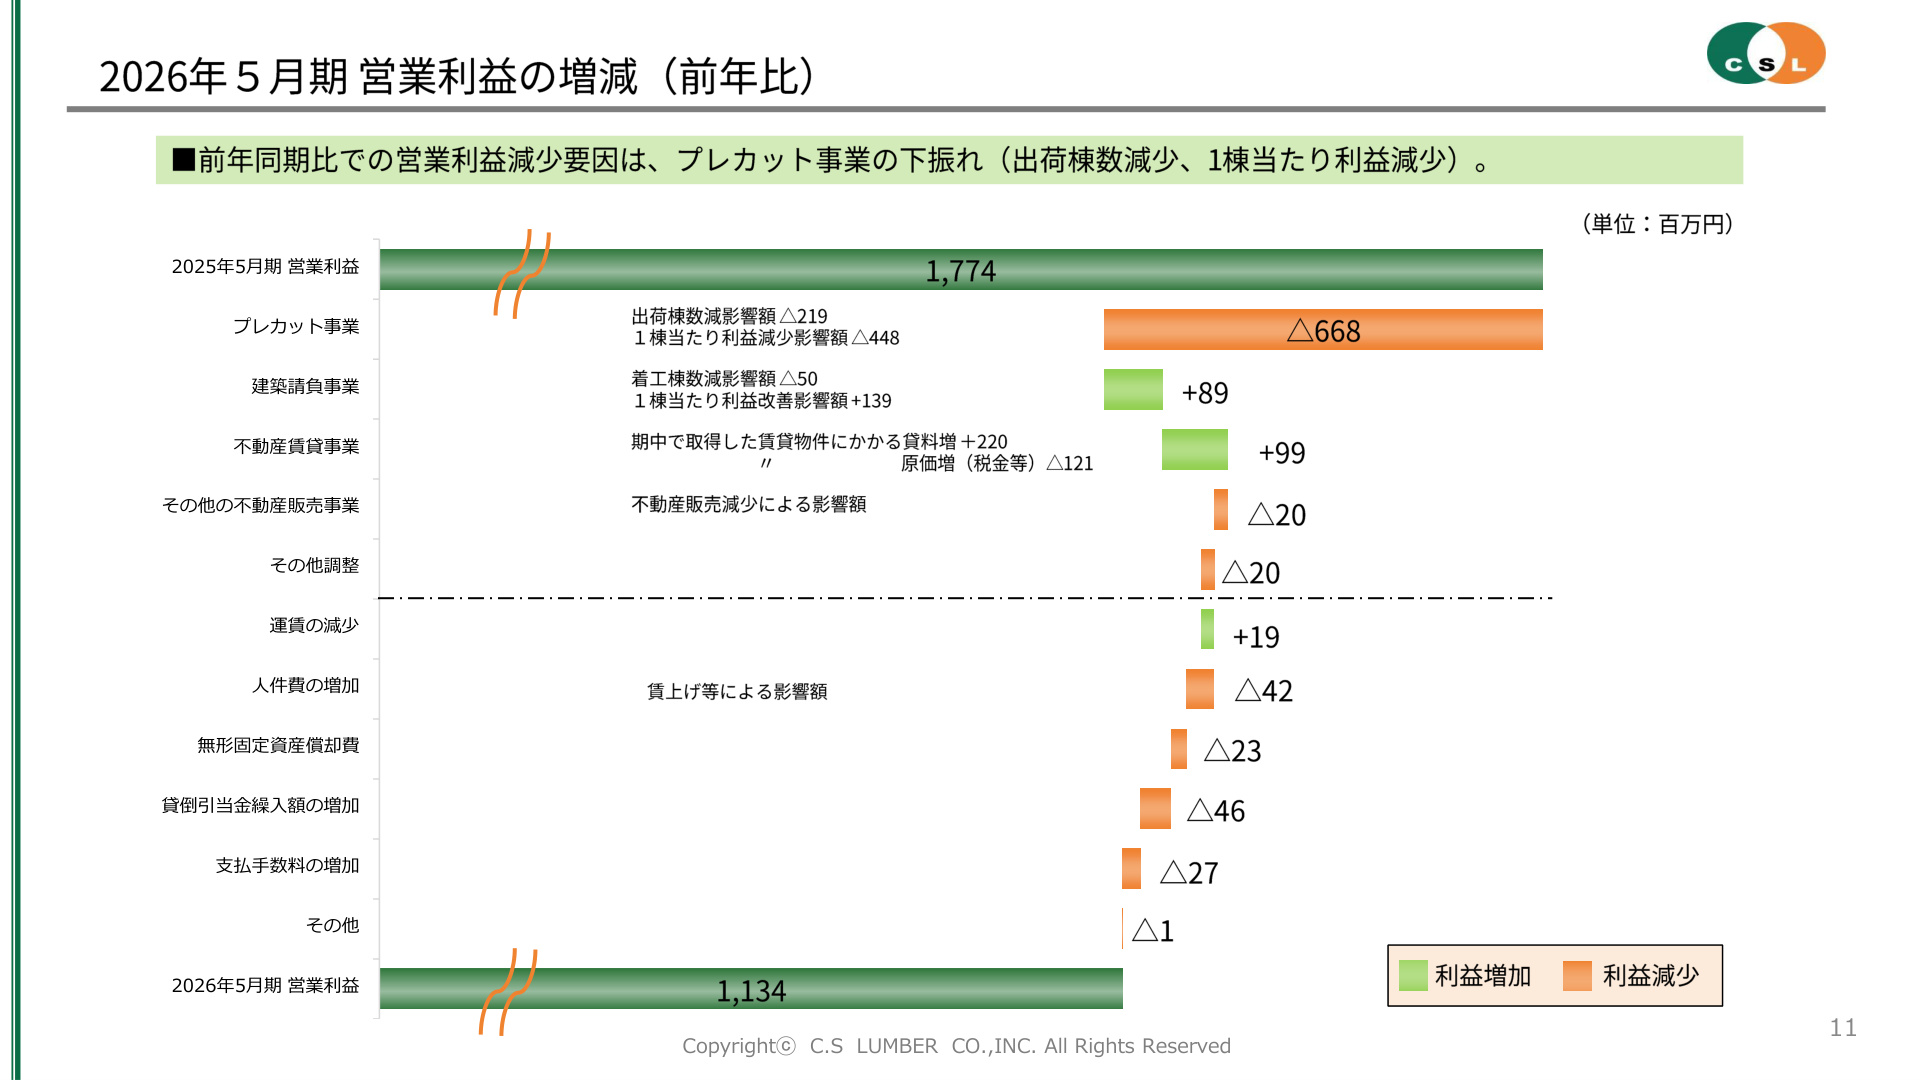
[Slide 11: Analysis of Operating Profit Variance] This slide is a key chart that clearly identifies the primary causes of the profit decline. The main driver of the decline was the underperformance of the Pre-cut Business (-¥668 million) . A breakdown shows that the impact of lower shipment volume was -¥219 million , while the impact of lower profit per unit (due to lower sales prices and worsening cost ratios) was -¥448 million , highlighting the significant damage caused by price erosion. In contrast, the improvement in profit per unit in the Construction Contracting Business (+¥139 million) and the increase in rental income from new properties in the Real Estate Leasing Business (+¥220 million) acted as positive factors. The structure shows that the company successfully absorbed increases in selling, general, and administrative expenses—such as rising labor costs (impact of -¥42 million) and increased provisions for doubtful accounts (-¥46 million)—to ultimately secure an operating profit of ¥1,134 million.
Financial Structure and Cash Flow
On the balance sheet, total assets expanded to ¥30,279 million (up ¥3,340 million from the end of the previous fiscal year). Tangible fixed assets increased to ¥19,998 million (up ¥3,570 million) due to active asset acquisitions, particularly for the real estate leasing business. Regarding funding, long-term borrowings increased to ¥9,201 million (up ¥2,580 million), while short-term borrowings were reduced to ¥1,905 million . The company maintains an "optimization of funding structure" by financing fixed asset investments with long-term funds. The equity ratio stands at 39.2% , and cash and deposits of ¥5,054 million ensure sufficient liquidity. In terms of cash flow, the company generated ¥1,835 million in net cash from operating activities, which was used to fund investment activities such as fixed asset acquisitions (-¥4,610 million) and financial procurement through long-term borrowings (+¥1,940 million).
4. FY2027 Earnings Forecast and V-Shaped Recovery Scenario
For the fiscal year ending May 2027, the company forecasts consolidated net sales of ¥21,000 million (up 3.0% YoY), operating profit of ¥1,490 million (up 31.4% YoY), ordinary profit of ¥1,270 million (up 26.7% YoY), and profit attributable to owners of the parent of ¥910 million (up 31.3% YoY).
The segment-specific plan is as follows:
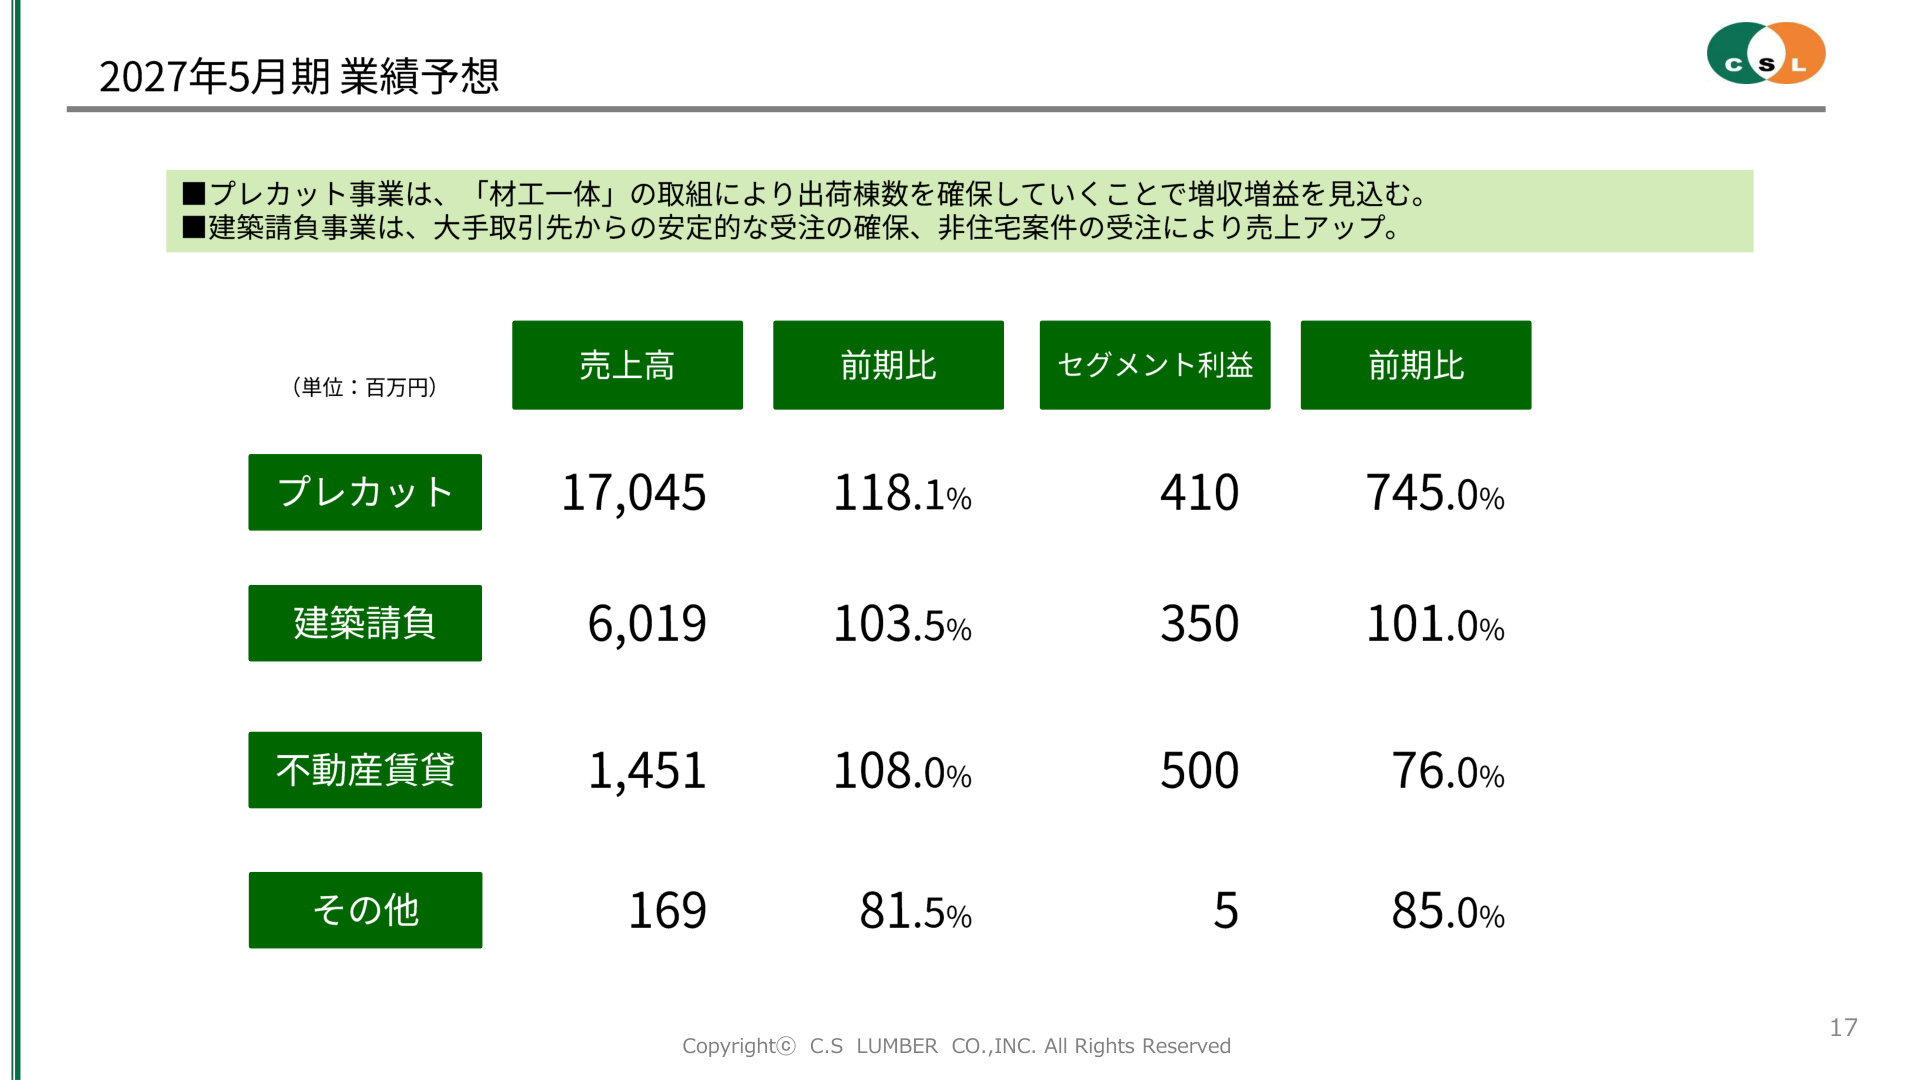
[Slide 17: FY2027 Segment Earnings Forecast] This slide presents the core data for the V-shaped recovery story in FY2027. The most notable point is the plan for the Pre-cut Business segment profit to recover sharply from ¥55 million in the previous year to ¥410 million (up 745.0% YoY) . Net sales are also expected to reach ¥17,045 million (up 18.1% YoY). In addition to a recovery in shipment volume (planned at 5,329 units ), the driving force for profit improvement will be the promotion of "integrated material and construction" orders (a method of proposing and receiving orders for both pre-cut material delivery and on-site assembly by carpenters) to enhance value-added services and pursue thorough cost yield management. Furthermore, the Construction Contracting Business is expected to remain steady with net sales of ¥6,019 million (up 3.5% YoY) and segment profit of ¥350 million (up 1.0% YoY), while the Real Estate Leasing Business is structured to maintain a stable profit base by sustaining segment profit at ¥500 million .
5. Progress of Mid-Term Management Plan 2028 and Long-Term Vision "VISION 2032"
The company has formulated and is implementing its long-term vision, "VISION 2032," aimed at its 50th anniversary, along with its intermediate step, the **"Mid-Term Management Plan 2028."
(1) Integrated "Material and Construction" Proposals and Strengthening the Customer Base
To address the structural challenge of declining housing starts, the company is strengthening its ** "integrated material and construction" ** sales method, which bundles construction (assembly work) with the sale of pre-cut components. By training carpenters and drivers within the group, the company ensures construction capabilities and enhances its proposal power to builders and housing manufacturers. The company also aims to transform into a "smart factory" by introducing unmanned processing machinery and production management systems.
(2) Comparison with Mid-Term Management Plan 2028 Numerical Targets
Progress toward the targets for the fiscal year ending May 2028 is as follows:
- ** Pre-cut units **: FY2026 actual ** 5,106 ** → FY2028 target ** 5,900 **
- ** Assembly units **: FY2026 actual ** 725 ** → FY2028 target ** 1,040 **
- ** Construction completions **: FY2026 actual ** 188 ** → FY2028 target ** 280 **
- ** Real estate sales lots **: FY2026 actual ** 10 ** → FY2028 cumulative target ** 30 **
(3) Shareholder Return Policy and Financial Strategy
Regarding dividend policy, based on the fundamental principle of balancing the strengthening of management foundations with the maintenance of continuous and stable dividends, the company forecasts an annual dividend of ** ¥80 per share ** (year-end dividend of ¥80) for the fiscal year ending May 2027. To improve its financial position, the company has set a long-term financial health goal to reduce interest-bearing debt to less than ¥2.5 billion by 2032, while securing annual rental income from profitable leased properties (projected at ** ¥1,423 million** in the future) as a stable source of revenue.
In this way, CS Lumber is mapping out a roadmap to enhance corporate value over the medium to long term by responding to environmental changes in the pre-cut market through two main pillars: increasing value-added services via "integrated material and construction" and expanding its stock-based revenue foundation through the real estate leasing business.
This content is not intended as investment advice or a recommendation. Any opinions expressed are solely the personal views of each article.