


SMK (6798) FY2026 Q1 Earnings Deep Dive: Operating Profitability Achieved Through Structural Reform and Growth Drivers by Market and Region

StockClub
Published: Jul 28, 2026, 09:56 AM
Sentiment Analysis
SMK Corporation (Securities Code: 6798) reported its FY2026 Q1 (three months ended June 30, 2025) financial results , with net sales increasing by 4.0% year-on-year to 11.472 billion yen . The company achieved a turnaround to an operating profit of 6 million yen , compared to an operating loss of 280 million yen in the same period last year.
This report provides a multi-faceted analysis of 10 key topics derived from the earnings presentation materials—including overall performance, structural reform of the profit/loss structure, segment-specific results, market and regional trends, foreign exchange impacts, financial foundation, and full-year outlook—to explain the company's business environment and future growth strategies.
1. FY2026 Q1 Earnings Highlights: Achieving Operating Profitability
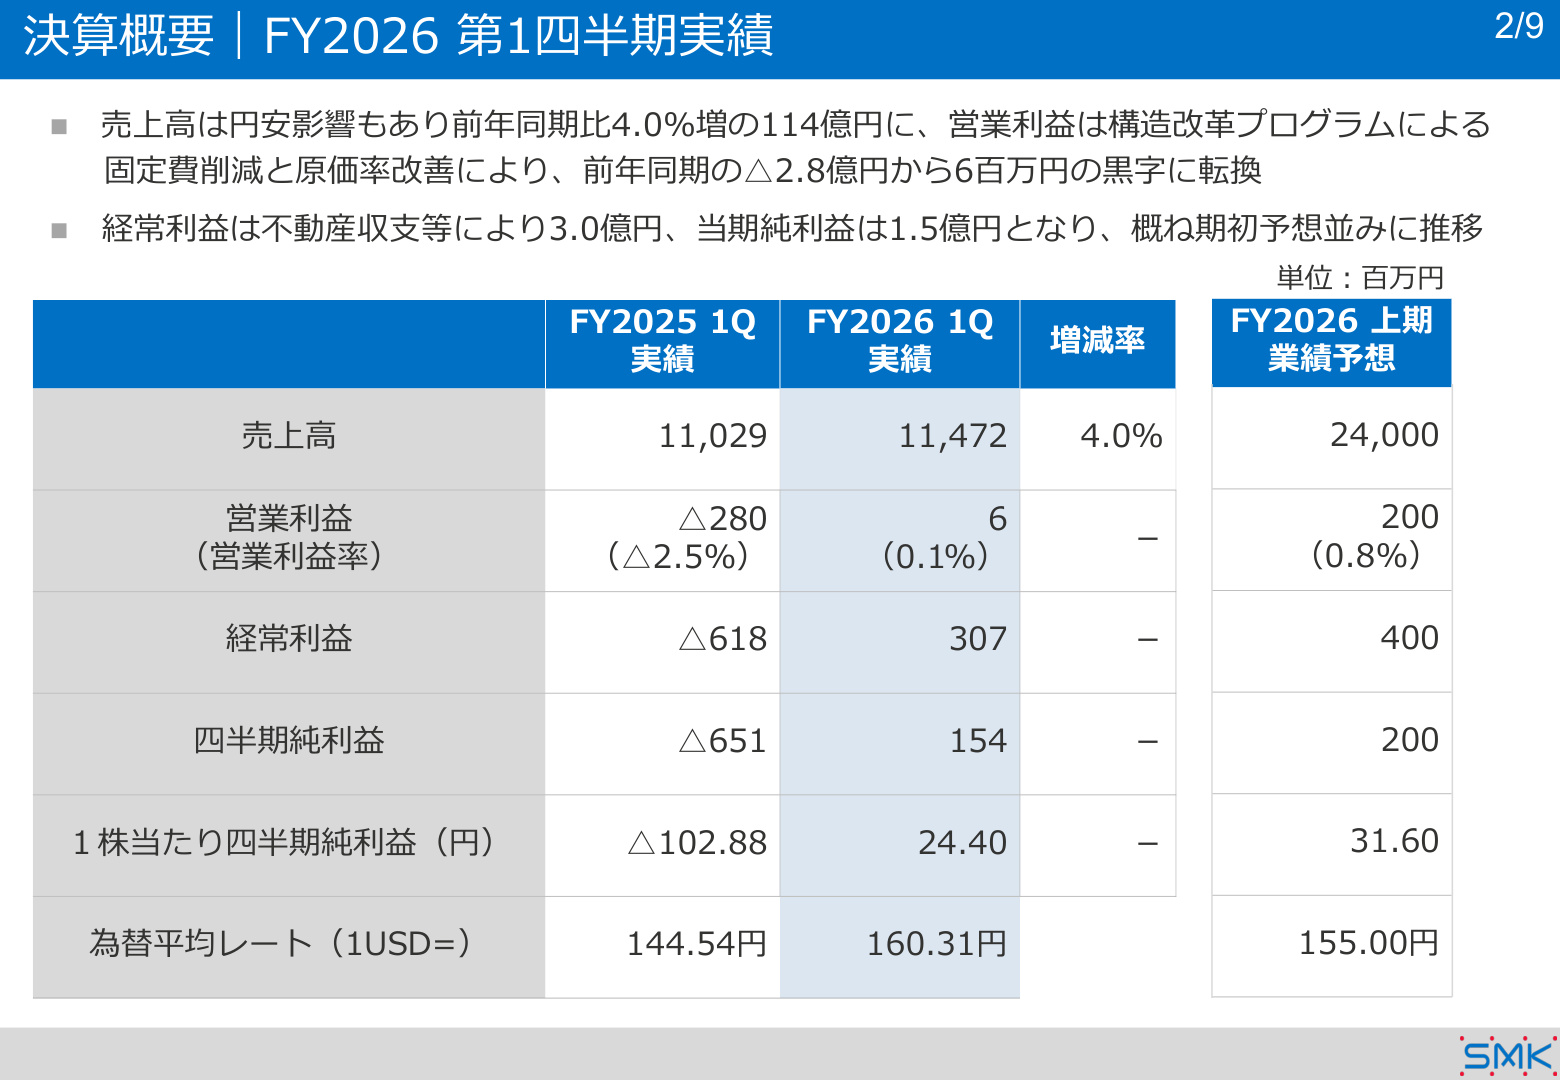
The key consolidated performance indicators for SMK in the first quarter are as follows:
- Net Sales : 11,472 million yen ( +4.0% YoY)
- Operating Profit : 6 million yen (vs. -280 million yen loss in the same period last year)
- Ordinary Profit : 307 million yen (vs. -618 million yen loss in the same period last year)
- Quarterly Net Profit : 154 million yen (vs. -651 million yen loss in the same period last year)
- Earnings Per Share (EPS) : 24.40 yen
- Average Exchange Rate : 1 USD = 160.31 yen (vs. 144.54 yen in the same period last year)
Slide Commentary (PAGE_1)
The slide above summarizes the FY2026 Q1 results, year-on-year comparisons, and first-half forecasts. Net sales grew steadily, partly due to the weak yen , and the company achieved a return to profitability across all profit categories compared to the losses recorded in the same period last year. The growth in ordinary profit to 307 million yen was supported by non-operating income, such as real estate-related earnings. The results are largely in line with initial forecasts, marking a steady first step toward a V-shaped recovery.
2. Structural Reform and Analysis of Operating Profit Variance
The improvement in operating profit by 286 million yen —from a loss of 280 million yen to a profit of 6 million yen—is the result of clear internal efforts and external factors.
Slide Commentary (PAGE_5)
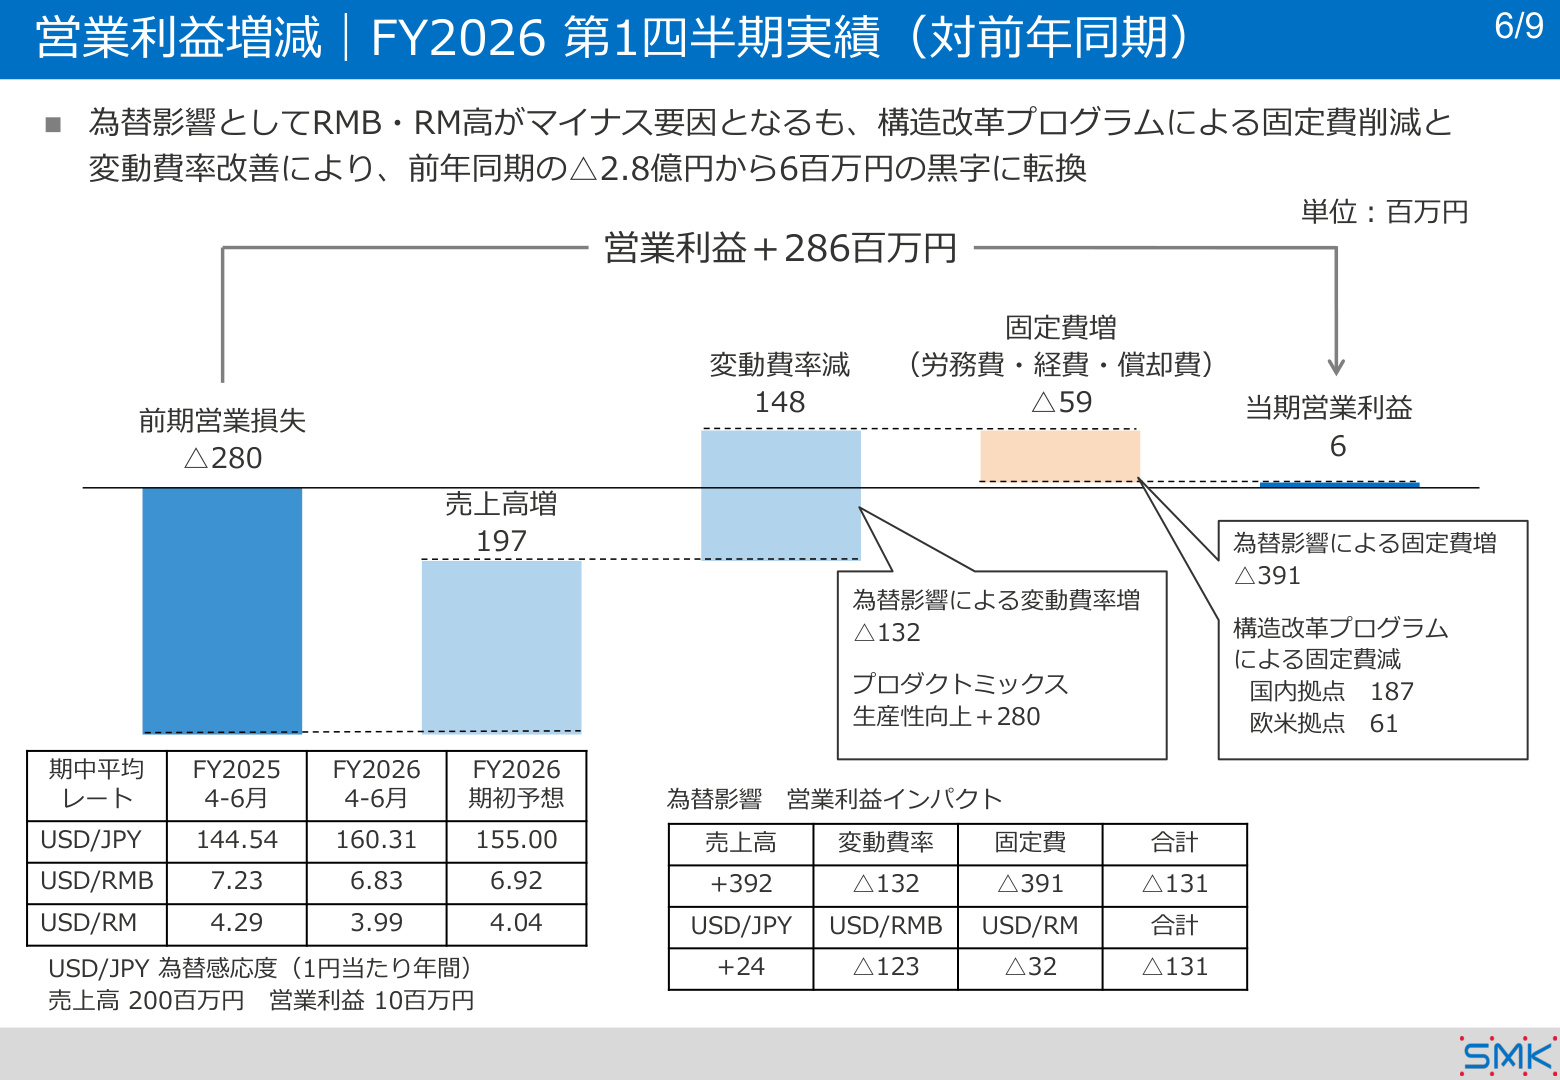
This waterfall chart is a critical slide visually representing the factors behind the change in operating profit from the previous year. The main drivers are as follows:
- Product Mix Improvement and Productivity Gains : A positive impact of +280 million yen . The shift toward high-value-added products and improved manufacturing efficiency strongly boosted profits.
- Fixed Cost Reduction via Structural Reform Program : A reduction of +248 million yen (+187 million yen in domestic operations, +61 million yen in overseas operations). While there was a standard increase in fixed costs (labor, expenses, and depreciation) of 59 million yen, the structural reform effects significantly outweighed these costs.
- Impact of Increased Sales : A positive contribution of +197 million yen .
- FX Volatility and Cost Increases : A total negative impact of 131 million yen due to FX, including increased variable costs (132 million yen) and fixed costs (391 million yen) driven by the strength of the Chinese Yuan (RMB) and Malaysian Ringgit (RM).
The most notable takeaway is that despite the impact of rising procurement and local costs due to FX, the company successfully absorbed these pressures through self-driven structural reforms and productivity improvements , achieving a return to profitability.
3. Detailed Performance by Segment
Looking at the business segments, the core CS Division is the primary driver of performance.
Slide Commentary (PAGE_2)
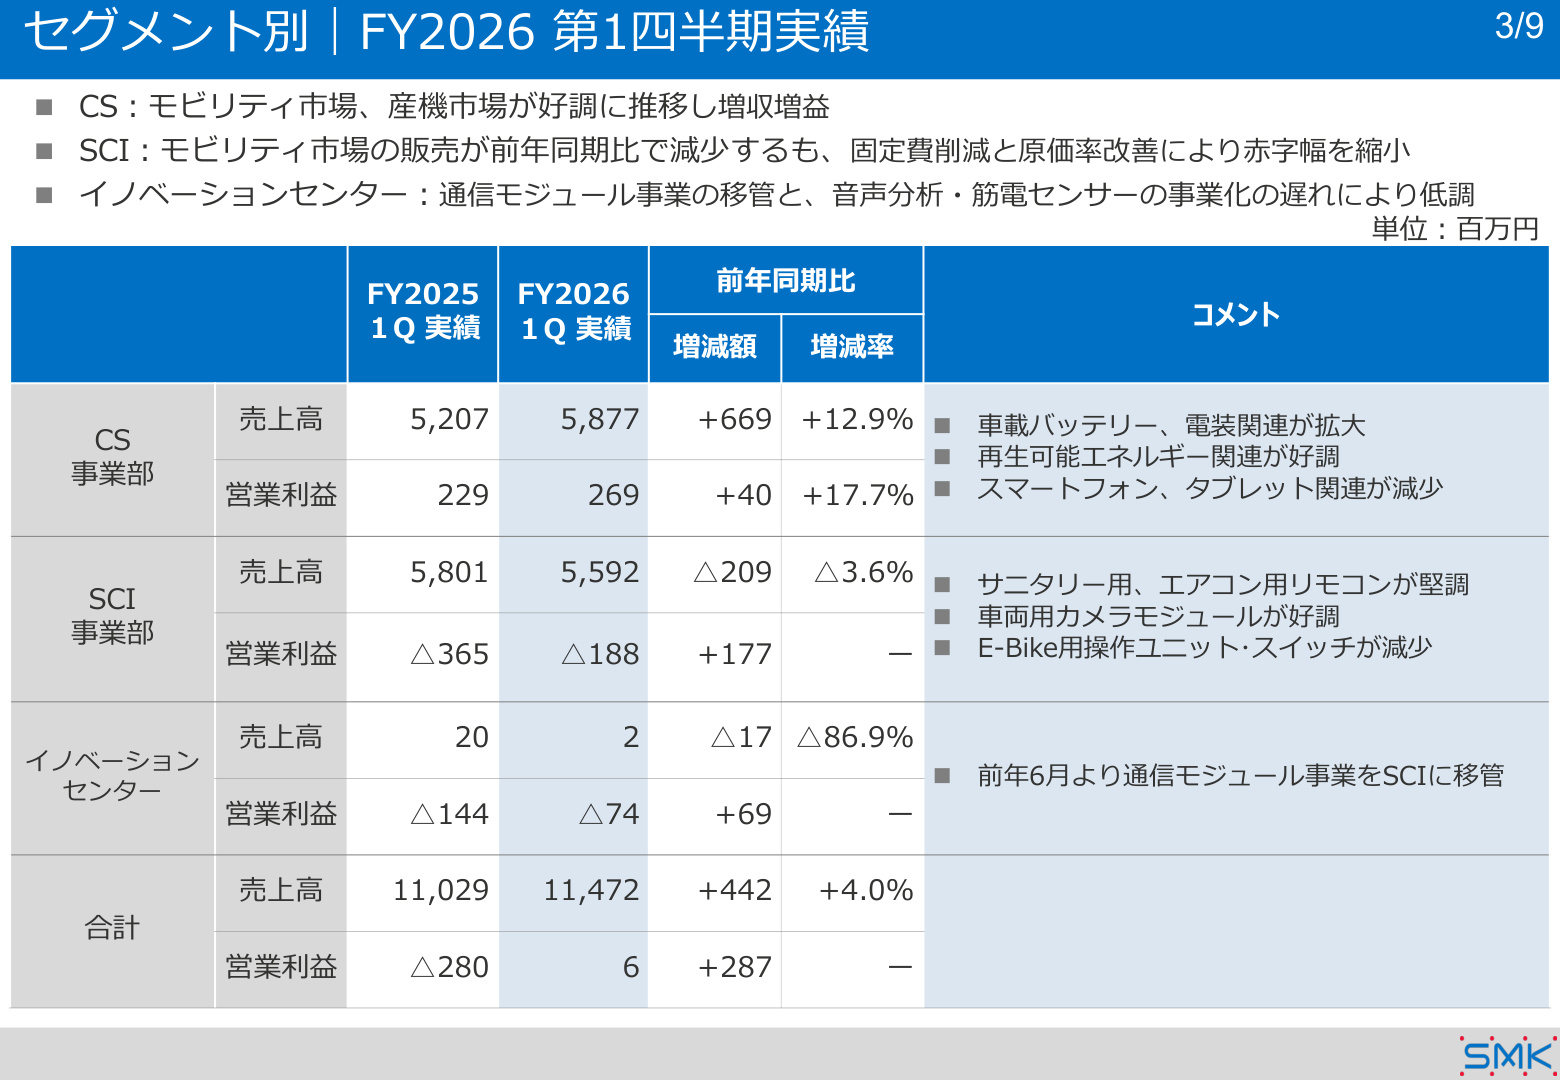
This slide shows the year-on-year changes in sales and profit for the three segments—CS Division, SCI Division, and Innovation Center—along with qualitative commentary.
-
CS Division (Connectors and Connection Parts) :
- Net Sales: 5,877 million yen ( +12.9% YoY)
- Operating Profit: 269 million yen ( +17.7% YoY)
- Trends : Achieved growth in both sales and profit, driven by significant expansion in automotive batteries , electrical component connectors , and renewable energy-related products . This growth more than offset the decline in smartphone and tablet-related products.
-
SCI Division (Switches, Input Devices, Remote Controls, etc.) :
- Net Sales: 5,592 million yen ( -3.6% YoY)
- Operating Profit: -188 million yen (loss narrowed from -365 million yen last year)
- Trends : While sanitary and air conditioner remote controls and vehicle camera modules remained steady, sales declined due to a decrease in E-Bike operation units and switches. However, the company narrowed the loss by 177 million yen through fixed cost reductions and improved cost-of-sales ratios.
-
Innovation Center :
- Net Sales: 2 million yen ( -86.9% YoY)
- Operating Profit: -74 million yen (loss narrowed from -144 million yen last year)
- Trends : Performance remains sluggish due to the transfer of the communication module business to the SCI Division last June and delays in commercializing voice analysis and electromyography sensors. However, profitability has improved through the streamlining of R&D organizations.
4. Analysis of Sales by Market and Region
Trends by Market (Application Analysis)
- Mobility : Net sales of 3,832 million yen ( +8.5% YoY). Strong growth in automotive battery/electrical connectors and vehicle camera modules .
- Industrial/Other : Net sales of 1,544 million yen ( +57.6% YoY). Demand for renewable energy-related connectors surged, recording a high growth rate.
- Information & Communication : Net sales of 1,156 million yen ( -25.6% YoY). Declined due to adjustments in the smartphone and tablet market.
- Home Appliances : Net sales of 4,938 million yen ( -0.5% YoY). While there was a decline in housing and home appliance remote controls, this was offset by sanitary/air conditioner remote controls and amusement-related connectors, keeping sales nearly flat.
Trends by Region (Geographic Analysis)
- China : Net sales of 2,813 million yen ( +25.1% YoY). Notable expansion in renewable energy and automotive battery-related connectors.
- Europe : Net sales of 578 million yen ( +29.9% YoY). Contributed by growth in automotive connectors.
- Japan : Net sales of 3,974 million yen ( -1.4% YoY). Sanitary and amusement-related products remained steady.
- North America : Net sales of 2,174 million yen ( -2.9% YoY). Impacted by a decrease in tablet connectors.
5. Financial Position and Balance Sheet Changes
The balance sheet as of the end of June 2026 (end of Q1) maintains a healthy status:
- Total Assets : 59,454 million yen ( +1,828 million yen from the end of the previous fiscal year)
- Cash and deposits increased by 1,347 million yen to 11,020 million yen .
- Inventories increased by 1,318 million yen to 8,060 million yen , while notes and accounts receivable decreased by 1,434 million yen to 11,867 million yen .
- Liabilities : 28,156 million yen ( +1,687 million yen from the end of the previous fiscal year)
- Interest-bearing debt is 14,786 million yen ( +572 million yen ).
- Net Assets : 31,298 million yen ( +141 million yen from the end of the previous fiscal year)
- Equity Ratio : 52.6% (down 1.5 points from 54.1% at the end of the previous fiscal year)
With cash and deposits accumulated to the 11 billion yen level through improved collection of receivables and cash management, and an equity ratio maintained above 50%, the company possesses a solid financial foundation to drive business structural reforms.
6. FY2026 Full-Year Forecast and Shareholder Return Policy
The company has maintained its full-year FY2026 earnings forecast as initially announced.
- Full-Year Net Sales Forecast : 49,000 million yen ( +1.7% YoY)
- Full-Year Operating Profit Forecast : 800 million yen ( +86.0% YoY)
- Full-Year Ordinary Profit Forecast : 1,200 million yen ( -3.5% YoY)
- Full-Year Net Profit Forecast : 800 million yen ( +1,328.6% YoY)
- Full-Year EPS Forecast : 126.41 yen
- Annual Dividend Forecast : 100.00 yen (Interim 50.00 yen / Year-end 50.00 yen)
- Assumed Exchange Rate : 1 USD = 155.00 yen
The company anticipates an operating profit margin of 1.6% for the full year. Given the Q1 progress (operating profit of 6 million yen), the plan expects further profit accumulation from Q2 onwards through the realization of structural reform effects and growth in high-value-added areas (mobility and renewable energy). The company also maintains its policy of providing a stable annual dividend of 100 yen.
This content is not intended as investment advice or a recommendation. Any opinions expressed are solely the personal views of each article.