


GA technologies Q3 FY2026 Earnings Deep Dive: Structural Growth and Progress Toward 10 Billion Yen in Operating Profit

StockClub
公開日時: Sep 14, 2026, 10:01 AM
Sentiment Analysis

1. Executive Summary: Balancing Sustained High Growth with Strategic Investment
GA technologies Co., Ltd. maintained robust revenue growth in the third quarter (cumulative and standalone) of the fiscal year ending October 2026, driven by the expansion of its core RENOSY Marketplace , the accumulation of its subscription (recurring) base , and a surge in its US business .
Key performance metrics for Q3 (standalone) are as follows:
- Net Revenue : 13.01 billion JPY (+23.5% YoY / +24% YoY)
- Operating Profit : 1.85 billion JPY (+6.7% YoY / +7% YoY)
- Key Segment Performance :
- RENOSY (Domestic) : Net Revenue 9.12 billion JPY (+13% YoY), Operating Profit 3.03 billion JPY (+2% YoY)
- ITANDI : Net Revenue 1.95 billion JPY (+23.7% YoY), Operating Profit 0.44 billion JPY (+26.6% YoY)
- US Business : Net Revenue 1.52 billion JPY (+160.8% YoY), Operating Profit 0.16 billion JPY (maintained profitability following a turnaround from the previous year's loss)
Despite investing approximately 500 million JPY in mass marketing (TV commercials, etc.) to expand brand awareness, the company successfully achieved an increase in operating profit. Furthermore, the integration of the SPG Securities Group (SPC Securities and SPC Asset Management) was completed this quarter, adding revenue from fractionalized real estate and asset management to the RENOSY segment.
2. Progress Toward Full-Year Forecasts and Profitability Probability
A critical aspect of this earnings report is the progress toward the full-year targets (Net Revenue: 55.9 billion JPY, Operating Profit: 10.0 billion JPY) in the context of seasonal fluctuations and expense allocation.
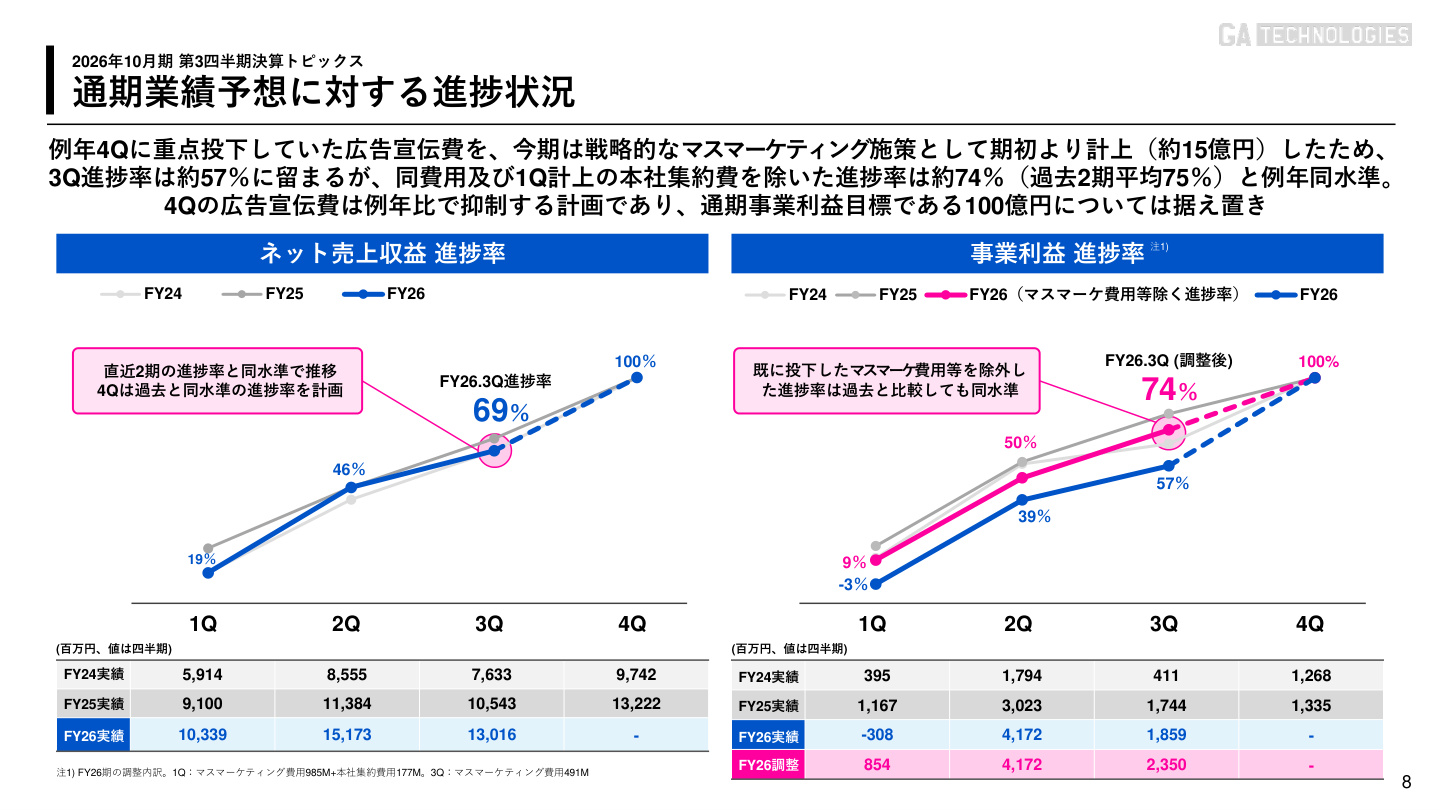
[Slide Commentary: Progress Structure Toward Full-Year Forecasts]
The slide above (P.8) clearly illustrates why the operating profit progress rate stands at 57% (3.89 billion JPY) and outlines the path to achieving the 10.0 billion JPY full-year target .
Historically, the company has concentrated advertising expenditures in the fourth quarter (Q4), its peak season. However, this fiscal year, the company strategically front-loaded mass marketing initiatives (approx. 1.5 billion JPY) from Q1 through Q3 . Excluding these mass marketing costs and the headquarters consolidation expenses recorded in Q1 (approx. 170 million JPY), the "adjusted progress rate" reaches 74% , which is in line with the two-year historical average of 75%.
For Q4, the company plans to curtail advertising expenses compared to previous years , as sufficient brand awareness and lead generation have already been secured in the first half and Q3. This structure enables high profit margins in Q4. Based on this, the full-year operating profit target of 10.0 billion JPY (+37.6% YoY) remains unchanged.
3. Resilience and Price Pass-Through in a Rising Interest Rate Environment
The company has provided detailed disclosures on its structural resilience against macroeconomic headwinds, such as rising mortgage rates and a decline in the number of transactions in the Tokyo used condominium market.
The company's ability to sustain growth during a period of rising interest rates is attributed to three factors:
- High-Income Customer Base : 50% of RENOSY owners earn over 10 million JPY annually . With high purchasing power and significant financial flexibility, they are less susceptible to short-term interest rate fluctuations.
- AI-Driven Property Selection : The company selects only properties with high rent-adjustment potential and asset value from a massive 5.0 trillion JPY property pipeline .
- Absorption via Inflation and Rent Increases : The company has successfully implemented rent increases that exceed the rise in interest payments on real estate investment loans.
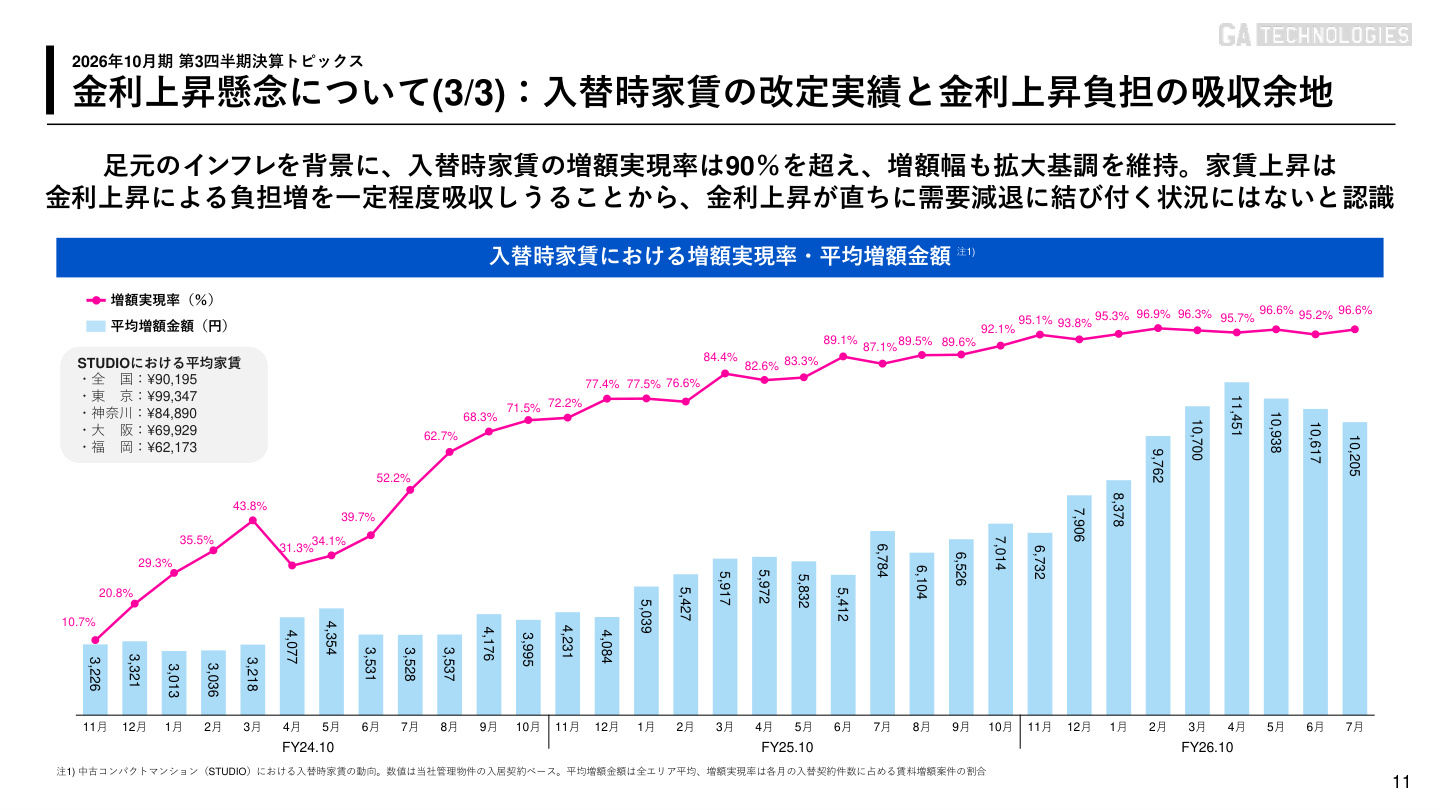
[Slide Commentary: Rent Revision Performance and Inflation Resilience]
The slide above (P.11) shows the trends in the "rent increase realization rate" and "average increase amount" for managed properties.
Driven by inflation and strong rental demand in urban areas, the recent rent increase realization rate at turnover reached 96.6% (maintaining a high level above 90%), and the average increase per unit has grown to 10,205 JPY/month . This robust rent growth offsets the increased interest burden for owners, proving with data that "rising interest rates do not immediately lead to a decline in investment demand."
4. RENOSY Marketplace: High Velocity and Superior Capital Efficiency
The RENOSY Marketplace boasts supply chain efficiency that sets it apart from traditional real estate brokerage firms.
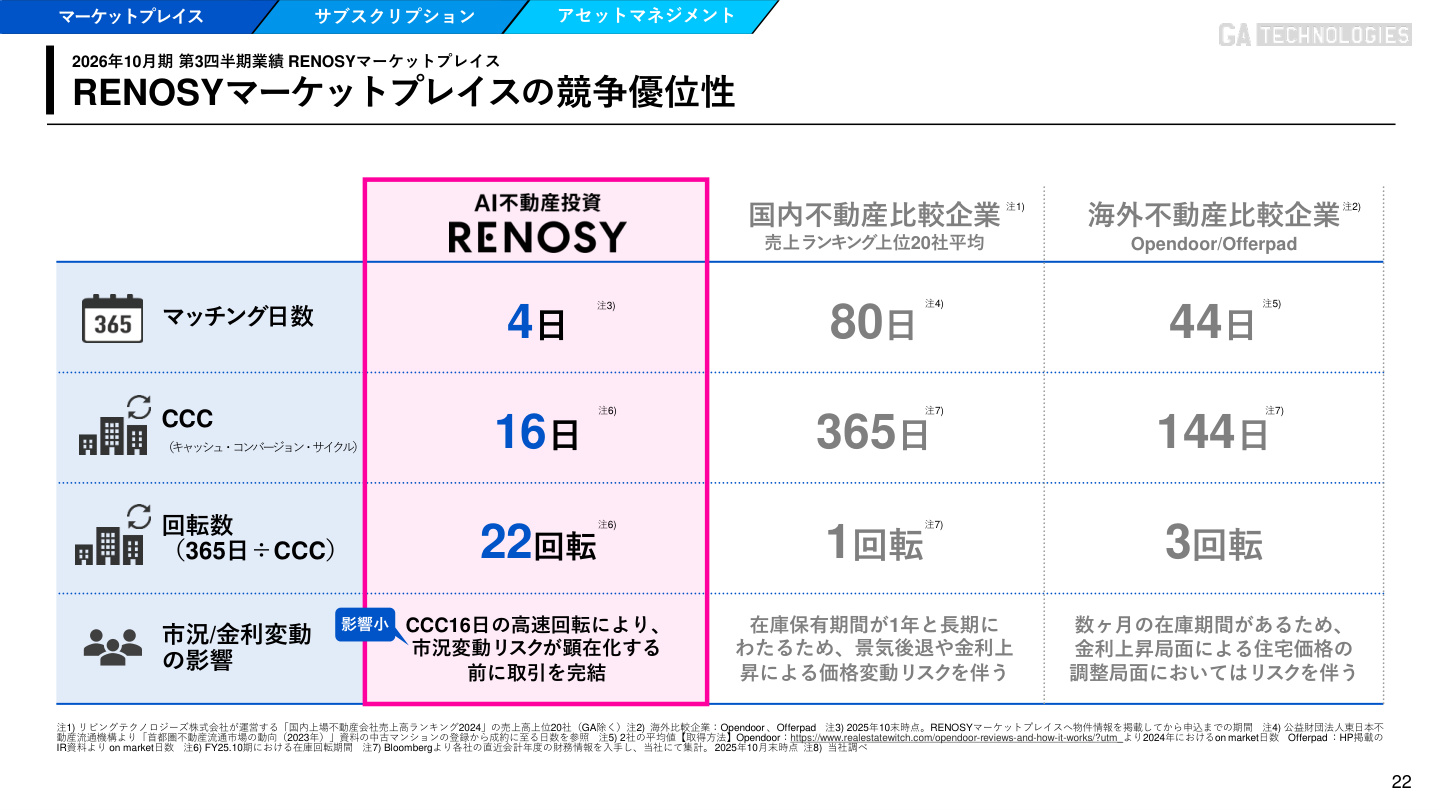
[Slide Commentary: Advantages of Superior Turnover (CCC of 16 Days)]
The slide above (P.22) compares efficiency metrics between RENOSY and domestic/international peers (average of 20 major domestic firms and US iBuyer giants Opendoor/Offerpad).
- Matching Time : 4 days (vs. 80 days for domestic peers, 44 days for international peers)
- CCC (Cash Conversion Cycle) : 16 days (vs. 365 days for domestic peers, 144 days for international peers)
- Annual Inventory Turnover : 22x (vs. 1x for domestic peers, 3x for international peers)
One of the greatest business risks in real estate tech is the "risk of inventory obsolescence and price decline" during market downturns. Through AI-based price assessment and instant online matching, RENOSY achieves high-speed operations with only 16 days from acquisition to sale and 22 turnovers per year . By avoiding long-term inventory holding, the company completes transactions before market volatility or interest rate risks materialize, achieving both extremely high capital efficiency and safety.
5. Key KPI Trends for the RENOSY Segment
The domestic RENOSY business is seeing steady growth in both flow revenue (marketplace) and stock revenue (subscriptions, asset management).
- Cumulative RENOSY Members : 677,000 (+16% YoY)
- Existing Owners : 18,458 (+14% YoY)
- Transaction Volume (Last 12 Months) : 8,225 (+874 YoY)
- Net Revenue per Transaction : 4.136 million JPY (upward trend due to expansion of product offerings such as family-type units)
- Subscription Units (Managed Properties) : 40,905 units (+32% YoY, surpassing the 40,000-unit milestone)
- Property Pipeline : 5.0 trillion JPY (+1.1 trillion JPY YoY)
- Asset Management Contribution : Following the integration of the SPC Securities Group, 120 million JPY in net revenue and 68 million JPY in operating profit were added in Q3, establishing a framework for capturing fractionalization and AM fees.
6. Growth of ITANDI and US Business
■ Real Estate Vertical SaaS "ITANDI"
- Net Revenue : 1.95 billion JPY (+23.7% YoY)
- Operating Profit : 0.44 billion JPY (+26.6% YoY)
- ARR : Continued high growth at +25% YoY
- Trends : In addition to the expansion of SaaS adoption among rental brokerage and management companies, initiatives to increase unit prices for lifeline services (electricity, gas, etc.) are progressing steadily. Despite temporary cost increases due to strengthening support systems to meet demand, the segment maintains high profit growth.
■ US Business (Marketplace)
- Net Revenue : 1.52 billion JPY (+160.8% YoY)
- Operating Profit : 0.16 billion JPY (maintained profitability)
■ Trends: Marketplace transactions in the acquired US platform are driving strong growth, and group synergies are being realized.
7. Evolution into an AI-Native Company and Conclusion
The company is moving beyond simply embedding AI into products; it is promoting a transformation into an "AI-Native Company" that redesigns the entire flow of "customer touchpoints, business processes, decision-making, and execution" using AI and data. This aims to eliminate reliance on individual expertise and build a scalable organizational foundation where anyone can make high-quality, rapid decisions and execute them.
Furthermore, to deepen dialogue with investors, the company has revamped its KPI disclosure system starting this quarter (e.g., consolidating details into the Factbook) to align with its growth drivers.
In summary, the Q3 FY2026 earnings report confirms revenue and profit growth while absorbing upfront investments (mass marketing) , proven resilience to rising interest rates , adherence to a high-efficiency business model with a 16-day CCC , and the continued expansion of ITANDI and the US business .
個別の投資に関する推奨やアドバイスを提供することを意図しておりません。ここで述べられている意見や見解は、あくまでも各記事の個人的見解です。